|
 |
|
|
|
Week 05 -2012 | From Jan 30 to Feb 03, 2012 |
|
 |
|
|
|
|
|
|
| |
|
|
|
|
|
|
|
|
|
|
| |
Economic Data for Week 05-2012 | Global View | Week Rating
| DATE |
DAY |
REPORT/CATEGORY |
HIGHLIGHTS ON WEEK 05-2012 |
Last |
|
Mon |
Personal Income |
Personal income increased $61.3 billion, or 0.5%, and disposable personal income (DPI) increased $47.1 billion, or 0.4%, in December. |
0.50% M/M |
|
 |
Consumer |
DPI decreased $4.1 billion, or less than 0.1%. Disposable income is what is left over after taxes. People spent less and saved more in December. Consumer spending was basically flatlined. |
|
|
Mon |
Consumer Spending |
Personal consumption expenditures (PCE) decreased $2.0 billion, or less than 0.1%. In November, personal income increased $7.4 billion, or 0.1%. |
0.00% M/M |
|
|
Consumer |
Consumer spending in December was sluggish. Weakness was in both durables and nondurables, reflecting in part a decline in auto sales and gasoline prices. |
|
|
Mon |
Core PCE |
The core PCE index surprised all with a higher than expected figure after it saw an increase of 0.2% which is two times the expected figure. |
0.20% M/M |
|
|
Inflation |
Inflation at the headline and core levels was soft. PCE inflation should be tame as the CPI for December was flat and the core CPI rose 0.1%. |
|
|
Tue |
ICSC Goldman Sachs Index |
Same-store sales edged 1 tenth higher in the January 28 week where the year-on-year rate jumped 1.1 percentage points to plus 3.9% for the best reading of January. |
0.10% W/W |
|
|
Sales and Inventories |
The report says January sales got a lift from demand for cold weather goods, demand that was pent up during the unseasonable warmth of December. |
|
|
Day2 |
Employment Cost Index (ECI) |
The employment cost index rose 0.4% in the fourth quarter, up from the third quarter's 0.3% rise. The year-on-year rate of plus 2.0% is unchanged from the prior quarter. |
0.40% Q/Q |
|
|
Employment |
Wages and salaries (which make up about 70% of compensation costs) also increased 0.4%. Benefits, 30% of compensation, increased 0.6%. |
|
|
Tue |
Johnson Redbook |
This month's colder weather has been boosting demand for winter goods, demand which was soft during the unusual warmth of December. Warm weather driving retail sales lower. |
2.00% Y/Y |
|
|
Sales and Inventories |
The same-store sales index shows a plus 2.0% rate, 5 tenths below the prior week and the worst reading since the Easter distortions of April and March. |
|
|
Tue |
S&P Case-Shiller Index |
The S&P/Case-Shiller 20-city composite home price index dropped 1.3% to take the year-on-year drop to 3.7%. U.S. house prices drop in November � their third straight decline. |
-0.7% M/M |
|
|
Real Estate |
The tumble has been particularly rough in Atlanta, where prices fell 2.5% on the month to bring the annual drop in the city to 11.8%, the worst of the 20 cities measured. |
|
|
Tue |
Chicago PMI |
Chicago PMI 60.2, weaker than forecast. January's Chicago PMI reading of 60.2 compares to 62.2 in December and a market consensus of 63.0, but remains quite healthy. |
60.20 Level |
|
|
Manufacturing |
Although analysts were forecasting a rise to 63.3 from December�s 62.5, the actual data was a disappointing 60.2. |
|
|
Tue |
Consumer Confidence |
We take a look at events for the day and try to decipher the answer to this question. Consumer Confidence in the U.S. decreases to 61.1 in January. |
61.10 Level |
|
|
Consumer |
The Conference Board's Consumer Confidence Index fell to 61.1, from a revised 64.8 in December. Economists had expected a reading of 68. |
|
|
Wed |
MBA purchase Applications |
Mortgage applications decreased 2.9% from one week earlier, for the week ending January 27, 2012.�The refinance index slipped 3.6% but volumes are high. |
-2.90% W/W |
|
|
Real Estate |
The Market Composite Index, a measure of mortgage loan application volume, decreased 2.9% on a seasonally adjusted basis from one week earlier. |
|
|
Wed |
Motor Vehicle Sales |
New-vehicle sales in the United States were unexpectedly strong in January, an early sign that the auto industry could have its best year since 2007, carmakers and analysts said Wednesday. |
14.20 Millions |
|
|
Sales and Inventories |
Sales increased 11.4% from January 2011. The industry�s annual selling rate, an important measure of its health, climbed to 14.18 million, the highest in more than two years. |
|
|
Wed |
ADP Employment Report |
ADP, released their proprietary private payrolls jobs report. This month ADP is reporting a gain of 170,000 private sector jobs in January. December 2011 was revised down from 325,000 to 292,000. |
170,000 Jobs |
|
|
Employment |
Regardless of the statistical differences between ADP and the BLS, this indicates a return to mediocre job growth potentially. The nation with an estimated 28 million people needs more jobs. |
|
|
Wed |
ISM Manufacturing Index |
The closely watched ISM index, which measures activity reported by U.S. purchasing managers in the econonomically pivotal manufacturing sector, rose to 54.1 in January from 53.1 in December. |
54.1 Level |
|
|
Manufacturing |
Manufacturing in the U.S. grew in January at the fastest pace in seven months, a sign the industry will lead the U.S. expansion early this year. |
|
|
Wed |
Construction Spending |
Multifamily construction will continue to improve given the ongoing shift from owning to renting and the lack of supply in the market. It will still be a very slow healing process. |
1.5% M/M |
|
|
Growth |
Construction spending in the U.S. rose in December at the fastest pace in four months, reflecting broad- based gains that signal the industry is stabilizing. |
|
|
Wed |
EIA Crude Oil Report |
Crude oil and gasoline inventories in the U.S. moved up during the week ended January 27. The week before, crude oil inventories increased by 3.60 million barrels to 334.80 million barrels. |
4.20M Barrels |
|
|
Commodity |
U.S. commercial crude oil inventories increased by 4.20 million barrels to 338.90 million barrels last week, and are in the upper limit of the average range for this time of year. |
|
|
Thu |
Challenger Job-Cut Report |
Layoff announcements rose to 53,486 in January from 41,785 in December in what is not a good signal for tomorrow's employment report. Challenger Report: Job Cuts Increased In January. |
53,486 |
|
|
Employment |
Planned job cuts for the month of January totaled 53,486. That's a 28% increase from December and the highest total since the 116,000 cuts announced in September. |
|
|
Thu |
Jobless/Initial Claims |
Weekly U.S. jobless claims fall 12,000 to 367,000. Layoffs continue to trend lower and point to improvement for the labor market. |
367,000 |
|
|
Employment |
U.S. jobless claims dropped by 12,000 to a seasonally adjusted 367,000 in the week ended Jan. 28. This is the third straight decline and the 8th decline in 9 weeks for the average |
|
|
Thu |
Productivity and Costs |
Nonfarm business sector labor productivity increased at a 0.7% annual rate during the fourth quarter of 2011. Productivity and unit labor costs are volatile on a quarterly basis. |
0.70% Q/Q |
|
|
Business Activity |
The gain in productivity reflects increases of 3.6% in output and 2.9% in hours worked. (All quarterly percent changes in this release are seasonally adjusted annual rates.) |
|
|
Thu |
EIA Natural Gas Report |
Gas supplies dropped by 132 billion cubic feet last week. The overall storage level of 2.97 trillion cubic feet remains well above five-year levels for this time of year. |
-132 bcf |
|
|
Commodity |
Natural gas prices climbed 6% Thursday after the government said the nation's supplies shrank last week. |
|
|
Thu |
U.S. Fed Balance Sheet |
For the February 1 week, the Fed's balance sheet expanded $5.4 billion, following a $0.1 billion uptick the prior week. |
|
|
|
Government |
The gain was led by a $2.8 billion increase in "other assets" (largely those denominated in foreign currencies). |
|
|
Thu |
M2 Money Supply |
Reserve Bank credit for the February 1 week nudged up $0.4 billion after a $1.5 billion increase the prior period. |
$4.5B W/W |
|
|
Money Supply |
|
|
|
Fri |
Fixed Mortgage Rates |
Mortgage rates hit record lows in the week ending Feb. 2, as the average rate on the 30-year fixed-rate mortgage fell to 3.87% from 3.98%. |
3.87%
APR
|
|
|
Interest Rates |
The 15-year fixed-rate mortgage also hit a record low, declining to 3.14% in the latest week from 3.24% in the prior week. |
|
|
Fri |
Employment Situation |
An improvement from December, as the unemployment rate dropped from 8.5% to 8.3%. the lowered unemployment rate was a result of the U.S. adding more than 240,000 jobs in January. |
8.30% Rate |
|
|
Employment |
Total nonfarm payroll employment rose by 243,000 in January, and the unemployment rate decreased to 8.3%� |
|
|
Fri |
ISM Non-Mfg Index |
January 2012 Non-Manufacturing ISM Report On Business NMI at 56.8%. Business Activity Index at 59.5% New Orders Index at 59.4% Employment Index at 57.4%. |
56.80 Level |
|
|
Business Actvity |
Economic activity in the non-manufacturing sector grew in January for the 25th consecutive month. |
|
|
Fri |
Factory Orders |
New orders for U.S. factory-made products posted a second straight monthly rise in December and business capital spending also picked up. |
1.10% M/M |
|
|
Manufacturing |
Orders for manufactured goods increased 1.1 per cent, slightly below Wall Street economist�s forecast for a 1.5-per-cent gain. |
|
|
|
|
|
|
|
|
| |
|
|
|
|
|
|
|
|
|
|
|
|
| |
|
|
|
|
| |
|
|
|
|
 |
Glossary: |
 |
Current Week |
|
Chart View |
 |
Positive View |
 |
Negative View |
 |
Flat View |
 |
Non Available |
|
| |
|
|
|
|
| |
|
|
|
|
|
|
|
|
|
|
| |
|
| WEEK 05-2012 ENDING FEB. 03 |
Reports Commentary
Although this is not good news for the retail industry which is highly dependent on personal expenditure it may be good news for households in general as it could imply that US spenders are finally beginning to save money and lose extravagancy.
Business activity in the U.S. Midwest grew more slowly than expected in January, according to the Institute for Supply Management-Chicago's index of Midwest business activity.
Consumer Confidence Falls Short of Forecast in January.
The Conference Board said that even though consumers were more upbeat about jobs, they were less optimistic about income prospects. Rising gas prices have also taken a toll on sentiment.
The pace of job creation by private employers slowed, adding 170,000 positions in January, but still met expectations, acc.
Employment in the U.S. nonfarm private business sector increased by 170,000 from December to January on a seasonally adjusted basis.
ADP Employment Change shows increase in private payrolls, but by less than what had been widely expected. Earnings generally remain strong.
ISM Manufacturing Index improves, but less than had been expected.
Construction spending climbs more than anticipated. Construction Spending in U.S. Climbs Most in Four Months in Stability Sign.
Initial claims fell 12,000 in the January 28 week to a slightly lower-than-expected total of 367,000.
Productivity growth slowed in the 4Q 2011 despite a gain in output as hours worked rose faster. The headline numbers appear to have worsened but the key driver was a boost in hours worked and this is good for the economy. Long-term trends for productivity and unit labor costs remain on track and are favorable.
The Fed sees longer-term rates reaching between 4% and 4.5%. Most mortgage rates eased to all-time record lows this week as fourth quarter growth in the economy fell short of market projections," said Frank Nothaft, Freddie Mac's chief economist. A year ago, the 30-year rate was at 4.81%.
The new commitment extends the prior statement that economic conditions were likely to keep rates at the historic low range of 0% to 0.25% until at least mid-2013.
Natural gas hit a 10-year low last month at $2.32 per 1,000 cubic feet, and the price is still less than half of it what it was in 2010.
The January jobs report posted stronger than expected with payroll gains and unemployment dip. Payroll jobs in January advanced 243,000 after jumping 203,000 in December
The NMI registered 56.8% in January, 3.8 percentage points higher than the seasonally adjusted 53% registered in December, and indicating continued growth at a faster rate in the non-manufacturing sector.
NMI In January, the NMI registered 56.8%, indicating continued growth in the non-manufacturing sector for the 25th consecutive month. A reading above 50% indicates the non- manufacturing sector economy is generally expanding; below 50% indicates the non-manufacturing sector is generally contracting. |
|
| |
|
|
|
|
|
|
|
|
|
|
|
|
|
|
|
|
|
|
|
|
|
|
|
|
|
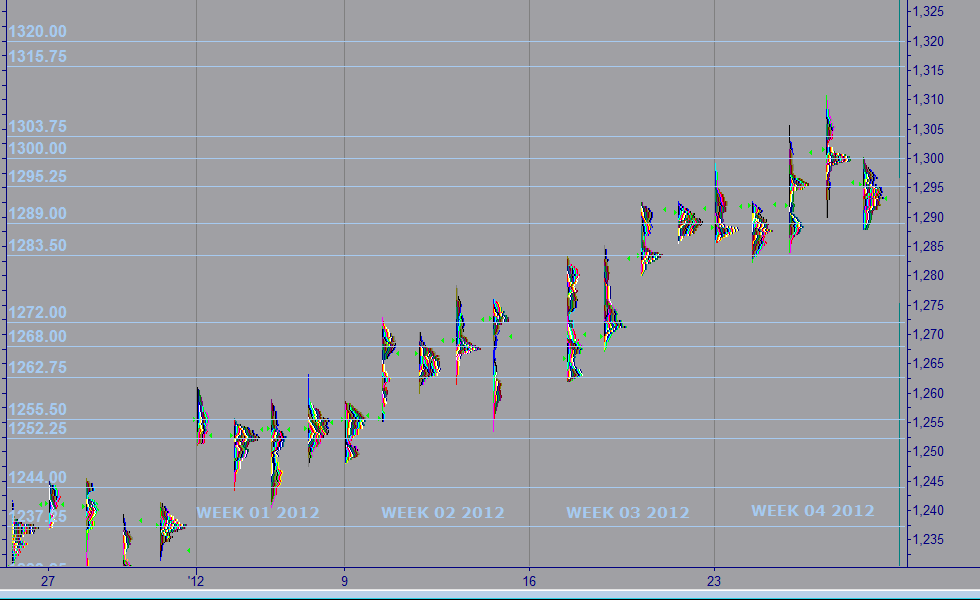
| MARKET PROFILE |
 |
WEEKS 2012 |
WEEK 05 |
% FROM CLOSE |
% FROM OPEN |
 |
RESISTANCE 1 |
1,320.00 |
2.09% |
1.99% |
|
RESISTANCE 2 |
1,315.75 |
1.76% |
1.65% |
|
CLOSE JAN 27 |
1,293.00 |
|
|
|
OPEN JAN 29 |
1,295.00 |
0.15% |
|
 |
SUPPORT 1 |
1,289.00 |
-0.31% |
-0.48% |
|
SUPPORT 2 |
1,283.50 |
-0.73% |
-0.92% |
|
|
|
|
|
|
|
|
|
| |
|
|
|
|
|
| |
|
|
|
|
|
|
IMPORTANT NOTE: In an effort to comply with all applicable rules, regulations and disclosures please be so kind and read the "General Disclosure" below: |
| |
|
|
|
|
| GENERAL DISCLOSURE - TRADINGVESTING.COM |
- The material contained on our Website and Economic Calendar must be used at your own risk. Material is believed to be reliable, but we do not guarantee its accuracy or validity, nor is Tradingvesting.com responsible for any errors or omissions which may occur. The analysis and/or recommendations made by Tradingvesting.com do not provide, imply, or otherwise constitute a guarantee of performance. All contents and recommendations are based on data and sources believed to be reliable, but accuracy and completeness cannot be guaranteed. It should not be assumed that future results will be profitable or will equal past performance, real, indicated or implied.Tradingvesting.com website and material contained therein is not a solicitation to participate in the Futures/Stocks/Options Market. This Economic Calendar does not include Earning Releases, Announced Stock Splits, Upcoming Initial Public Offerings with Underwritings or Rating Changes. Tradingvesting.com has attempted to verify the information contained in this calendar. However, any aspect of such info may change without notice. Unless indicated otherwise: economic data is from the U.S and intraday data is at least 20 minutes delayed; all prices are in the local currency; Time is U.S. Eastern Time. Furthermore, there is a very high degree of risk involved in trading.Tradingvesting.com assumes no responsibilities for your trading and investment results, please red our Risk Disclosure.
- Tradingvesting.com does not provide investment advice, and does not represent that any of the information or related analysis is accurate or complete at any time. All information on this website are for educational purposes only and are not intended to provide financial advice. Any statements about profits or income, expressed or implied, do not represent a guarantee. Your actual trading may result in losses as no trading system is guaranteed. You accept full responsibilities for your actions, trades, profit or loss, and agree to hold Tradingvesting.com and any authorized distributors of this information harmless in any and all ways. We respect your right to privacy, please click here to view our privacy policy.
- U.S. Government Required Disclaimer - Commodity Futures Trading Commission.
Futures and options trading has large potential rewards, but also large potential risk. You must be aware of the risks and be willing to accept them in order to invest in the futures and options markets. Don't trade with money you can't afford to lose. This website is neither a solicitation nor an offer to Buy/Sell futures or options. No representation is being made that any account will or is likely to achieve profits or losses similar to those discussed on this website. The past performance of any trading system or methodology is not necessarily indicative of future results.
- CFTC rule 4.41:Hypothetical or simulated performance results have certain limitations. Unlike an actual performance record, simulated results do not represent actual trading. Also, since the trades have not been executed, the results may have under-or-over compensated for the impact, if any, of certain market factors, such as lack of liquidity. Simulated trading programs in general are also subject to the fact that they are designed with the benefit of hindsight. No representation is being made that any account will or is likely to achieve profit or losses similar to those shown.
- Risk Warning: Trading foreign exchange on margin carries a high level of risk, and may not be suitable for all investors. The high degree of leverage can work against you as well as for you. Before deciding to invest in foreign exchange you should carefully consider your investment objectives, level of experience, and risk appetite. The possibility exists that you could sustain a loss of some or all of your initial investment and therefore you should not invest money that you cannot afford to lose. You should be aware of all the risks associated with foreign exchange trading, and seek advice from an independent financial advisor if you have any doubts. Our linking to these sites does not constitute an endorsement of any products, services or the information found on them. Once you link to another site you are subject to the policies of the new site. By using this site, you agree to the Terms of Service, Privacy Policy and Risk Disclosure. Copyright � 2012 Tradingvesting, LLC. All rights reserved. If you have any questions regarding the Online Economic Calendar application, please contact us: click here.
THIS BRIEF STATEMENT CANNOT, OF COURSE, DISCLOSE ALL THE RISKS AND OTHER ASPECTS OF THE COMMODITY MARKETS AND EQUITY MARKETS. PLEASE READ MORE AT: TERMS OF SERVICE.
|
|
|
| |
|
|
|
|
|
| |
|
|
|
|
|