|
 |
|
|
|
Week 35 -2012 | From Aug 27 to Aug 31, 2012 |
|
 |
|
|
|
|
|
|
| |
|
|
|
|
|
|
|
|
|
|
| |
Economic Data for Week 35-2012 | Global View | Week Rating
| DATE |
DAY |
REPORT/CATEGORY |
HIGHLIGHTS ON WEEK 35-2012 |
LAST |
|
Mon |
Non Reports for Our Global Vision |
There will be no Economic Reports released on Monday. |
N/A |
|
|
No Reports |
|
|
|
Tue |
ICSC Goldman Sachs Index |
The ICSC Retail Chain Store Sales Index edged up 0.5% in the week ended Saturday from the week before on a seasonally adjusted, comparable-store basis, as back-to-school shopping helped to reverse recent declines. |
0.5%
W/W
|
|
 |
Sales and Inventories |
This week the ICSC-Goldman increased year over year by 3.4%, which is moderate. ICSC expects August industry sales will increase 3.5% to 4.5%, excluding drug stores sales. |
|
|
Tue |
Johnson Redbook |
The Redbook index increased only 1.5% year over year though, the second lowest reading from the index since January of 2010. The lowest since January of 2010 was this July. |
1.5%
Y/Y |
|
|
Sales and Inventories |
The Redbook has performed�significantly�worse than the ICSC-Goldman however. On a year-on-year basis, the reading rose 1.5%. |
|
|
Tue |
S&P Case-Shiller Index |
The S&P/Case-Shiller 20-city composite registered a 2.3% advance in June, matching upwardly revised gains in May and taking the year-on-year move to positive territory for the first time in close to two years with a gain of 0.5%.� |
0.9%
M/M
|
|
|
Real Estate |
U.S. home prices up 2.3% in June: Case-Shiller. For the month of June, the S&P Case-Shiller House Price Index improved a little. This index has been in a nosedive and then flat-line since 2007. |
|
|
Tue |
Consumer Confidence |
U.S. consumer confidence unexpectedly weakened in August to its lowest in nine months as Americans turned more pessimistic about the short-term outlook. |
60.6
Level
|
|
|
Consumer |
The Conference Board said its index of consumer attitudes fell to 60.6 from a downwardly revised 65.4 the month before. Economists had expected an increase to 66. |
|
|
Wed |
MBA purchase Applications |
Applications for home mortgages fell last week as demand for refinancing dropped for the fourth week in a row, though interest in purchases rose. |
-4.3% |
|
|
Real Estate |
The MBA said its seasonally adjusted index of mortgage application activity, which includes both refinancing and home purchase demand, fell 4.3% in the week ended Aug 24. |
|
|
Wed |
Gross Domestic Product (GDP) |
The economy grew at a 1.7% annual rate in Q2-2112, supported by exports and investment in the construction of nonresidential structures. The pace was a slowdown from the 2.0% rate set in Q1-2012. |
1.7%
GDP
|
|
|
Growth |
The U.S. economy grew at a 2.0% pace in the January-March period, fared slightly better than initially thought in Q2-2012, but the pace of growth remained too slow to shut the door on further monetary easing from the Federal Reserve. That was up from last month's 1.5% estimate and in line with economists' expectations. |
|
|
Wed |
Corporate Profits |
after-tax corporate profits unexpectedly rose at 1.1% rate after sinking 8.6% in the first quarter. |
13.3% |
|
|
Growth |
Corporate profits on a year-on-year basis rose 13.3%, compared to up 19.1% in the first quarter. |
|
|
Wed |
Pending Home Sales Index |
The NAR's Pending Home Sales Index rose 2.4% in July from June and is now 12.4% higher than it was a year ago. This index is now at its highest level since April of 2010, just before the end of the home buyer tax credit. |
2.4% |
|
|
Real Estate |
Pending Home Sales Beat Expectations in July; U.S. stocks were near unchanged after a trade group reported pending home sales rose 2.4% in July. |
|
|
Wed |
EIA Crude Oil Report |
A big jump in imports during the August 24 week fed a 3.8 million barrel build in oil inventories to 364.5 million barrels. Oil inventories remain very heavy and, for the 12th week in a row, remain above the upper limit of their historical range. |
3.8M |
|
|
Commodity |
The price of oil is little changed following today's data. Next week this report will show the initial effects of Hurricane Isaac and the shutting in of Gulf production. |
|
|
Wed |
Beige Book 6 |
The Beige Book prepared for the September 12-13 FOMC meeting suggests economic activity continued to expand gradually in July and early August across most regions and sectors. Thefore, the Beige Book appears to be modestly more positive. |
N/A |
|
|
Interest Rates |
The latest Beige Book report provided additional evidence that economic growth remains weak. Fed Beige Book shows gradual economic growth. |
|
|
Thu |
Jobless/Initial Claims |
The number of Americans filing new claims for jobless benefits held steady last week. The Labor Department said first-time applications for state unemployment benefits were unchanged last week at 374,000. |
374K |
|
|
Employment |
The four-week moving average for new claims, a better measure of labor market trends, rose 1,500 to 370,250 - a level economists views as consistent with only sluggish hiring. |
|
|
Thu |
Personal Income |
Personal income rose 0.3% for the third straight month. The increases matched the forecasts of economists surveyed |
0.3% |
|
|
Consumer |
Consumer spending rises 0.4% in July, outpacing 0.3% growth in personal incomes. In short, income and spending were up and inflation was flat. |
|
|
Thu |
Real PCE/ Consumer Spending |
Consumer spending posts biggest rise in five months. Consumer spending or Real PCE increased 0.4% in July after a flat reading in June. The rise was in line with economists' expectations. |
0.4% |
|
|
Consumer |
Since spending rose faster than income, the personal savings rate fell to 4.2% from a revised 4.3% in June. |
|
|
Thu |
Core PCE |
A core measure that strips out food and energy costs also held steady last for the first time since September. Over the past 12 month, it has risen 1.6%, the least since October. |
0.0% |
|
|
Inflation |
Inflation as gauged by the core PCE price index rose less than 0.1% in July. The core PCE also rose less than 0.1%, indicating little inflationary threat in the U.S. economy. |
|
|
Thu |
EIA Natural Gas Report |
Natural Gas To Fall Toward $2.20 After Prices Fail To Hold Support. The natural gas inventory surplus rose last week for the first time since April. |
66 bcf |
|
|
Commodity |
Natural gas rallied after the EIA reported that operators injected 66 billion cubic feet into storage last week, slightly above expectations that were calling for a build between 60 and 64 bcf. |
|
|
Thu |
Fed Balance Sheet |
The U.S. Federal Reserve's balance sheet shrank over the past week as the central bank continued its program to extend the maturity of its debt holdings. |
$-12.9B |
|
|
Government |
The Fed is contemplating another round of stimulus. Fed Chairman Ben Bernanke may offer new insight when he speaks Friday at the Kansas City Fed's annual Jackson Hole, Wyo. symposium. Fed Balance Sheet Shrank Last Week to $2.815 Trillion |
|
|
Thu |
M2 Money Supply |
|
$3.4B |
|
|
Money Supply |
|
|
|
Fri |
Fixed Mortgage Rates |
The 30-year fixed-rate mortgage (FRM) averaged 3.59% with an average 0.6 point for the week ending August 30, 2012, down from last week when it averaged 3.66%. |
3.59%
APR
|
|
|
Interest Rates |
The 15-year FRM this week averaged 2.86% with an average 0.6 point, down from last week when it averaged 2.89%. A year ago at this time, the 15-year FRM averaged 3.39%. |
|
|
Fri |
Chicago PMI |
The Institute for Supply Management reports that the business barometer in the Chicago PMI in August reads 53.0, down from 53.7 in July and expectations of 53.2. |
53.0 |
|
|
Manufacturing |
This is one of the lowest readings of the last couple years and is not good news. Prior to May, the last time the business barometer was below 53.0 was in July of 2009. |
|
|
Fri |
Consumer Sentiment |
Consumer sentiment climbed to a three-month high in August, while a separate government reading released Friday showed U.S. factory orders in July posted biggest rise in one year. |
74.3 |
|
|
Consumer |
The Thomson Reuters/University of Michigan's final reading on overall consumer sentiment this month rose to 74.3, its highest since May and above economists' expectations of 73.6. In July, the number stood at 72.3. |
|
| |
|
ben bernake speakes |
Federal Reserve Chairman Ben Bernanke delivered a mostly somber message on growth Friday, but offered no further central bank action to stimulate the moribund economy. |
N/A |
| |
|
|
He said: "The hurdle for using nontraditional policies should be higher than for traditional policies. At the same time, the costs of nontraditional policies, when considered carefully, appear manageable, implying that we should not rule out the further use of such policies if economic conditions warrant." |
|
|
Fri |
Factory Orders |
The Commerce Department said on Friday new orders for manufactured goods rose 2.8% during July Factory Orders Up More Than Expected. |
2.8% |
|
|
Manufacturing |
New orders for U.S. factory goods rose more than expected in July, posting the biggest increase since July 2011 and rising for the second time in three months. |
|
|
|
|
|
|
|
|
| |
|
|
|
|
|
|
|
|
|
|
|
|
| |
|
|
|
|
| |
|
|
|
|
|
| |
|
|
|
|
|
| |
|
|
|
|
| |
|
| WEEK 35-2012 ENDING AUG. 31 |
Reports Commentary
Consumers were more apprehensive about business and employment prospects, but more optimistic about their financial prospects despite rising inflation expectations during Week 35, 2012.
A bout of cooler weather nationally and more school systems beginning their new school year gave consumers the motivation they needed to spend, helping to lift overall back-to-school shopping and weekly sales this past week.
The Redbook and ICSC-Goldman store sales indexes were updated this week, and growth remains weak.
The housing market has taken a "fairly significant turn" thanks to the first year-over-year gains in home prices since 2006 . The trend is "clearly going upward,"
Gross domestic product expanded at a 1.7% annual rate, the Commerce Department said in its second estimate on Wednesday as stronger export growth offset a pull-back in restocking by businesses wary of sluggish domestic demand.
The Beige Book captured the beginning of the third quarter and suggested the speed of the recovery was falling short of what was needed to spur faster hiring. It also reported that activity expanded gradually in July and early August across most regions and sectors, compared to the previous assessment of “modest to moderate.”
The Beige Book’s relative pessimism came as “many” of the 12 Fed districts reported some softening in manufacturing, either a slowdown in the rate of growth or a decline in the level of sales, output or orders.
What we are going to need to see is consumer confidence holding its own and moderate job growth for that to continue through the third quarter. Those two key issues are still in doubt.
Despite our constructive view of natural gas fundamentals heading into winter, we would be wary of initiating long positions until prices show sign of recovery.
Consumer spending rises 0.4% in July, outpacing 0.3% growth in personal incomes. U.S. consumer spending got off to a fairly firm start in the third quarter, rising by the most in five months and offering hope economic growth would pick up this quarter.
The Fed aims for inflation of 2%. Both the overall and core indexes have been below that target since March, a factor some analysts said could tip the balance toward more easing in the debate at the central bank
In his much anticipated speech from the central bank summit in Jackson Hole, Wyo., Bernanke reiterated his position that the Fed's Open Markets Committee stands at the ready to provide help but is not yet unleashing additional stimulus Ben Bernanke SpeaksBernanke at Jackson Hole: No More Easing, For Now
Consumer sentiment rose as Americans made progress paying down debt, but future expectations remained grim, a survey showed.
A survey of consumers about their view of the U.S. economy improved in August, according to a report issued Friday. The University of Michigan-Thomson Reuters' consumer-sentiment gauge rose to 74.3 in August, compared with initial reading of 73.6. Economists surveyed by MarketWatch had expected the index to edge up to 73.8 from 72.3 in July. The sentiment gauge asks consumers about their own financial situation as well as consumer and business conditions. The index averaged about 87 in the year before the 2007-2009 recession
In an attempt to reduce the government's role in housing finance, the nation's regulator for Fannie Mae and Freddie Mac announced Friday that it is raising the fees that the two government-seized housing giants charge for guaranteeing credit risk to raise the guarantee fees it charges on single-family mortgages by an average of 10 basis points.
The changes to the guarantee fee pricing "represent a step toward encouraging greater participation in the mortgage market by private firms. |
|
| |
|
|
|
|
|
|
|
|
|
|
|
|
|
|
|
|
|
|
|
|
|
|
|
|
|
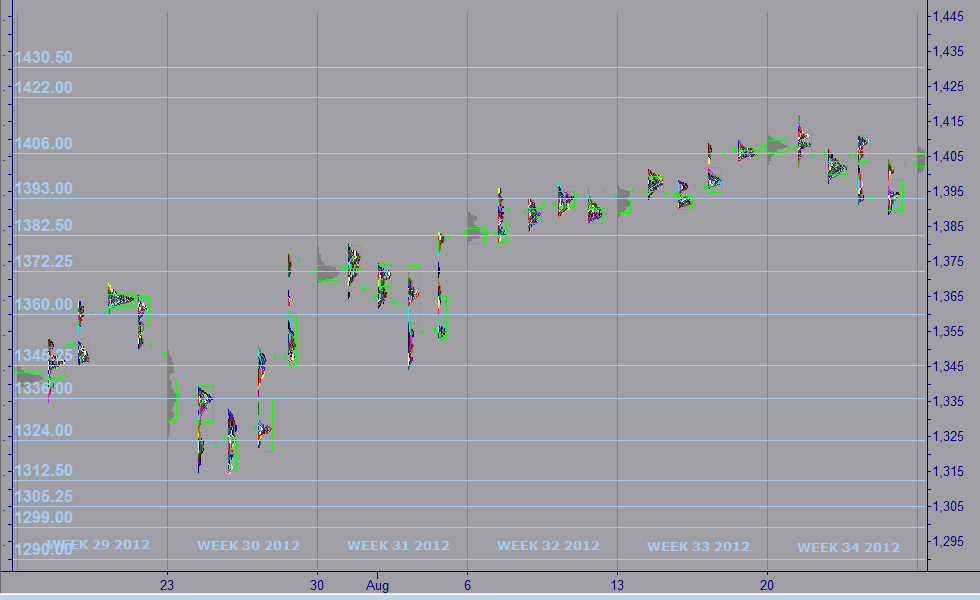
| MARKET PROFILE |
 |
WEEKS 2012 |
WEEK 35 |
% FROM CLOSE |
% FROM OPEN |
 |
RESISTANCE 1 |
1,330.25 |
1.39% |
1.35% |
|
RESISTANCE 2 |
1,326.25 |
1.08% |
1.04% |
 |
CLOSE MAR 02 |
1,350.00 |
|
|
|
OPEN MAR 04 |
1,255.00 |
0.04% |
|
 |
SUPPORT 1 |
1,289.00 |
0.66% |
0.62% |
|
SUPPORT 2 |
1,283.50 |
0.08% |
0.04% |
|
|
|
|
|
|
|
|
|
| |
|
|
|
|
|
| |
|
|
|
|
|
|
IMPORTANT NOTE: In an effort to comply with all applicable rules, regulations and disclosures please be so kind and read the "General Disclosure" below: |
| |
|
|
|
|
| GENERAL DISCLOSURE - TRADINGVESTING.COM |
- The material contained on our Website and Economic Calendar must be used at your own risk. Material is believed to be reliable, but we do not guarantee its accuracy or validity, nor is Tradingvesting.com responsible for any errors or omissions which may occur. The analysis and/or recommendations made by Tradingvesting.com do not provide, imply, or otherwise constitute a guarantee of performance. All contents and recommendations are based on data and sources believed to be reliable, but accuracy and completeness cannot be guaranteed. It should not be assumed that future results will be profitable or will equal past performance, real, indicated or implied.Tradingvesting.com website and material contained therein is not a solicitation to participate in the Futures/Stocks/Options Market. This Economic Calendar does not include Earning Releases, Announced Stock Splits, Upcoming Initial Public Offerings with Underwritings or Rating Changes. Tradingvesting.com has attempted to verify the information contained in this calendar. However, any aspect of such info may change without notice. Unless indicated otherwise: economic data is from the U.S and intraday data is at least 20 minutes delayed; all prices are in the local currency; Time is U.S. Eastern Time. Furthermore, there is a very high degree of risk involved in trading.Tradingvesting.com assumes no responsibilities for your trading and investment results, please red our Risk Disclosure.
- Tradingvesting.com does not provide investment advice, and does not represent that any of the information or related analysis is accurate or complete at any time. All information on this website are for educational purposes only and are not intended to provide financial advice. Any statements about profits or income, expressed or implied, do not represent a guarantee. Your actual trading may result in losses as no trading system is guaranteed. You accept full responsibilities for your actions, trades, profit or loss, and agree to hold Tradingvesting.com and any authorized distributors of this information harmless in any and all ways. We respect your right to privacy, please click here to view our privacy policy.
- U.S. Government Required Disclaimer - Commodity Futures Trading Commission.
Futures and options trading has large potential rewards, but also large potential risk. You must be aware of the risks and be willing to accept them in order to invest in the futures and options markets. Don't trade with money you can't afford to lose. This website is neither a solicitation nor an offer to Buy/Sell futures or options. No representation is being made that any account will or is likely to achieve profits or losses similar to those discussed on this website. The past performance of any trading system or methodology is not necessarily indicative of future results.
- CFTC rule 4.41:Hypothetical or simulated performance results have certain limitations. Unlike an actual performance record, simulated results do not represent actual trading. Also, since the trades have not been executed, the results may have under-or-over compensated for the impact, if any, of certain market factors, such as lack of liquidity. Simulated trading programs in general are also subject to the fact that they are designed with the benefit of hindsight. No representation is being made that any account will or is likely to achieve profit or losses similar to those shown.
- Risk Warning: Trading foreign exchange on margin carries a high level of risk, and may not be suitable for all investors. The high degree of leverage can work against you as well as for you. Before deciding to invest in foreign exchange you should carefully consider your investment objectives, level of experience, and risk appetite. The possibility exists that you could sustain a loss of some or all of your initial investment and therefore you should not invest money that you cannot afford to lose. You should be aware of all the risks associated with foreign exchange trading, and seek advice from an independent financial advisor if you have any doubts. Our linking to these sites does not constitute an endorsement of any products, services or the information found on them. Once you link to another site you are subject to the policies of the new site. By using this site, you agree to the Terms of Service, Privacy Policy and Risk Disclosure. Copyright � 2012 Tradingvesting, LLC. All rights reserved. If you have any questions regarding the Online Economic Calendar application, please contact us: click here.
THIS BRIEF STATEMENT CANNOT, OF COURSE, DISCLOSE ALL THE RISKS AND OTHER ASPECTS OF THE COMMODITY MARKETS AND EQUITY MARKETS. PLEASE READ MORE AT: TERMS OF SERVICE.
|
|
|
| |
|
|
|
|
|
| |
|
|
|
|
|