 |
 |
|
 |
ISM Services Index | Business Activity |
|
 |
|
The ISM non-manufacturing report comprises largely, but not exclusively, the service sector activities that make up the lion's share of total U.S. economic output. Index readings over 50 indicate growth. Read more...
|
|
|
|
|
|
|
| |
|
| |
 1. ISM Services Index ( 1 of 4 ) 1. ISM Services Index ( 1 of 4 )
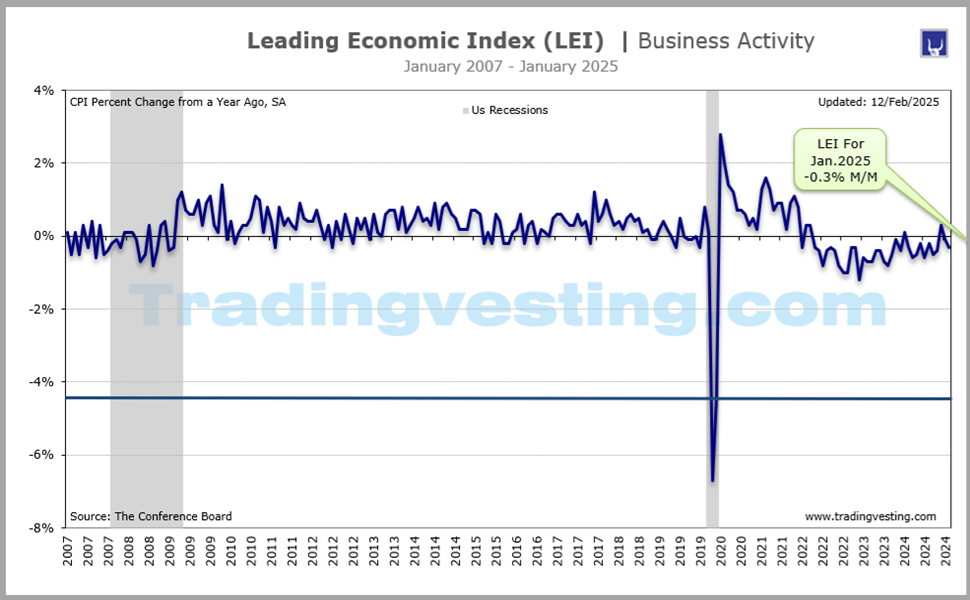
 2. Leading Indicators ( 2 of 4 ) 2. Leading Indicators ( 2 of 4 )
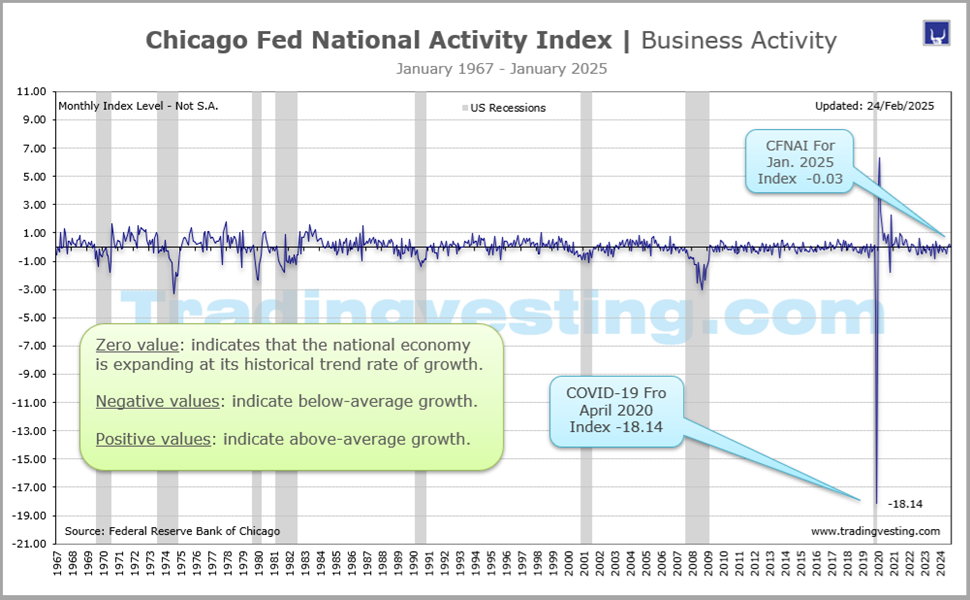
 3. Chicago Fed National Activity Index (3 of 4) 3. Chicago Fed National Activity Index (3 of 4)
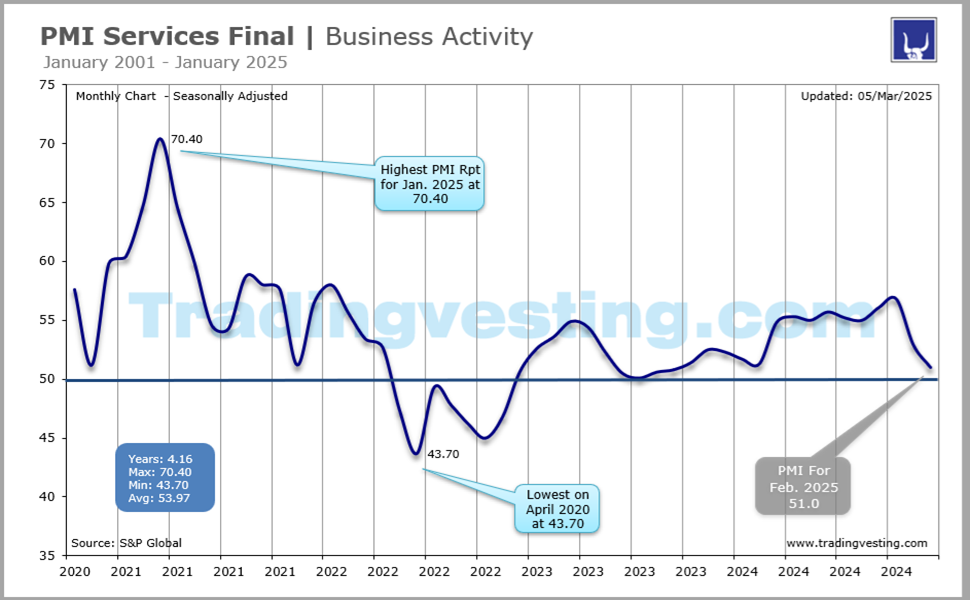
 4. PMI Services Final (4 of 4) 4. PMI Services Final (4 of 4)
|
 |
|
|
|
|
| |
|
→ Big Chart |
|
→ Release |
|
| |
|
|
|
|
|
|
|
|
|
|
|
|
|
|
|
|
|
|
|
 |
|
Big Chart | Large Data |
 |
|
ISM Services Index | Business Activity |
|
Today's Week |
 |
|
|
|
|
|
|
|
|
|
|
|
|
|
| |
|
|
|
|
|
|
|
|
|
|
|
|
|
|
|
|
|
|
|
|
|
Slides | Five 5 |
|
|
ISM Services Index | Business Activity |
|
Today's Week |
|
|
|
|
|
|
|
|
|
|
|
|
|
|
| |
|
|
|
|
|
|
|
|
|
|
|
|
|
|
|
|
|
|
|
|
|
Release Schedule | 2026 |
|
|
ISM Services Index | Business Activity |
|
Today's Week |
|
|
|
|
|
|
|
|
|
|
|
|
|
ISM Services Index
(At 10:00 a.m ET)
| SCHEDULE 2026 |
No 1 |
No 2 |
No 3 |
No 4 |
No 5 |
No 6 |
No 7 |
No 8 |
No 9 |
No 10 |
No 11 |
No 12 |
| Release | Week |
|
|
|
|
|
|
|
|
|
|
|
|
| Release | Date |
|
|
|
|
|
|
|
|
|
|
|
|
| Release | Day |
|
|
|
|
|
|
|
|
|
|
|
|
 |
|
|
|
|
|
|
|
|
|
|
|
|
| Prior |
52.6 |
54.4 |
53.8 |
56.1 |
54.0 |
53.6 |
... |
... |
... |
... |
... |
... |
| Prior Revised |
... |
53.8 |
... |
... |
... |
... |
... |
... |
... |
... |
... |
... |
| CONSENSUS |
52.2 |
53.8 |
53.6 |
54.7 |
53.9 |
53.7 |
... |
... |
... |
... |
... |
... |
| Consensus Low |
51.0 |
53.0 |
52.0 |
53.0 |
53.2 |
53.0 |
... |
... |
... |
... |
... |
... |
| Consensus High |
52.8 |
57.0 |
54.2 |
55.5 |
55.0 |
54.5 |
... |
... |
... |
... |
... |
... |
| ISM SERVICES |
54.4 |
53.8 |
56.1 |
54.0 |
53.6 |
54.5 |
... |
... |
... |
... |
... |
... |
| Rating |
|
|
|
|
|
|
|
|
|
|
|
|
| Month For |
Dec-25 |
Jan-25 |
Feb-26 |
Mar-26 |
Apr-26 |
May-26 |
Jun-26 |
Jul-26 |
Aug-26 |
Sep-26 |
Oct-26 |
Nov-26 |
|
|
|
|
|
|
|
|
|
|
|
|
|
|
|
| |
|
| |
|
|
|
|
|
|
|
|
|
|
|
Release Schedule | 2025 |
|
|
ISM Services Index | Business Activity |
|
Today's Week |
|
|
|
|
|
|
|
|
|
|
|
|
|
ISM Services Index
(At 10:00 a.m ET)
| SCHEDULE 2025 |
No 1 |
No 2 |
No 3 |
No 4 |
No 5 |
No 6 |
No 7 |
No 8 |
No 9 |
No 10 |
No 11 |
No 12 |
| Release | Week |
|
|
|
|
|
|
|
|
|
|
|
|
| Release | Date |
|
|
|
|
|
|
|
|
|
|
|
|
| Release | Day |
|
|
|
|
|
|
|
|
|
|
|
|
|
|
|
|
|
|
|
|
|
|
|
|
|
| Prior |
52.1 |
54.1 |
52.8 |
53.5 |
50.8 |
51.6 |
49.9 |
50.8 |
50.1 |
52.0 |
50.0 |
52.4 |
| Prior Revised |
... |
54.0 |
... |
... |
... |
... |
... |
... |
... |
... |
... |
... |
| CONSENSUS |
53.2 |
54.0 |
52.7 |
53.0 |
50.2 |
52.0 |
50.5 |
51.5 |
50.5 |
51.6 |
51.0 |
52.1 |
| Consensus Low |
52.0 |
52.5 |
51.3 |
51.0 |
49.5 |
50.8 |
49.7 |
51.0 |
49.8 |
50.2 |
50.0 |
51.8 |
| Consensus High |
55.0 |
55.1 |
53.3 |
53.8 |
50.6 |
52.5 |
52.0 |
52.2 |
51.0 |
52.5 |
52.0 |
53.2 |
| ISM SERVICES |
54.1 |
52.8 |
53.5 |
50.8 |
51.6 |
49.9 |
50.8 |
50.1 |
52.0 |
50.0 |
52.4 |
52.6 |
| Rating |
|
|
|
|
|
|
|
|
|
|
|
|
| Month For |
Dec-24 |
Jan-25 |
Feb-25 |
Mar-25 |
Apr-25 |
May-25 |
Jun-25 |
Jul-25 |
Aug-25 |
Sep-25 |
Oct-25 |
Nov-25 |
|
|
| |
|
| |
|
|
|
|
|
|
|
|
|
|
|
Release Schedule | 2024 |
|
|
ISM Services Index | Business Activity |
|
Today's Week |
|
|
|
|
|
|
|
|
|
|
|
|
|
ISM Services Index
(At 10:00)
| SCHEDULE 2024 |
No 1 |
No 2 |
No 3 |
No 4 |
No 5 |
No 6 |
No 7 |
No 8 |
No 9 |
No 10 |
No 11 |
No 12 |
| Release | Week |
|
|
|
|
|
|
|
|
|
|
|
|
| Release | Date |
|
|
|
|
|
|
|
|
|
|
|
|
| Release | Day |
|
|
|
|
|
|
|
|
|
|
|
|
|
|
|
|
|
|
|
|
|
|
|
|
|
| Prior |
52.7 |
50.6 |
53.4 |
52.6 |
51.4 |
49.4 |
52.3 |
48.8 |
51.4 |
51.5 |
54.9 |
56.0 |
| Prior Revised |
... |
50.5 |
... |
... |
... |
... |
... |
... |
... |
... |
... |
... |
| CONSENSUS |
52.7 |
52.1 |
53.0 |
52.7 |
52.0 |
50.7 |
53.0 |
51.0 |
51.1 |
51.5 |
53.5 |
55.5 |
| Consensus Low |
52.0 |
51.5 |
51.0 |
51.5 |
50.5 |
49.1 |
52.0 |
49.0 |
50.5 |
51.0 |
53.0 |
54.0 |
| Consensus High |
53.3 |
53.0 |
54.3 |
53.3 |
52.5 |
52.3 |
55.5 |
53.0 |
52.5 |
52.0 |
55.8 |
57.5 |
| ISM SRVCS M/M |
50.6 |
53.4 |
52.6 |
51.4 |
49.4 |
52.3 |
48.8 |
51.4 |
51.5 |
54.9 |
56.0 |
52.1 |
| Rating |
|
|
|
|
|
|
|
|
|
|
|
|
| Month For |
Dec-23 |
Jan-24 |
Feb-24 |
Mar-24 |
Apr-24 |
May-24 |
Jun-24 |
Jul-24 |
Aug-24 |
Sep-24 |
Oct-24 |
Nov-24 |
|
|
|
|
|
|
|
|
|
|
|
|
|
|
|
| |
|
| |
|
|
|
|
|
|
|
|
|
|
|
Release Schedule | 2023 |
|
|
ISM Services Index | Business Activity |
|
Today's Week |
|
|
|
|
|
|
|
|
|
|
|
|
|
ISM Services Index
(At 10:00)
| SCHEDULE 2023 |
No 1 |
No 2 |
No 3 |
No 4 |
No 5 |
No 6 |
No 7 |
No 8 |
No 9 |
No 10 |
No 11 |
No 12 |
| Release | Week |
|
|
|
|
|
|
|
|
|
|
|
|
| Release | Date |
|
|
|
|
|
|
|
|
|
|
|
|
| Release | Day |
|
|
|
|
|
|
|
|
|
|
|
|
|
|
|
|
|
|
|
|
|
|
|
|
|
| Prior |
69.1 |
49.6 |
55.2 |
55.1 |
51.2 |
51.9 |
50.3 |
53.9 |
52.7 |
54.5 |
53.6 |
51.8 |
| Prior Revised |
... |
... |
... |
... |
... |
... |
... |
... |
... |
... |
... |
... |
| CONSENSUS |
55.0 |
50.4 |
54.5 |
54.4 |
51.7 |
52.0 |
50.8 |
53.0 |
52.4 |
53.5 |
53.0 |
52.4 |
| Consensus Low |
53.8 |
49.0 |
53.0 |
50.0 |
50.0 |
50.5 |
48.5 |
52.0 |
51.0 |
52.0 |
50.5 |
51.5 |
| Consensus High |
59.0 |
51.0 |
55.5 |
55.5 |
52.5 |
53.7 |
52.0 |
54.7 |
53.9 |
54.3 |
53.7 |
53.0 |
| ISM SRVCS M/M |
49.6 |
55.2 |
55.1 |
51.2 |
51.9 |
50.3 |
53.9 |
52.7 |
54.5 |
53.6 |
51.8 |
52.7 |
| Rating |
|
|
|
|
|
|
|
|
|
|
|
|
| Month For |
Dec-22 |
Jan-23 |
Feb-23 |
Mar-23 |
Apr-23 |
May-23 |
Jun-23 |
Jul-23 |
Aug-23 |
Sep-23 |
Oct-23 |
Nov-23 |
|
|
|
|
|
|
|
|
|
|
|
|
|
|
|
| |
|
| |
|
|
|
|
|
|
|
|
|
|
|
Release Schedule | 2022 |
|
|
ISM Services Index | Business Activity |
|
Today's Week |
|
|
|
|
|
|
|
|
|
|
|
|
|
ISM Services Index
(At 10:00)
| SCHEDULE 2022 |
No 1 |
No 2 |
No 3 |
No 4 |
No 5 |
No 6 |
No 7 |
No 8 |
No 9 |
No 10 |
No 11 |
No 12 |
| Release | Week |
|
|
|
|
|
|
|
|
|
|
|
|
| Release | Date |
|
|
|
|
|
|
|
|
|
|
|
|
| Release | Day |
|
|
|
|
|
|
|
|
|
|
|
|
|
|
|
|
|
|
|
|
|
|
|
|
|
| Prior |
69.1 |
62.0 |
59.9 |
56.5 |
58.3 |
57.1 |
55.9 |
55.3 |
55.7 |
56.9 |
56.7 |
54.4 |
| Prior Revised |
... |
... |
... |
... |
... |
... |
... |
... |
... |
... |
... |
... |
| CONSENSUS |
67.0 |
60.0 |
60.9 |
58.5 |
58.9 |
56.3 |
54.8 |
53.0 |
55.4 |
56.0 |
55.4 |
55.5 |
| Consensus Low |
65.8 |
54.0 |
59.7 |
56.4 |
56.5 |
55.0 |
53.9 |
51.5 |
53.5 |
54.8 |
54.0 |
51.5 |
| Consensus High |
69.0 |
62.3 |
64.0 |
60.0 |
59.0 |
60.0 |
56.4 |
54.9 |
57.0 |
57.5 |
56.5 |
56.0 |
| ISM SRVCS M/M |
62.0 |
59.9 |
56.5 |
58.3 |
57.1 |
55.9 |
55.3 |
56.7 |
56.9 |
56.7 |
54.4 |
56.5 |
| Rating |
|
|
|
|
|
|
|
|
|
|
|
|
| Month For |
Dec-21 |
Jan-22 |
Feb-22 |
Mar-22 |
Apr-22 |
May-22 |
Jun-22 |
Jul-22 |
Aug-22 |
Sep-22 |
Oct-22 |
Nov-22 |
|
|
|
|
|
|
|
|
|
|
|
|
|
|
|
| |
|
| |
|
|
|
|
|
|
|
|
|
|
|
Release Schedule | 2021 |
|
|
ISM Services Index | Business Activity |
|
Today's Week |
|
|
|
|
|
|
|
|
|
|
|
|
|
ISM Services Index
(At 10:00)
| SCHEDULE 2021 |
No 1 |
No 2 |
No 3 |
No 4 |
No 5 |
No 6 |
No 7 |
No 8 |
No 9 |
No 10 |
No 11 |
No 12 |
| Release | Week |
|
|
|
|
|
|
|
|
|
|
|
|
| Release | Date |
|
|
|
|
|
|
|
|
|
|
|
|
| Release | Day |
|
|
|
|
|
|
|
|
|
|
|
|
|
|
|
|
|
|
|
|
|
|
|
|
|
| Prior |
54.7 |
57.2 |
58.7 |
55.3 |
63.7 |
62.7 |
64.0 |
60.1 |
64.1 |
61.7 |
61.9 |
66.7 |
| Prior Revised |
... |
57.7 |
... |
... |
... |
... |
... |
... |
... |
... |
... |
... |
| CONSENSUS |
54.5 |
56.8 |
58.7 |
58.6 |
64.1 |
63.1 |
63.0 |
60.4 |
59.8 |
60.0 |
61.9 |
63.9 |
| Consensus Low |
53.0 |
55.5 |
57.5 |
55.9 |
63.0 |
61.5 |
62.0 |
58.0 |
57.0 |
57.0 |
60.1 |
62.1 |
| Consensus High |
56.0 |
58.0 |
60.0 |
60.5 |
65.4 |
65.0 |
64.3 |
64.4 |
63.4 |
61.5 |
63.0 |
68.1 |
| ISM SRVCS M/M |
57.2 |
58.7 |
55.3 |
63.7 |
62.7 |
64.0 |
60.1 |
64.1 |
61.7 |
61.9 |
66.7 |
69.1 |
| Rating |
|
|
|
|
|
|
|
|
|
|
|
|
| Month For |
Dec-20 |
Jan-21 |
Feb-21 |
Mar-21 |
Apr-21 |
May-21 |
Jun-21 |
Jul-21 |
Aug-21 |
Sep-21 |
Oct-21 |
Nov-21 |
|
|
|
|
|
|
|
|
|
|
|
|
|
|
|
| |
|
| |
|
Legends: |
 |
Delayed |
 |
Positive View |
 |
Negative View |
 |
Neutral View |
 |
Non Available |
|
|
|
|
|
|
|
|
|
|
|
|
|
|
|
|
|
|
|
|
| |
|
|
|
|
|
|
|
|
|
|
|
|
|
|
|
|
|
|
|
|
|
Brief News | 2026 |
|
|
ISM Services Index | Business Activity |
|
Today's Week |
|
|
|
|
|
|
|
|
|
|
|
|
|
ISM Services Index
(At 10:00 a.m ET)
| DATE/WEEK |
HIGHLIGHTS |
FOR |
ACTUAL |
|
ISM Services |
No 12 |
... |
|
Nov-2026 |
|
| |
|
|
|
ISM Services |
No 11 |
... |
|
Oct-2026 |
|
| |
|
|
|
ISM Services |
No 10 |
... |
|
Sep-2026 |
|
| |
|
|
|
ISM Services |
No 9 |
... |
|
Aug-2026 |
|
| |
|
|
|
ISM Services |
No 8 |
... |
|
Jul-2026 |
|
| |
|
|
|
ISM Services |
No 7 |
... |
|
Jun-2026 |
|
| |
|
|
|
ISM Services |
No 6 |
... |
|
May-2026 |
|
| |
|
|
|
ISM Services |
No 5 |
... |
|
Apr-2026 |
|
| |
|
|
|
ISM Services |
No 4 |
54.0 |
|
Mar-2026 |
|
| |
|
|
|
ISM Services |
No 3 |
56.1 |
|
Feb-2026 |
|
| |
|
|
|
ISM Services |
No 2 |
53.4 |
|
Jan-2026 |
|
| |
|
|
|
US private activity growth in December was revised down to its lowest rate in eight months, according to S&P Global, with both the manufacturing and services sectors slowing over the month. The final estimate of the S&P Global US composite purchasing managers' index came in at 52.7 last month, down from the initial reading of 53.0 and the 54.2 mark registered in November The U.S. ISM Services Index rose to 54.4 in December 2025 from 52.6 in November, compared with the 52.2 consensus, according to data released by the Institute for Supply Management on Wednesday.US ISM Services PMI improves to 54.4 in December |
No 1 |
54.4 |
|
Dec-2025 |
|
| |
|
|
|
|
|
|
|
|
| |
|
|
|
|
|
| |
|
|
|
|
|
|
|
|
|
|
|
|
|
|
|
Brief News | 2025 |
|
|
ISM Services Index | Business Activity |
|
Today's Week |
|
|
|
|
|
|
|
|
|
|
|
|
|
ISM Services Index
(At 10:00 a.m ET)
| DATE/WEEK |
HIGHLIGHTS |
FOR |
ACTUAL |
|
The ISM Services PMI for November 2025 was 52.6%, indicating continued expansion in the US services sector and a 0.2 percentage point increase from October, exceeding forecasts of 52.1%. The data reflects the strongest growth in nine months, driven by increased business activity, despite a slight decline in new orders. |
No 12 |
52.6 |
|
Nov-2025 |
|
| |
|
|
|
The ISM Services PMI® reached 52.4% in October 2025, marking an expansion and the highest reading since February. This 2.4 percentage point increase from September 2025 signaled stronger service sector growth, driven by rebounding business activity (54.3%) and new orders (56.2%), although employment continued to contract (48.2%). |
No 11 |
52.4 |
|
Oct-2025 |
|
| |
|
|
|
The latest ISM Services Index for September 2025 showed mixed results, with the overall Services PMI at 50% (indicating no expansion or contraction), while New Orders at 50.4% showed slight growth and the Employment Index contracted at 47.2%. This indicates mixed activity in the U.S. services sector, with new business picking up but job growth slowing. |
No 10 |
50.0 |
|
Sep-2025 |
|
| |
|
|
|
The U.S. ISM Services PMI climbed 1.9 pts to 52.0 in August. That was better than expected and marked the highest level since February, suggesting resilience in the still-expanding services sector despite some headwinds. The new orders gauge jumped nicely to the highest level since October 2024 on sturdy demand, while business activity continued to expand. Meanwhile, after faltering below the 50-mark in July, the imports index jumped to the highest level since the start of 2024. However, that's where the good news ends, with the rest of the details rather lacklustre. |
No 9 |
52.0 |
|
Aug-2025 |
|
| |
|
|
|
U.S. services sector activity unexpectedly flatlined in July with little change in orders and a further weakening in employment even as input costs climbed by the most in nearly three years, underscoring the ongoing drag of uncertainty over the Trump administration's tariff policy on businesses. The Institute for Supply Management (ISM) said on Tuesday its nonmanufacturing purchasing managers index (PMI) slipped to 50.1 last month from 50.8 in June. Economists polled by Reuters had forecast the services PMI would rise to 51.5. A PMI reading above 50 indicates growth in the services sector, which accounts for more than two-thirds of the economy. |
No 8 |
50.1 |
|
Jul-2025 |
|
| |
|
|
|
In June, the Services PMI® registered 50.8 percent, a 0.9-percentage point increase compared to the May reading of 49.9 percent. A reading above 50 percent indicates the services sector economy is generally expanding; below 50 percent indicates it is generally contracting. |
No 7 |
50.8 |
|
Jun-2025 |
|
| |
|
|
|
ISM Services PMI falls to 49.9 in May reads for ISM services and here they are 49.9 the headline was supposed to come in at 52 expansion territory. In May, the Services PMI® registered 49.9 percent, 1.7 percentage points lower than the April figure of 51.6 percent. The Business Activity Index was 'unchanged' in May, registering 50 percent, 3.7 percentage points lower than the 53.7 percent recorded in April. |
No 6 |
49.9 |
|
May-2025 |
|
| |
|
|
|
The Services PMI® registered 51.6 percent, indicating expansion for the 56th time in 59 months since recovery from the coronavirus pandemic-induced recession began in June 2020. The report was issued today by Steve Miller, CPSM, CSCP, Chair of the Institute for Supply Management® (ISM®) Services Business Survey Committee: "In April, the Services PMI® registered 51.6 percent, 0.8 percentage point higher than the March figure of 50.8 percent. |
No 5 |
51.6 |
|
Apr-2025 |
|
| |
|
|
|
In March 2025, the ISM Services PMI® registered 50.8 percent, a 2.7-percentage point decrease compared to February's reading of 53.5 percent, according to CNBC. This indicates that while the service sector economy is still generally expanding (above 50), it's doing so at a slower pace than the previous month. The 50.8 reading corresponds to a 0.7-percentage point increase in real GDP on an annualized basis, says IS. |
No 4 |
50.8 |
|
Mar-2025 |
|
| |
|
|
|
ISM In February 2025, the Institute for Supply Management (ISM) reported a Services PMI of 53.5. This indicates that the service sector in the US expanded for the eighth consecutive month. The figure of 53.5 represents the PMI, which is based on surveys of purchasing and supply managers in over 400 service-based companies. A reading above 50 signifies expansion, while a reading below 50 suggests contraction. The ISM Services PMI report also noted an acceleration in price growth during that period. |
No 3 |
53.5 |
|
Feb-2025 |
|
| |
|
|
|
ISM services index at 52.8 for January, lower than forecast. Service sector activity grew at a slower-than-expected pace in January, according to an Institute for Supply Management survey released Wednesday. The ISM services index posted a reading of 52.8%, down 1.2 percentage points from December and below the Dow Jones forecast for 54.3%. The survey gauges the percentage of businesses showing expansion. New orders dropped 3.1 points, business activity was off 3.5 points and prices fell 4 points, though the index was still a robust 60.4% and indicative of ongoing price pressures. Employment increased 1 point to 52.3%. |
No 2 |
52.8 |
|
Jan-2025 |
|
| |
|
|
|
ISM Servicesd In December 2024, the Services PMI® registered 54.1 percent, a 2-percentage point increase compared to the November reading of 52.1 percent. A reading above 50 percent indicates the services sector economy is generally expanding; below 50 percent indicates it is generally contracting.
|
No 1 |
54.1 |
|
Dec-2024 |
|
| |
|
|
|
|
|
|
|
|
| |
|
|
|
|
|
| |
|
|
|
|
|
|
|
|
|
|
|
|
|
|
|
Brief News | 2024 |
|
|
ISM Services Index | Business Activity |
|
Today's Week |
|
|
|
|
|
|
|
|
|
|
|
|
|
ISM Services Index
(At 10:00)
| DATE/WEEK |
HIGHLIGHTS |
FOR |
ACTUAL |
|
Economic activity in the services sector expanded for the fifth consecutive month in November, say the nation's purchasing and supply executives in the latest Services ISM® Report On Business®. The Services PMI® registered 52.1 percent, indicating expansion for the 51st time in 54 months since recovery from the coronavirus pandemic-induced recession began in June 2020. |
No 12 |
52.1 |
|
Nov-2024 |
|
| |
|
|
|
ISM Services Index Up for October 2024. Economic activity in the services sector, which includes construction, expanded for the fourth consecutive month in October 2024, according to the nation’s purchasing and supply executives in the latest Services ISM Report on Business. October's ISM PSI Services Index is up 4.5 percentage points from two months prior. August was 51.5%, September was 54.9% and October's was at 56.0 In October 2024, the Services PMI registered 56%, 1.1 percentage points higher than September’s figure of 54.9. |
No 11 |
56.0 |
|
Oct-2024 |
|
| |
|
|
|
ISM nonmanufacturing PMI rose to 54.9 in September 2024 from 51.5 in August 2024. New orders index surged to 59.4, highest since February 2023. Services employment index dropped to 48.1. U.S. services sector activity jumped to a 1-1/2-year high in September amid strong growth in new orders, more evidence that the economy remained on a solid footing in the third quarter. The Institute for Supply Management (ISM) said on Thursday that its nonmanufacturing purchasing managers (PMI) index accelerated to 54.9 last month, the highest level since February 2023, from 51.5 in August. A PMI reading above 50 indicates growth in the services sector, which accounts for more than two-thirds of the economy. The ISM views PMI readings above 49 over time as generally indicating an expansion of the overall economy. Economists polled by Reuters had forecast the services PMI rising to 51.7. |
No 10 |
54.9 |
|
Sep-2024 |
|
| |
|
|
|
US service sector steady in August; employment cooling. U.S. services sector activity was steady in August, but employment gains slowed, consistent with an easing labor market. The Institute for Supply Management (ISM) said on Thursday that its nonmanufacturing purchasing managers (PMI) index was little changed at 51.5 last month compared to 51.4 in July. A PMI reading above 50 indicates growth in the services sector, which accounts for more than two-thirds of the economy. The ISM views readings above 49 over time as generally indicating an expansion of the overall economy. |
No 9 |
51.5 |
|
Aug-2024 |
|
| |
|
|
|
US service sector rebounds in July; employment also recovers. U.S. services sector activity rebounded from a four-year low in July amid a bounce back in new orders and the first increase in employment in six months, which could help to quash fears of a recession that have been sparked by a surge in the unemployment rate last month and an ongoing stock market sell-off. The Institute for Supply Management (ISM) said on Monday that its nonmanufacturing purchasing managers (PMI) index increased to 51.4 last month from 48.8 in June, which was the lowest level since May 2020. A PMI reading above 50 indicates growth in the services sector, which accounts for more than two-thirds of the economy. The ISM views readings above 49 over time as generally indicating an expansion of the overall economy. |
No 8 |
51.4 |
|
Jul-2024 |
|
| |
|
|
|
US service sector sags in June as orders sink. A measure of U.S. services sector activity slumped to a four-year low in June amid a sharp drop in orders, potentially hinting at a loss of momentum in the economy at the end of the second quarter. The Institute for Supply Management said its nonmanufacturing purchasing managers (PMI) index dropped to 48.8 last month, the lowest level since May 2020, from 53.8 in May. It was the second time this year that the PMI had dropped below 50, which indicates contraction in the services sector. |
No 7 |
48.8 |
|
Jun-2024 |
|
| |
|
|
|
US services sector activity rebounds at 52.3 while private payrolls growth slows. The U.S. services sector snapped back into growth mode in May after a short-lived contraction in the prior month, with a measure of business activity improving by the most in three years, according to a survey published on Wednesday that may buttress the Federal Reserve's wariness of a shift to interest rate cuts. At the same time, a gauge of hiring among private employers showed firms last month added the fewest jobs since January and small businesses shed jobs for the first time in six months, fresh signs that a tight labor market is easing back into balance. |
No 6 |
52.3 |
|
May-2024 |
|
| |
|
|
|
US service sector contracts in April; price pressures reaccelerate. The U.S. services sector contracted in March, while a measure of prices paid by businesses for inputs jumped, a worrisome sign for the outlook on inflation. The Institute for Supply Management (ISM) said on Friday that its non-manufacturing PMI fell to 49.4 last month from 51.4 in March, the lowest reading since December 2022. |
No 5 |
49.4 |
|
Apr-2024 |
|
| |
|
|
|
US service sector expands moderately in March; price pressures easing. U.S. services industry growth slowed further in March, while a measure of prices paid by businesses for inputs dropped to a four-year low, which bodes well for the inflation outlook. The Institute for Supply Management (ISM) said on Wednesday that its non-manufacturing PMI fell to 51.4 last month from 52.6 in February. It was the second straight monthly decline in the index since rebounding in January. |
No 4 |
51.4 |
|
Mar-2024 |
|
| |
|
|
|
US services sector slows in February; inflation moderating. U.S. services industry growth slowed a bit in February amid a decline in employment, but a measure of new orders increased to a six-month high, pointing to underlying strength in the sector.The ISM said its non-manufacturing PMI slipped to 52.6 last month from 53.4 in January. A reading above 50 indicates growth in the services industry, which accounts for more than two-thirds of the economy. Economists polled by Reuters had forecast the index little changed at 53.0. |
No 3 |
52.6 |
|
Feb-2024 |
|
| |
|
|
|
US service sector growth picks up in January - ISM survey. The U.S. services sector growth picked up in January as new orders increased and employment rebounded, but suppliers appeared to fall behind, resulting in a measure of input prices rising to an 11-month high. The Institute for Supply Management (ISM) said on Monday that its non-manufacturing PMI increased to 53.4 last month from 50.5 in December. A reading above 50 indicates growth in the services industry, which accounts for more than two-thirds of the economy. Economists polled by Reuters had forecast the index rising to 52.0. |
No 2 |
53.4 |
|
Jan-2024 |
|
| |
|
|
|
US service sector slows in December as employment plummets - ISM survey. The U.S. services sector slowed considerably in December, with a measure of employment dropping to the lowest level in nearly 3-1/2 years, a survey showed on Friday. The Institute for Supply Management (ISM) said that its non-manufacturing PMI fell to 50.6 last month, the lowest reading since May, from 52.7 in November. A reading above 50 indicates growth in the services industry, which accounts for more than two-thirds of the economy. Economists polled by Reuters had forecast the index little changed at 52.6. |
No 1 |
50.6 |
|
Dec-2023 |
|
| |
|
|
|
|
|
|
|
|
| |
|
|
|
|
|
| |
|
|
|
|
|
|
|
|
|
|
|
|
|
|
|
Brief News | 2023 |
|
|
ISM Services Index | Business Activity |
|
Today's Week |
|
|
|
|
|
|
|
|
|
|
|
|
|
ISM Services Index
(At 10:00)
| DATE/WEEK |
HIGHLIGHTS |
FOR |
ACTUAL |
|
US service sector picks up in November - ISM. The U.S. services sector picked up in November amid an increase in business activity, although new orders remained flat and a gauge of input inflation dipped as the lagged effects of higher interest rates start to have a greater impact. The Institute for Supply Management (ISM) said on Tuesday that its non-manufacturing PMI rose to 52.7 in November from 51.8, which was a 5-month low. |
No 12 |
52.7 |
|
Nov-2023 |
|
| |
|
|
|
US service sector at five-month low in October- ISM survey. The U.S. services sector slowed for a second straight month in October, but momentum is likely to pick up in the near term amid an acceleration in growth in new orders. The Institute for Supply Management (ISM) said on Friday that its non-manufacturing PMI dropped to a five-month low of 51.8 from 53.6 in September. The Services PMI has been declining since August, when it rose to the highest level in six months. |
No 11 |
51.8 |
|
Oct-2023 |
|
| |
|
|
|
US service sector slows modestly in September -ISM survey. The U.S. services sector slowed in September as new orders fell to a nine-month low, but the pace remained consistent with expectations for solid economic growth in the third quarter. The Institute for Supply Management (ISM) said on Wednesday that its non-manufacturing PMI slipped to 53.6 last month from 54.5 in August. A reading above 50 indicates growth in the services industry, which accounts for more than two-thirds of the economy. It was in line with economists' expectations. |
No 10 |
53.6 |
|
Sep-2023 |
|
| |
|
|
|
US services sector picked up in August, along with prices. The U.S. services sector unexpectedly gained steam in August, with new orders firming and businesses paying higher prices for inputs -- potential signs of still-elevated inflation pressures. The Institute for Supply Management (ISM) said on Wednesday its non-manufacturing PMI rose to 54.5 last month, the highest reading since February and up from 52.7 in July. A reading above 50 indicates growth in the services industry, which accounts for more than two-thirds of the economy. |
No 9 |
54.5 |
|
Aug-2023 |
|
| |
|
|
|
Services PMI® at 52.7%; July 2023 Services ISM® Report On Business. The Business Activity Index registered 57.1 percent, a 2.1-percentage point decrease compared to the reading of 59.2 percent in June. Economic activity in the services sector expanded in July for the seventh consecutive month as the Services PMI® registered 52.7 percent, say the nation's purchasing and supply executives in the latest Services ISM® Report On Business®. The sector has grown in 37 of the last 38 months, with the lone contraction in December of last year. |
No 8 |
52.7 |
|
Jul-2023 |
|
| |
|
|
|
U.S. service sector picks up in June; inflation gradually slowing, ISM survey shows. The U.S. services sector grew faster than expected in June as new orders picked up, but a measure of prices paid by businesses for inputs fell to more than a three year low, suggesting that the closely watched services inflation would continue to cool. The Institute for Supply Management (ISM) said on Thursday that its non-manufacturing PMI increased to 53.9 last month from 50.3 in May. A reading above 50 indicates growth in the services industry, which accounts for more than two-thirds of the economy. Economists polled by Reuters had forecast the non-manufacturing PMI rising to 51.0. |
No 7 |
53.9 |
|
Jun-2023 |
|
| |
|
|
|
US services sector softens, factory orders boosted by defense. The U.S. services sector barely grew in May as new orders slowed, pushing a measure of prices paid by businesses for inputs to a three-year low, which could aid the Federal Reserve's fight against inflation. The Institute for Supply Management (ISM) said on Monday its non-manufacturing PMI fell to 50.3 last month from 51.9 in April. A reading above 50 indicates growth in the services industry, which accounts for more than two-thirds of the economy. Economists polled by Reuters had forecast the non-manufacturing PMI would edge up to 52.2. |
No 6 |
50.3 |
|
May-2023 |
|
| |
|
|
|
Services PMI® at 51.9%; April 2023 Services ISM® Report On Business. Economic activity in the services sector expanded in April for the fourth consecutive month as the Services PMI® registered 51.9 percent, say the nation's purchasing and supply executives in the latest Services ISM® Report On Business®. The sector has grown in 34 of the last 35 months, with the lone contraction in December.Services Business Survey Committee: "In April, the Services PMI® registered 51.9 percent, 0.7 percentage point higher than March's reading of 51.2 percent. |
No 5 |
51.9 |
|
Apr-2023 |
|
| |
|
|
|
U.S. service sector slows in March; inflation cooling - ISM survey. The U.S. services sector slowed more than expected in March as demand cooled, while a measure of prices paid by services businesses fell to the lowest in nearly three years, giving the Federal Reserve a boost in the fight against inflation. The Institute for Supply Management (ISM) said on Wednesday that its non-manufacturing PMI fell to 51.2 last month from 55.1 in February. A reading above 50 indicates growth in the services industry, which accounts for more than two-thirds of the economy. Economists polled by Reuters had forecast the non-manufacturing PMI decreasing to 54.5. |
No 4 |
51.2 |
|
Mar-2023 |
|
| |
|
|
|
Services sector PMI dips to 55.1 in February from 55.2. US services sector grows steadily; prices stubbornly high. The U.S. services sector grew at a steady clip in February, with new orders and employment rising to more than one-year highs, suggesting the economy continued to expand in the first quarter. The Institute for Supply Management (ISM) survey on Friday described companies as "mostly positive about business conditions." Though a measure of prices paid by businesses fell to the lowest level in just over two years, it stayed elevated, indicating that high inflation could persist. |
No 3 |
55.1 |
|
Feb-2023 |
|
| |
|
|
|
U.S. services industry activity rebounded strongly in January, with new orders recovering and prices paid by businesses for materials continuing to rise at a moderate pace, hopeful signs for the economy as it braces for a possible recession this year. The Institute for Supply Management (ISM) said on Friday its non-manufacturing PMI increased to 55.2 last month. The index dropped to 49.2 in December, falling the below the 50 level, which signals contraction, for the first time since May 2020. |
No 2 |
55.2 |
|
Jan-2023 |
|
| |
|
|
|
U.S. service sector contracts in December, price increases slow, ISM survey says. U.S. services industry activity contracted for the first time in more than 2-1/2 years in December amid weakening demand, while the pace of increase in prices paid by businesses slowed considerably, offering more evidence that inflation was abating. The Institute for Supply Management (ISM) said on Friday its non-manufacturing PMI dropped to 49.6 last month from 56.5 in November. It was the first time since May 2020 that the services PMI fell below the 50 threshold, which indicates contraction in the sector that accounts for more than two-thirds of U.S. economic activity. |
No 1 |
49.6 |
|
Dec-2022 |
|
| |
|
|
|
|
|
|
|
|
|
| |
|
|
|
|
|
| |
|
|
|
|
|
|
|
|
|
|
|
|
|
|
|
Brief News | 2022 |
|
|
ISM Services Index | Business Activity |
|
Today's Week |
|
|
|
|
|
|
|
|
|
|
|
|
|
ISM Services Index
(At 10:00)
| DATE/WEEK |
HIGHLIGHTS |
FOR |
ACTUAL |
|
U.S. services industry activity unexpectedly picked up in November, with employment rebounding, offering more evidence of underlying momentum in the economy as it braces for an anticipated recession next year. The ISM said its non-manufacturing PMI increased to 56.5 last month from 54.4 in October. It was boosted by a surge in business activity to an 11-month high. Comments from businesses included "gaining more business" and "demand for our services is increasing." |
No 12 |
56.5 |
|
Nov-2022 |
|
| |
|
|
|
In October, the Services PMI® registered 54.4 percent, a 2.3-percentage point decrease compared to the September reading of 56.7 percent. The 12-month average is 58.2 percent, reflecting consistently strong growth in the services sector, which has expanded for 29 consecutive months. |
No 11 |
54.4 |
|
Oct-2022 |
|
| |
|
|
|
Also, the ISM services index edged lower to 56.7% but still represented expansion in the sector. The reading was better than the 56% estimate. |
No 10 |
56.7 |
|
Sep-2022 |
|
| |
|
|
|
Indicates both up and down in price. In August 2022, the Services PMI® registered 56.9 percent, a 0.2-percentage point increase compared to the July reading of 56.7 percent. The 12-month average is 59.7 percent, reflecting consistently strong growth in the services sector, which has expanded for 27 consecutive months. |
No 9 |
56.9 |
|
Aug-2022 |
|
| |
|
|
|
ISM Services PMI rises to 56.7 in July above 53.5 expected. The business activity in the US service sector expanded at a more robust pace in July than in June with the ISM Services PMI rising to 56.7 from 55.3. This reading came in better than the market expectation of 53.5. Further details of the publication revealed that the Prices Paid Index declined to 72.3 from 80.1, compared to the market forecast of 81.6, and the Employment Index improved to 49.1 from 47.4. |
No 8 |
56.7 |
|
Jul-2022 |
|
| |
|
|
|
The U.S. services industry slowed less than expected in June, but a measure of services employment dropped to a two-year low, suggesting that demand for labor could be ebbing as the Federal Reserve's aggressive monetary policy stance leaves the economy staring at a recession. The Institute for Supply Management said on Wednesday its non-manufacturing activity index slipped to 55.3 last month from a reading of 55.9 in May. The third straight monthly decline pushed the index to its lowest level since May 2020, when the economy was battling the initial wave of the COVID-19 pandemic. |
No 7 |
55.3 |
|
Jun-2022 |
|
| |
|
|
|
Services PMI at 55.9%; May 2022 Services ISM Report On Business. Business Activity Index at 54.5%; New Orders Index at 57.6%; Employment Index at 50.2%; Supplier Deliveries Index at 61.3%. Economic activity in the services sector grew in May for the 24th month in a row — with the Services PMI® registering 55.9 percent — say the nation's purchasing and supply executives in the latest Services ISM® Report On Business. |
No 6 |
55.9 |
|
May-2022 |
|
| |
|
|
|
ISM Non-Manufacturing Index slipped to 57.1% in April 2022. Economic activity in the services sector grew in April for the 23rd month in a row — with the Services PMI® registering 57.1 percent — say the nation’s purchasing and supply executives in the latest Services ISM® Report On Business®. The report was issued today by Anthony Nieves, CPSM, C.P.M., A.P.P., CFPM, Chair of the Institute for Supply Management® (ISM®) Services Business Survey Committee: “In April, the Services PMI® registered 57.1 percent, 1.2 percentage points lower than March’s reading of 58.3 percent. The Business Activity Index registered 59.1 percent, an increase of 3.6 percentage points compared to the reading of 55.5 percent in March, and the New Orders Index figure of 54.6 percent is 5.5 percentage points lower than the March reading of 60.1 percent. |
No 5 |
57.1 |
|
Apr-2022 |
|
| |
|
|
|
ISM Services PMI rises to 58.3 in March 2022 vs. 58.4 expected. The headline ISM Services PMI figure rose to 58.3 in March 2022 from 56.5 the month before, a tad lower than the expected rise to 58.4, according to the latest release from the Institute of Supply Management. U.S. services industry activity picked up in March, boosted by the rolling back of pandemic restrictions, but businesses continued to face higher costs as supply strains persisted. The Institute for Supply Management said on Tuesday its non-manufacturing activity index rebounded to a reading of 58.3 last month from a one-year low of 56.5 in February. That ended three straight months of declines in the index and also signaled a shift in spending back to services from goods. |
No 4 |
58.3 |
|
Mar-2022 |
|
| |
|
|
|
Wall Street was disappointed after the ISM Service Index posted a third consecutive decline, with business activity, new orders, and employment posting hefty declines. The end of the omicron impact is likely to be impacting the soft ISM Services PMI report, so expectations should be high that a rebound occurs in March. |
No 3 |
56.5 |
|
Feb-2022 |
|
| |
|
|
|
U.S. Services Growth Cools to Almost One-Year Low on Omicron ISM gauge retreated in January for a second month, to 59.9 Measure of new export orders plunges by most on record Growth in the U.S. services sector pulled back in January to the slowest pace in nearly a year as a surge in Covid-19 cases and lingering supply constraints weighed on business activity. The Institute for Supply Management’s gauge of services activity fell to 59.9, the lowest since February of last year, from 62.3 a month earlier, according to data released Thursday. Readings above 50 signal expansion and the January print was in line with economists’ projections in a Bloomberg survey. |
No 2 |
59.9 |
|
Jan-2022 |
|
| |
|
|
|
Services PMI at 62%; December 2021 Services ISM Report On Business. In December, the Services PMI® registered 62 percent, 7.1 percentage points below November's all-time high reading of 69.1 percent. The Business Activity Index registered 67.6 percent, a decrease of 7 percentage points compared to the reading of 74.6 percent in November, and the New Orders Index registered 61.5 percent, 8.2 percentage points lower than the all-time high reading of 69.7 percent reported in November. |
No 1 |
62.0 |
|
Dec-2021 |
|
| |
|
|
|
|
|
|
|
|
| |
|
|
|
|
|
| |
|
|
|
|
|
|
|
|
|
|
|
|
|
|
|
Brief News | 2021-2022 |
|
|
ISM Services Index | Business Activity |
|
Today's Week |
|
|
|
|
|
|
|
|
|
|
|
|
|
ISM Services Index
(At 10:00)
| DATE/WEEK |
HIGHLIGHTS |
FOR |
ACTUAL |
|
In November, the Services PMI® registered 69.1 percent, a 2.4-percentage point increase compared to the October figure of 66.7 percent. This is the highest reading since the inception of the index in 2008. The 12-month average is 62.1 percent, which reflects strong and sustained demand in the services sector. The November reading indicates the services sector grew for the 18th consecutive month after two months of contraction and 122 months of growth before that. A reading above 50 percent indicates the services sector economy is generally expanding; below 50 percent indicates the services sector is generally contracting. |
No 12 |
69.1 |
|
Nov-2021 |
|
| |
|
|
|
U.S. service sector index hits record high in October; shortages worsening - ISM survey
A measure of U.S. services industry activity surged to a record high in October likely as declining COVID-19 cases boosted demand, but businesses remained burdened by snarled supply chains and the resulting exorbitant prices. The Institute for Supply Management said on Wednesday its non-manufacturing activity index vaulted to a reading of 66.7 last month. That was the highest since the series started in 1997 and followed a 61.9 reading in September. A reading above 50 indicates growth in the services sector, which accounts for more than two-thirds of U.S. economic activity. |
No 11 |
66.7 |
|
Oct-2021 |
|
| |
|
|
|
U.S. Services Gauge Edges Up as Business Activity Strengthens. ISM gauge advances slightly to 61.9 in September from 61.7. U.S. service providers expanded at a faster-than-expected pace in September, supported by a pickup in business activity and durable growth in new orders. The Institute for Supply Management’s non-manufacturing index edged up to 61.9 last month from 61.7 in August, data showed Tuesday. The median forecast in a Bloomberg survey of economists called for the measure to fall to 59.9. Readings above 50 signal growth. |
No 10 |
61.9 |
|
Sep-2021 |
|
| |
|
|
|
The ISM Services Index registered 61.7% in August; 2.4 percentage points lower than the July reading of 64.1%. This reading represents the fifteenth straight month of growth for the services sector, which has expanded for all but two of the last 139 months.The Business Activity Index registered 60.1% in August, a decrease of 6.9 percentage points from the July reading of 67.0%. This represents growth for the fifteenth consecutive month. |
No 9 |
61.7 |
|
Aug-2021 |
|
| |
|
|
|
The Services PMI registered another all-time high of 64.1 percent, which is 4 percentage points higher than the June reading of 60.1 and eclipses the previous record of 64 percent in May 2021. The July reading indicates the 14th straight month of growth for the services sector, which has expanded for all but two of the last 138 months. |
No 8 |
64.1 |
|
Jul-2021 |
|
| |
|
|
|
In June 2021, the Services PMI® registered 60.1 percent, a 3.9-percentage point decrease compared to the May figure of 64 percent. This reading indicates the services sector grew for the 13th consecutive month after two months of contraction and 122 months of growth before that. |
No 7 |
60.1 |
|
Jun-2021 |
|
| |
|
|
|
The Services PMI reached another all-time high in May, registering 64 percent, which is 1.3 percentage points higher than April's reading of 62.7 percent. The previous record high was 63.7 percent in March. The May reading indicates the 12th straight month of growth for the services sector, which has expanded for all but two of the last 136 months. |
No 6 |
64.0 |
|
May-2021 |
|
| |
|
|
|
Business Activity Index at 62.7%; New Orders Index at 63.2%; Employment Index at 58.8%; Supplier Deliveries Index at 66.1%. The Services PMI® registered 62.7 percent, which is 1 percentage point lower than last month's all-time high of 63.7 percent. The April reading indicates the 11th straight month of growth for the services sector, which has expanded for all but two of the last 135 months.The ISM Non-Manufacturing index declined to 62.7 in April, lagging the consensus expected 64.1. |
No 5 |
62.7 |
|
Apr-2021 |
|
| |
|
|
|
In March, the Services PMI® registered 63.7 percent, an 8.4 percentage-point increase compared to the February figure of 55.3 percent. This reading indicates the services sector grew for the 10th consecutive month after two months of contraction and 122 months of growth before that. |
No 4 |
63.7 |
|
Mar-2021 |
|
| |
|
|
|
U.S. services industry slowed in February amid winter storms, and prices paid by companies for inputs surged to the highest level in years. The Institute for Supply Management said its non-manufacturing activity index fell to a reading of 55.3 last month from 58.7 in January, which was the highest since February 2019. The economy has recovered 12.3 million of the 22.2 million jobs lost during the pandemic.The Institute for Supply Management (ISM) said on Wednesday its non-manufacturing activity index fell to a reading of 55.3 last month from 58.7 in January, which was the highest since February 2019. |
No 3 |
55.3 |
|
Feb-2021 |
|
| |
|
|
|
Services PMI at 58.7%; January 2021 Services ISM Report On Business. In January, the Services PMI registered 58.7 percent, 1 percentage point higher than seasonally adjusted December figure of 57.7 percent. This reading indicates the services sector grew for the eighth consecutive month after two months of contraction and 122 months of growth before that. |
No 2 |
58.7 |
|
Jan-2021 |
|
| |
|
|
|
Services PMI at 57.2%; December 2020 Services ISM® Report On Business. Business Activity Index at 59.4%; New Orders Index at 58.5%; Employment Index at 48.2%; Supplier Deliveries Index at 62.8%. Economic activity in the services sector grew in December for the seventh month in a row, say the nation's purchasing and supply executives in the latest Services ISM® Report On Business. |
No 1 |
57.2 |
|
Dec-2020 |
|
| |
|
|
|
|
|
|
|
|
|
| |
|
Legends: |
|
Delayed |
|
Positive View |
|
Negative View |
|
Neutral View |
|
Non Available |
|
|
|
|
|
|
|
|
|
|
|
|
|
|
|
|
|
|
|
|
| |
|
|
|
|
|
|
|
|
|
|
|
|
|
|
|
|
|
|
|
|
|
Definitions | Explain |
|
|
ISM Services Index | Business Activity |
|
Today's Week |
|
|
|
|
|
|
|
|
|
|
|
|
| |
|
|
|
|
| |
|
| ISM SERVICE INDEX |
What is it ?
It's a gauge of new business orders from the Institute for Supply Management. The Non Manufacturing Business Activty Index is also referred to as the services index, or service sector index because this index measures activity in the services sector, the dominant sector in the US, and the one creating most of the jobs we have seen of late. Think of it as the B list of economic data reports.
The inventory, which can translate to investment opportunities and guidance in managing a portfolio.
The ISM Service Index / Non Manufacturing Business Activty Index is made up of:
1. Business Activity,
2. New Orders,
3. Employment and
4. Supplier Deliveries, all equally weighted.
New orders are an indicator of future business activity,
How to Read the Chart
A reading above 50% indicates the non- manufacturing sector economy is generally expanding; below 50% indicates the non-manufacturing sector is generally contracting.
The ISM non-manufacturing report comprises largely, but not exclusively, the service sector activities that make up the lion's share of total U.S. economic output. The report follows the release earlier in the day of better-than-expected hiring data, and the release earlier in the week of the ISM's contractionary factory sector report.
|
|
|
| |
|
|
|
|
|
|
|
|
|
|
|
|
|
|
|
|
|
|
|
|
|
Data | Source |
|
|
ISM Services Index | Business Activity |
|
Today's Week |
|
|
|
|
|
|
|
|
|
|
|
|
| |
|
|
|
|
|
|
| DATA INFORMATION |
ISM SERVICES INDEX |
| SOURCE |
The Conference Board |
| WEB |
http://www.conference-board.org |
| FREQUENCY |
Monthly |
| AVAILABILITY |
Third week of the month. |
| COVERAGE |
Data are for the previous month. Data for June are released in July. |
| REVISIONS |
Yes |
| IMPORTANCE |
Business Activity - Low Importance |
|
| |
|
|
|
|
|
|
|
|
|
|
|
|