|
 |
|
 |
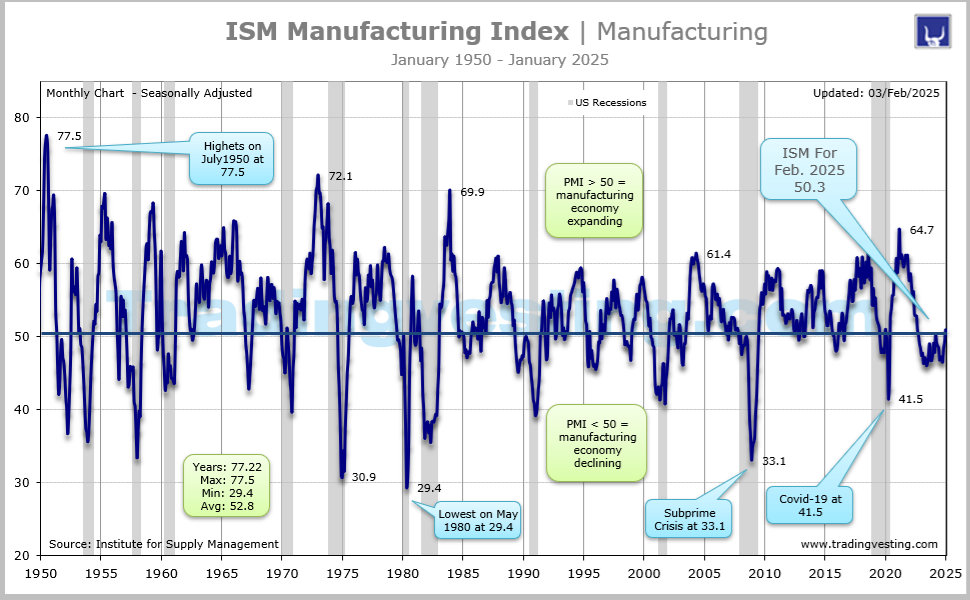
ISM Manufacturing Index | Manufacturing |
|
 |
|
A monthly index based on a survey of more than 300 manufacturing firms by the Institute of Supply Management. The ISM Mfg Index is the first read we get on the economy at the start of each month.→ Read more
|
|
|
|
|
|
|
| |
|
| |
 1. ISM Manufacturing Index (1 of 9)
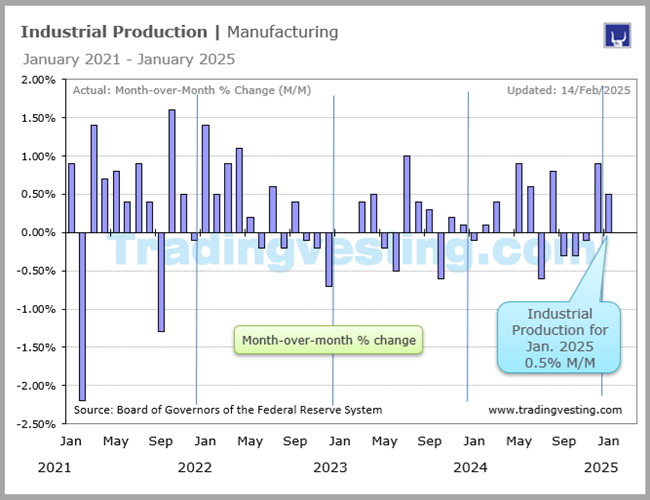 2. Industrial Production (2 of 9)
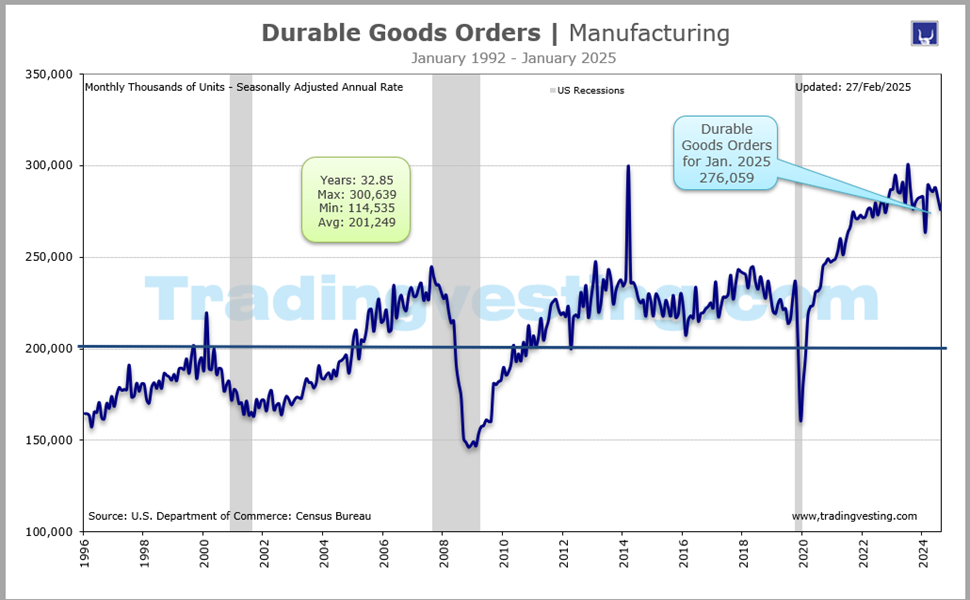
 3. Durable Goods Orders (3 of 9)
 4. Factory Orders (4 of 9)
 5. Empire State Mafg Index (5 of 9)
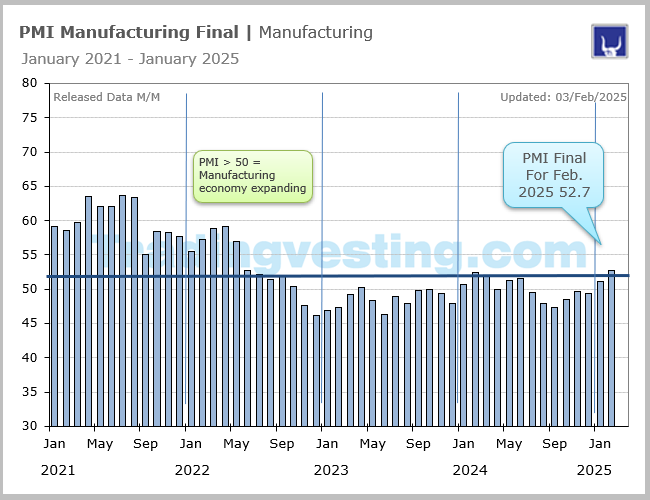 6. PMI Mfg Final (6 of 9)
 7. PMI Composite Flash (7 of 9)
 8. Chicago PMI (8 of 9)
 9. Philadelphia Mfg Index (9 of 9)
|
 |
|
|
|
|
|
|
→ Big Chart |
|
→ Release |
|
|
|
|
|
| |
|
|
|
|
|
|
|
|
|
|
|
|
|
|
|
|
|
|
|
 |
|
Big Chart | Large Data |
 |
|
ISM Manufacturing Index | Manufacturing |
|
Today's Week |
 |
|
|
|
|
|
|
|
|
|
|
|
|
|
| |
|
|
|
|
|
|
|
|
|
|
|
|
|
|
|
|
|
|
|
|
|
Slides | Nine 9 |
|
|
ISM Manufacturing Index | Manufacturing |
|
Today's Week |
|
|
|
|
|
|
|
|
|
|
|
|
|
|
| |
|
|
|
|
|
|
|
|
|
|
|
|
|
|
|
|
|
|
|
|
|
Release Schedule | 2026 |
|
|
ISM Manufacturing Index | Manufacturing |
|
Today's Week |
|
|
|
|
|
|
|
|
|
|
|
|
| → ISM Manufacturing Index (At 10:00 am ET) |
|
| RELEASE |
No 1 |
No 2 |
No 3 |
No 4 |
No 5 |
No 6 |
No 7 |
No 8 |
No 9 |
No 10 |
No 11 |
No 12 |
Week | 2026 |
|
|
|
|
|
|
|
|
|
|
|
|
Date | 2026 |
|
|
|
|
|
|
|
|
|
|
|
|
Day | 2026 |
|
|
|
|
|
|
|
|
|
|
|
|
|
|
|
|
|
|
|
|
|
|
|
|
|
Prior |
48.2 |
47.9 |
52.6 |
52.4 |
52.7 |
52.7 |
... |
... |
... |
... |
... |
... |
Prior Rev |
... |
... |
... |
... |
... |
... |
... |
... |
... |
... |
... |
... |
CONSENSUS |
48.3 |
48.5 |
51.8 |
52.3 |
52.0 |
53.1 |
... |
... |
... |
... |
... |
... |
Low |
48.0 |
48.0 |
50.5 |
52.0 |
51.9 |
52.0 |
... |
... |
... |
... |
... |
... |
High |
48.8 |
49.5 |
53.0 |
53.0 |
56.0 |
53.5 |
... |
... |
... |
... |
... |
... |
ISM LEVEL |
47.9 |
52.6 |
52.4 |
52.7 |
52.7 |
54.0 |
... |
... |
... |
... |
... |
... |
Level 50 |
Contract |
Expand |
Expand |
Expand |
Expand |
Expand |
Level |
Level |
Level |
Level |
Level |
Level |
Last Year |
49.3 |
50.9 |
50.3 |
49.0 |
48.7 |
48.5 |
49.0 |
48.0 |
48.7 |
49.1 |
47.2 |
46.5 |
RATING |
|
|
|
|
|
|
|
|
|
|
|
|
Month For |
Dec-25 |
Jan-26 |
Feb-26 |
Mar-26 |
Apr-26 |
May-26 |
Jun-26 |
Jul-26 |
Aug-26 |
Sep-26 |
Oct-26 |
Nov-26 |
|
|
|
|
| → Brief News 2026 |
 |
| |
|
|
|
|
|
|
|
|
|
|
|
Release Schedule | 2025 |
|
|
ISM Manufacturing Index | Manufacturing |
|
Today's Week |
|
|
|
|
|
|
|
|
|
|
|
|
| → ISM Manufacturing Index (At 10:00 am ET) |
|
| RELEASE |
No 1 |
No 2 |
No 3 |
No 4 |
No 5 |
No 6 |
No 7 |
No 8 |
No 9 |
No 10 |
No 11 |
No 12 |
Week | 2025 |
|
|
|
|
|
|
|
|
|
|
|
|
Date | 2025 |
|
|
|
|
|
|
|
|
|
|
|
|
Day | 2025 |
|
|
|
|
|
|
|
|
|
|
|
|
|
|
|
|
|
|
|
|
|
|
|
|
|
Prior |
48.4 |
49.3 |
50.9 |
50.3 |
49.0 |
48.7 |
48.5 |
49.0 |
48.0 |
48.7 |
49.1 |
48.7 |
Prior Rev |
... |
49.2 |
... |
... |
... |
... |
... |
... |
... |
... |
... |
... |
CONSENSUS |
48.5 |
49.5 |
50.5 |
49.6 |
47.9 |
49.1 |
48.8 |
49.5 |
48.9 |
49.0 |
49.5 |
49.0 |
Low |
47.5 |
48.3 |
50.0 |
48.5 |
47.0 |
47.7 |
48.1 |
48.2 |
47.4 |
48.0 |
48.1 |
48.3 |
High |
48.6 |
51.6 |
52.0 |
50.3 |
49.7 |
51.5 |
49.5 |
52.0 |
49.5 |
50.0 |
50.1 |
49.3 |
ISM LEVEL |
49.3 |
50.9 |
50.3 |
49.0 |
48.7 |
48.5 |
49.0 |
48.0 |
48.7 |
49.1 |
48.7 |
48.2 |
level 50 |
Contract |
Expand |
Expand |
Contract |
Contract |
Contract |
Contract |
Contract |
Contract |
Contract |
Contract |
Contract |
Last Year |
47.4 |
49.1 |
47.8 |
50.3 |
49.2 |
48.7 |
48.5 |
46.8 |
47.2 |
47.2 |
46.5 |
48.4 |
RATING |
|
|
|
|
|
|
|
|
|
|
|
|
Month For |
Dec-24 |
Jan-25 |
Feb-25 |
Mar-25 |
Apr-25 |
May-25 |
Jun-25 |
Jul-25 |
Aug-25 |
Sep-25 |
Oct-25 |
Nov-25 |
|
|
|
| → Brief News 2025 |
|
| |
|
|
|
|
|
|
|
|
|
|
|
Release Schedule | 2024 |
|
|
ISM Manufacturing Index | Manufacturing |
|
Today's Week |
|
|
|
|
|
|
|
|
|
|
|
|
|
ISM Manufacturing Index (At 10:00 a.m ET)
| SCHEDULE 2024 |
No 1 |
No 2 |
No 3 |
No 4 |
No 5 |
No 6 |
No 7 |
No 8 |
No 9 |
No 10 |
No 11 |
No 12 |
| Release | Week |
|
|
|
|
|
|
|
|
|
|
|
|
| Release | Date |
|
|
|
|
|
|
|
|
|
|
|
|
| Release | Day |
|
|
|
|
|
|
|
|
|
|
|
|
|
|
|
|
|
|
|
|
|
|
|
|
|
| Prior |
46.7 |
47.4 |
49.1 |
47.8 |
50.3 |
49.2 |
48.7 |
48.5 |
46.8 |
47.2 |
47.2 |
46.5 |
| Prior Revised |
... |
47.1 |
... |
... |
... |
... |
... |
... |
... |
... |
... |
... |
| CONSENSUS |
47.2 |
47.4 |
49.5 |
48.3 |
50.0 |
49.8 |
49.1 |
48.8 |
47.5 |
47.6 |
47.6 |
47.6 |
| Consensus Low |
45.6 |
43.0 |
48.5 |
47.5 |
49.5 |
48.8 |
48.0 |
48.0 |
46.0 |
47.0 |
47.1 |
47.0 |
| Consensus High |
48.1 |
48.1 |
51.5 |
49.5 |
50.6 |
50.0 |
50.0 |
50.1 |
48.5 |
48.5 |
48.0 |
49.4 |
| ISM Level |
47.4 |
49.1 |
47.8 |
50.3 |
49.2 |
48.7 |
48.5 |
46.8 |
47.2 |
47.2 |
46.5 |
48.4 |
| Index 50 Level |
Contract |
Contract |
Contract |
Expand |
Contract |
Contract |
Contract |
Contract |
Contract |
Contract |
Contract |
Contract |
| RATING |
|
|
|
|
|
|
|
|
|
|
|
|
| Month For |
Dec-23 |
Jan-24 |
Feb-24 |
Mar-24 |
Apr-24 |
May-24 |
Jun-24 |
Jul-24 |
Aug-24 |
Sep-24 |
Oct-24 |
Nov-24 |
|
|
| |
|
| |
|
|
|
|
|
|
|
|
|
|
|
Release Schedule | 2023 |
|
|
ISM Manufacturing Index | Manufacturing |
|
Today's Week |
|
|
|
|
|
|
|
|
|
|
|
|
|
ISM Manufacturing Index (At 10:00 a.m ET)
| SCHEDULE 2023 |
No 1 |
No 2 |
No 3 |
No 4 |
No 5 |
No 6 |
No 7 |
No 8 |
No 9 |
No 10 |
No 11 |
No 12 |
| Release | Week |
|
|
|
|
|
|
|
|
|
|
|
|
| Release | Date |
|
|
|
|
|
|
|
|
|
|
|
|
| Release | Day |
|
|
|
|
|
|
|
|
|
|
|
|
|
|
|
|
|
|
|
|
|
|
|
|
|
| Prior |
49.0 |
48.4 |
47.4 |
47.7 |
46.3 |
47.1 |
46.9 |
46.0 |
46.4 |
47.6 |
49.0 |
46.7 |
| Prior Revised |
... |
... |
... |
... |
... |
... |
... |
... |
... |
... |
... |
... |
| CONSENSUS |
48.1 |
48.0 |
48.0 |
47.5 |
46.8 |
47.0 |
47.3 |
46.5 |
46.8 |
47.8 |
49.0 |
47.5 |
| Consensus Low |
47.5 |
47.5 |
47.0 |
46.0 |
46.4 |
46.5 |
46.6 |
46.0 |
45.5 |
47.2 |
48.0 |
46.3 |
| Consensus High |
49.0 |
48.7 |
49.0 |
49.0 |
48.6 |
48.2 |
48.5 |
54.7 |
47.5 |
50.0 |
50.0 |
52.0 |
| ISM Level |
48.4 |
47.4 |
47.7 |
46.3 |
47.1 |
46.9 |
46.0 |
46.4 |
47.6 |
49.0 |
46.7 |
46.7 |
| Index 50 Level |
Contract |
Contract |
Contract |
Contract |
Contract |
Contract |
Contract |
Contract |
Contract |
Contract |
Contract |
Contract |
| RATING |
|
|
|
|
|
|
|
|
|
|
|
|
| Month For |
Dec-22 |
Jan-23 |
Feb-23 |
Mar-23 |
Apr-23 |
May-23 |
Jun-23 |
Jul-23 |
Aug-23 |
Sep-23 |
Oct-23 |
Nov-23 |
|
|
| |
|
| |
|
|
|
|
|
|
|
|
|
|
|
Release Schedule | 2022 |
|
|
ISM Manufacturing Index | Manufacturing |
|
Today's Week |
|
|
|
|
|
|
|
|
|
|
|
|
|
ISM Manufacturing Index (At 10:00 a.m ET)
| SCHEDULE 2022 |
No 1 |
No 2 |
No 3 |
No 4 |
No 5 |
No 6 |
No 7 |
No 8 |
No 9 |
No 10 |
No 11 |
No 12 |
| Release | Week |
|
|
|
|
|
|
|
|
|
|
|
|
| Release | Date |
|
|
|
|
|
|
|
|
|
|
|
|
| Release | Day |
|
|
|
|
|
|
|
|
|
|
|
|
|
|
|
|
|
|
|
|
|
|
|
|
|
| Prior |
61.1 |
58.7 |
57.6 |
58.6 |
57.1 |
55.4 |
56.1 |
53.0 |
52.8 |
52.8 |
50.9 |
50.2 |
| Prior Revised |
... |
... |
... |
... |
... |
... |
... |
... |
... |
... |
... |
... |
| CONSENSUS |
60.5 |
57.5 |
58.0 |
59.0 |
58.0 |
54.5 |
55.0 |
52.2 |
52.0 |
52.4 |
50.0 |
49.9 |
| Consensus Low |
59.4 |
54.0 |
55.7 |
57.0 |
56.5 |
51.5 |
52.0 |
50.5 |
49.5 |
50.7 |
49.0 |
49.5 |
| Consensus High |
61.3 |
58.5 |
58.2 |
59.7 |
58.7 |
56.2 |
56.0 |
53.5 |
53.1 |
53.7 |
50.7 |
52.0 |
| ISM Level |
58.7 |
57.6 |
58.6 |
57.1 |
55.4 |
56.1 |
53.0 |
52.8 |
52.8 |
50.9 |
50.2 |
49.0 |
| Index 50 Level |
Expand |
Expand |
Expand |
Expand |
Expand |
Expand |
Expand |
Expand |
Expand |
Expand |
Expand |
Contract |
| RATING |
|
|
|
|
|
|
|
|
|
|
|
|
| Month For |
Dec-21 |
Jan-22 |
Feb-22 |
Mar-22 |
Apr-22 |
May-22 |
Jun-22 |
Jul-22 |
Aug-22 |
Sep-22 |
Oct-22 |
Nov-22 |
|
|
| |
|
| |
|
|
|
|
|
|
|
|
|
|
|
Release Schedule | 2021 |
|
|
ISM Manufacturing Index | Manufacturing |
|
Today's Week |
|
|
|
|
|
|
|
|
|
|
|
|
|
ISM Manufacturing Index (At 10:00 a.m ET)
| SCHEDULE 2021 |
No 1 |
No 2 |
No 3 |
No 4 |
No 5 |
No 6 |
No 7 |
No 8 |
No 9 |
No 10 |
No 11 |
No 12 |
| Release | Week |
|
|
|
|
|
|
|
|
|
|
|
|
| Release | Date |
|
|
|
|
|
|
|
|
|
|
|
|
| Release | Day |
|
|
|
|
|
|
|
|
|
|
|
|
|
|
|
|
|
|
|
|
|
|
|
|
|
| Prior |
57.7 |
60.7 |
58.7 |
60.8 |
64.7 |
60.7 |
61.2 |
60.6 |
59.5 |
59.9 |
61.1 |
60.8 |
| Prior Revised |
... |
... |
... |
... |
... |
... |
... |
... |
... |
... |
... |
... |
| CONSENSUS |
59.9 |
60.0 |
58.9 |
61.5 |
65.0 |
60.9 |
61.0 |
60.8 |
58.6 |
59.8 |
60.3 |
61.1 |
| Consensus Low |
58.0 |
59.0 |
57.5 |
59.8 |
62.0 |
59.9 |
59.5 |
60.0 |
57.0 |
58.8 |
59.0 |
60.0 |
| Consensus High |
60.0 |
61.5 |
59.5 |
63.4 |
66.0 |
62.0 |
62.0 |
61.5 |
59.0 |
61.5 |
62.0 |
62.5 |
| ISM Level |
60.7 |
58.7 |
60.8 |
64.7 |
60.7 |
61.2 |
60.6 |
59.5 |
59.9 |
61.1 |
60.8 |
61.1 |
| Index 50 Level |
Expand |
Expand |
Expand |
Expand |
Expand |
Expand |
Expand |
Expand |
Expand |
Expand |
Expand |
Expand |
| RATING |
|
|
|
|
|
|
|
|
|
|
|
|
| Month For |
Dec-20 |
Jan-21 |
Feb-21 |
Mar-21 |
Apr-21 |
May-21 |
Jun-21 |
Jul-21 |
Aug-21 |
Sep-21 |
Oct-21 |
Nov-21 |
|
|
| |
|
| |
|
Legends: |
 |
Delayed |
 |
Positive View |
 |
Negative View |
 |
Neutral View |
 |
Non Available |
|
|
|
|
|
|
|
|
|
|
|
|
|
|
|
|
|
|
|
|
| |
|
|
|
|
|
|
|
|
|
|
|
|
|
|
|
|
|
|
|
|
|
Brief News | 2026 |
|
|
ISM Manufacturing Index | Manufacturing |
|
Today's Week |
|
|
|
|
|
|
|
|
|
|
|
|
|
ISM Manufacturing Index (At 10:00 a.m ET)
| DATE/WEEK |
HIGHLIGHTS |
FOR |
ISM |
|
ISM manufacturing |
No 12 |
... |
|
Nov-2026 |
|
| |
|
|
|
ISM manufacturing |
No 11 |
... |
|
Oct-2026 |
|
| |
|
|
|
ISM manufacturing |
No 10 |
... |
|
Sep-2026 |
|
| |
|
|
|
ISM manufacturing |
No 9 |
... |
|
Aug-2026 |
|
| |
|
|
|
ISM manufacturing |
No 8 |
... |
|
Jul-2026 |
|
| |
|
|
|
ISM manufacturing |
No 7 |
... |
|
Jun-2026 |
|
| |
|
|
|
ISM manufacturing |
No 6 |
... |
|
May-2026 |
|
| |
|
|
|
ISM manufacturing |
No 5 |
... |
|
Apr-2026 |
|
| |
|
|
|
ISM manufacturing |
No 4 |
52.7 |
|
Mar-2026 |
|
| |
|
|
|
ISM manufacturing |
No 3 |
52.4 |
|
Feb-2026 |
|
| |
|
|
|
ISM manufacturing |
No 2 |
52.6 |
|
Jan-2026 |
|
| |
|
|
|
The ISM Manufacturing PMI for December 2025 has shown a contraction in the manufacturing sector, with the index falling to 47.9%. This marks the lowest reading of 2025 and the 10th consecutive month of contraction for the industry. The production index fell 0.4 points from the previous month but remained in expansion territory at 51.0%. The new orders and employment indexes increased to 47.7% and 44.9%, respectively, indicating contraction at a slower rate than in November. Despite the contraction, there are positive signs for December, such as improvements in new orders, backlog of orders, and new export orders, and the customers’ inventories index remaining in ‘too low’ territory. However, several consecutive months of gains in these indicators are necessary for a longer-term recover. |
No 1 |
47.9 |
|
Dec-2025 |
|
| |
|
|
|
|
|
|
|
|
| |
|
|
|
|
|
|
|
|
|
|
|
|
|
|
|
|
|
|
|
|
|
Brief News | 2025 |
|
|
ISM Manufacturing Index | Manufacturing |
|
Today's Week |
|
|
|
|
|
|
|
|
|
|
|
|
|
ISM Manufacturing Index (At 10:00 a.m ET)
| DATE/WEEK |
HIGHLIGHTS |
FOR |
ISM |
|
The ISM Manufacturing PMI® report for November 2025 indicates a contraction in the manufacturing sector, with the index reading 48.2%, down from 48.7% in October. This marks the ninth consecutive month of contraction, following a two-month expansion. The report highlights a decline in the New Orders Index, Production Index, and Employment Index, while the Prices Index remains in expansion territory. The overall economic expansion continues, but the manufacturing sector's contraction raises concerns about broader economic momentum. |
No 12 |
48.2 |
|
Nov-2025 |
|
| |
|
|
|
The Institute for Supply Management reported that the ISM manufacturing index for October came in below expectations at 48.7%. That missed the Dow Jones forecast for 49.3% and marked a decrease of 0.4 percentage point from September. US factory activity shrank in October for an eighth straight month, driven by a pullback in production and tepid demand. The Institute for Supply Management’s manufacturing index eased 0.4 point to 48.7, according to data released Monday. Readings below 50 indicate contraction, and the measure has been stuck in a narrow range for most of this year. Economists and policymakers are relying more on private reports such as the ISM survey for clues on the economy and job market in the absence of official data because of the US government shutdown. Friday’s scheduled employment report is also poised to be delayed as a result. |
No 11 |
48.7 |
|
Oct-2025 |
|
| |
|
|
|
The Institute for Supply Management (ISM) Manufacturing Index (PMI) for September 2025 came in at 49.1, up from 48.7 in August, but still indicating contraction in the manufacturing sector for the seventh consecutive month. This reading was slightly above the market expectation of 49.0. While the overall index shows contraction (a reading below 50), the production index rose to 51.0, and new orders fell to 48.9, indicating mixed results within the sector. September 2025 Reading: 49.1, an increase from August's 48.7. Expectations: The 49.1 reading was slightly better than the 49.0 expected by the market. Trend: This marks the seventh straight month of contraction for the manufacturing sector. |
No 10 |
49.1 |
|
Sep-2025 |
|
| |
|
|
|
ISM Data out Tuesday from the Institute for Supply Management showed the ISM's manufacturing PMI came in at 48.7 last month, Aug 2025, an increase from the reading of 48 seen in July but below estimates for a reading of 48.9, according to Bloomberg data. Readings of less than 50 on the index indicate a contraction in activity in the sector. This marked the sixth straight month of contraction in the US manufacturing sector, according to the ISM's reading. |
No 9 |
48.7 |
|
Aug-2025 |
|
| |
|
|
|
U.S. manufacturing contracted for a fifth straight month in July 2025 and factory employment dropped to the lowest level in five years amid tariffs that have raised prices of imported raw materials. The Institute for Supply Management (ISM) said on Friday that its manufacturing PMI dropped to 48.0 last month from 49.0 in June. A PMI reading below 50 indicates contraction in manufacturing, which accounts for 10.2% of the economy. |
No 8 |
48.0 |
|
Jul-2025 |
|
| |
|
|
|
The Manufacturing PMI® registered 49 percent in June 2025, a 0.5-percentage point increase compared to the 48.5 percent recorded in May 2025 manufacturing. The ISM Manufacturing Index Increased to 49.0 in Jun e 2025. Activity in the manufacturing sector continued to decline in June, but not by as much as the consensus expected. This makes four consecutive months that the ISM Manufacturing Index has been below 50. |
No 7 |
49.0 |
|
Jun-2025 |
|
| |
|
|
|
The ISM Manufacturing PMI for May 2025 is 48.5, according to the Institute for Supply Management. This indicates a contraction in the manufacturing sector for the third consecutive month, following a brief expansion in the preceding two months. The Manufacturing PMI® registered 48.5 percent in May, 0.2 percentage point lower compared to the 48.7 percent recorded in April. The surprise decline in the ISM manufacturing index in May 2025 indicates that tariffs continue to weigh significantly on the sector |
No 6 |
48.5 |
|
May-2025 |
|
| |
|
|
|
April for the second consecutive month after
two months of expansion preceded by 26 months of contraction. The Manufacturing PMI® registered 48.7 percent, 0.3 percentage point lower compared to the 49 percent reported in March. After reversing its recent momentum in March, the Manufacturing PMI® again registered below its reading in December. Of the five subindexes that directly factor into the Manufacturing PMI®, two (Supplier Deliveries and Inventories) were in expansion territory, the same as last month. |
No 5 |
48.7 |
|
Apr-2025 |
|
| |
|
|
|
The manufacturing sector took a turn for the worse in March 2025, with the ISM Manufacturing index falling back below 50.0 to 49.0, the first contractionary reading this year. It’s important to remember that before 2025, the manufacturing sector had been limping along the last two years: the ISM index was below 50 every single month for 2023-24. Now, manufacturers will also have to contend with uncertainty surrounding tariffs (whether they are actually put in place or not, and to what degree), and the resulting changes in supply chains. |
No 4 |
49.0 |
|
Mar-2025 |
|
| |
|
|
|
The Manufacturing PMI® registered 50.3 percent in February 2025, 0.6 percentage point lower compared to the 50.9 percent recorded in January 2025. The overall economy continued in expansion for the 58th month after one month of contraction in April 2020. - U.S. manufacturing was steady in February, but a measure of prices at the factory gate jumped to nearly a three-year high and it took longer for materials to be delivered, suggesting that tariffs on imports could soon undercut production. The ISM's manufacturing PMI slipped to 50.3 last month from 50.9 in January, which marked the first expansion since October 2022 and likely reflected factories front-loading imports to beat tariffs. A PMI reading above 50 indicates growth in the manufacturing sector, which accounts for 10.3% of the economy. Economists polled by Reuters had forecast the PMI would ease to 50.8. |
No 3 |
50.3 |
|
Feb-2025 |
|
| |
|
|
|
Following 26 consecutive months of contraction, the Institute for Supply Management released a report on Monday showing U.S. manufacturing activity expanded in the month of January 2025 to 50.9. The ISM said its manufacturing PMI rose to 50.9 in January 2025 from 49.2 in December 2024, with a reading above 50 indicating growth. Economists had expected the index to inch up to 49.8. |
No 2 |
50.9 |
|
Jan-2025 |
|
| |
|
|
|
US ISM Manufacturing PMI improves to 49.3 in December 2024 vs. 48.4 expected. The business activity in the US manufacturing sector continued to contract, albeit at a softening pace in December, with the ISM Manufacturing PMI rising to 49.3 from 48.4 in November. This reading came in better than the market expectation of 48.4. |
No 1 |
49.3 |
|
Dec-2024 |
|
| |
|
|
|
|
|
|
|
|
| |
|
|
|
|
|
| |
|
|
|
|
|
|
|
|
|
|
|
|
|
|
|
Brief News | 2024 |
|
|
ISM Manufacturing Index | Manufacturing |
|
Today's Week |
|
|
|
|
|
|
|
|
|
|
|
|
|
ISM Manufacturing Index (At 10:00 a.m ET)
| DATE/WEEK |
HIGHLIGHTS |
FOR |
ISM |
|
US manufacturing PMI rises to 48.4 in November: ISM. The Institute for Supply Management (ISM) reported manufacturing activity to have shrunk by less than forecasted for November. ISM's manufacturing purchasing managers' index (PMI) rose to 48.4 in November, above expectations and up by 1.9 from October's 46.5 reading. |
No 12 |
48.4 |
|
Nov-2024 |
|
| |
|
|
|
Economic activity in the manufacturing sector contracted in October for the seventh consecutive month and the 23rd time in the last 24 months. The Manufacturing PMI® registered 46.5 percent in October, 0.7 percentage point lower compared to the 47.2 percent recorded in September. This is the lowest Manufacturing PMI® reading in 2024. The overall economy continued in expansion for the 54th month after one month of contraction in April 2020. A Manufacturing PMI® above 42.5 percent, over a period of time, generally indicates an expansion of the overall economy. |
No 11 |
46.5 |
|
Oct-2024 |
|
| |
|
|
|
The Institute of Supply Management's manufacturing index, as market participants tried to gain fresh insight into the state of the US economy amid ongoing fears surrounding a potential US recession. The ISM's manufacturing PMI was flat month-on-month in September at 47.2, falling slightly short of expectations for a reading of 47.5 and continuing to point to a contraction in the manufacturing sector as demand continued to be weak and output fell. Economic activity in the manufacturing sector contracted in September for the sixth consecutive month and the 22nd time in the last 23 months. The Manufacturing PMI® registered 47.2 percent in September, matching the figure recorded in August. The overall economy continued in expansion for the 53rd month after one month of contraction in April 2020. |
No 10 |
47.2 |
|
Sep-2024 |
|
| |
|
|
|
Weak manufacturing measures raise specter of U.S. economic slowdown. The ISM monthly survey of purchasing managers showed that just 47.2% reported expansion in August, above the July reading but below the consensus forecast. Another weak economic reading raises the probability the Fed will be cutting interest rates by at least a quarter percentage point later this month. |
No 9 |
47.2 |
|
Aug-2024 |
|
| |
|
|
|
Slump goes on: Manufacturing contracts for fourth month in a row, ISM finds. ISM manufacturing index drops to 8-month low. The numbers: A key barometer of U.S. factories fell in July for the fourth consecutive month and hit an eight-month low — a sign that an ongoing slump in the industrial side of the economy has deepened. The Institute for Supply Management’s manufacturing index slid to 46.8% last month from 48.5% in June. Numbers below 50% signal the manufacturing sector is shrinking. |
No 8 |
46.8 |
|
Jul-2024 |
|
| |
|
|
|
Manufacturers mired in a slump, ISM finds, and aren’t adding much to the U.S. economy. ISM manufacturing index falls for third month in a row. A key barometer of U.S. factories fell in June for the third month in a row, signaling that an ongoing slump in the industrial side of the economy shows no sign of ending. The index slipped to 48.5% in June from 48.7% in in the prior month. Numbers below 50% signal that the manufacturing sector is shrinking. |
No 7 |
48.5 |
|
Jun-2024 |
|
| |
|
|
|
Economic activity in the U.S. manufacturing sector faced contraction for the second consecutive month in May 2024, marking the 18th time in the last 19 months. The Manufacturing PMI® dipped to 48.7 percent in May, down 0.5 percentage points from April’s 49.2 percent. This decline reflects a continued struggle, with the New Orders Index slipping further into contraction at 45.4 percent, indicating a softening demand. |
No 6 |
48.7 |
|
May-2024 |
|
| |
|
|
|
Economic activity in the manufacturing sector contracted in April 2024 after one month of expansion following 16 consecutive months of contraction, say the nation's supply executives in the latest Manufacturing ISM® Report On Business®. "The Manufacturing PMI® registered 49.2 percent in April 2024, down 1.1 percentage points from the 50.3 percent recorded in March. The overall economy continued in expansion for the 48th month after one month of contraction in April 2020. (A Manufacturing PMI® above 42.5 percent, over a period of time, generally indicates an expansion of the overall economy |
No 5 |
49.2 |
|
Apr-2024 |
|
| |
|
|
|
US manufacturing on the mend; rising raw material prices pose obstacle. - U.S. manufacturing grew for the first time in 1-1/2 years in March as production rebounded sharply and new orders increased, but employment at factories remained subdued amid "sizable layoff activity" and prices for inputs pushed higher.Manufacturing PMI jumps 2.5 points to 50.3 in March 2024. New orders, production measures rebound. Construction spending drops 0.3% in February. |
No 4 |
50.3 |
|
Mar-2024 |
|
| |
|
|
|
ISM manufacturing gauge shows contraction worsened in February. U.S. manufacturing activity pulled back more than expected in February on a decline in new orders, production and employment readings, the Institute for Supply Management reported Friday.,The ISM manufacturing index slipped to 47.8 for the month, down 1.3 points from January and below the 49.5 estimate from Dow Jones. As the index measures the percentage level of business reporting expansion, anything below 50 represents contraction for the sector, though readings above 42.5 are consistent with broader economic growth. |
No 3 |
47.8 |
|
Feb-2024 |
|
| |
|
|
|
The U.S. manufacturing sector remained in contraction during January 2024, while prices posted an unexpected jump. The ISM Manufacturing Index came in at 49.1, an increase of 2 points from December and better than the Dow Jones estimate for 47.2. However, because the gauge is a diffusion index measuring the share of business reporting expansion, any reading below 50 represents contraction. The sector has been in contraction for 15 straight months. |
No 2 |
49.1 |
|
Jan-2024 |
|
| |
|
|
|
US manufacturing sector eyes recovery in December - ISM. U.S. manufacturing contracted further in December, though the pace of decline slowed amid a modest rebound in production and improvement in factory employment. The Institute for Supply Management (ISM) said on Wednesday that its manufacturing PMI increased to 47.4 last month December 2023 after being unchanged at 46.7 for two straight months. It was the 14th consecutive month that the PMI stayed below 50, which indicates contraction in manufacturing. That is the longest such stretch since the period from August 2000 to January 2002. |
No 1 |
47.4 |
|
Dec-2023 |
|
| |
|
|
|
|
|
|
|
|
| |
|
|
|
|
|
| |
|
|
|
|
|
|
|
|
|
|
|
|
|
|
|
Brief News | 2023 |
|
|
ISM Manufacturing Index | Manufacturing |
|
Today's Week |
|
|
|
|
|
|
|
|
|
|
|
|
|
ISM Manufacturing Index (At 10:00 a.m ET)
| DATE/WEEK |
HIGHLIGHTS |
FOR |
ACTUAL |
|
The survey from the Institute for Supply Management (ISM) on Friday followed on the heels of data on Thursday showing moderate growth in consumer spending and subsiding inflation in October. Economic activity is cooling as higher interest rates crimp demand. Most economists, however, do not expect a recession next year and believe the Federal Reserve will be able to engineer the hoped-for "soft landing.". The ISM said that its manufacturing PMI was unchanged at 46.7 last month November. It was the 13th consecutive month that the PMI stayed below 50, which indicates contraction in manufacturing. That is the longest such stretch since the period from August 2000 to January 2002. |
No12 |
46.7 |
|
Nov-2023 |
|
| |
|
|
|
U.S. manufacturing sector slumps in October-ISM. U.S. manufacturing contracted sharply in October after showing signs of improvement in prior months as new orders and employment slumped, likely reflecting strikes by the United Auto Workers (UAW) union against Detroit's Big Three car makers. The Institute for Supply Management (ISM) said on Wednesday that its manufacturing PMI dropped to 46.7 last month October from 49.0 in September, which was the highest reading since November 2022. It was the 12th consecutive month that the PMI remained below 50, which indicates contraction in manufacturing. That is the longest such stretch since the 2007-2009 Great Recession. |
No 11 |
46.7 |
|
Oct-2023 |
|
| |
|
|
|
US manufacturing sector nears recovery; construction spending solid. The Manufacturing PMI registered 49 percent in September, 1.4 percentage points higher than the 47.6 percent recorded in August. The overall economy expanded weakly after nine months of contraction following a 30-month period of expansion. (A Manufacturing PMI above 48.7 percent, over a period of time, generally indicates an expansion of the overall economy.) The ISM said that its manufacturing PMI increased to 49.0 last month, the highest reading since November 2022, from 47.6 in August. Still, September marked the 11th straight month that the PMI remained below 50, which indicates contraction in manufacturing. That is the longest such stretch since the 2007-2009 Great Recession. Economists polled by Reuters had forecast the index edging up to 47.7. Last month's rise pulled the PMI above the 48.7 level that the ISM says over time indicates an expansion of the overall economy. Growth estimates for the third quarter are as high as a 4.9% annualized rate. The economy grew at a 2.1% pace in the April-June quarter. |
No 10 |
49.0 |
|
Sep-2023 |
|
| |
|
|
|
The ISM Manufacturing Index Increased to 47.6 in August 2023. To print this post click here. Implications: Activity in the US factory sector contracted for the tenth month in a row in August, though at a slightly slower pace. Looking at the details, only five of eighteen industries reported growth in August. The August Manufacturing PMI® registered 47.6 percent, 1.2 percentage points higher than the 46.4 percent recorded in July. Regarding the overall economy, this figure indicates a ninth month of contraction after a 30-month period of expansion. The New Orders Index remained in contraction territory at 46.8 percent, 0.5 percentage point lower than the figure of 47.3 percent recorded in July. |
No 9 |
47.6 |
|
Aug-2023 |
|
| |
|
|
|
The U.S. manufacturing sector contracted in July, as the Manufacturing PMI® registered 46.4 percent, 0.4 percentage point higher than the reading of 46 percent recorded in June. "This is the ninth month of contraction and continuation of a downward trend that began in June 2022. The latest Manufacturing ISM Report On Business for July 2023 reveals that economic activity in the manufacturing sector has continued to contract for the ninth consecutive month. This decline follows a 28-month period of growth, signifying a challenging time for the nation's supply executives. The Manufacturing PMI for July registered at 46.4%, a slight improvement from June's 46%. |
No 8 |
46.4 |
|
Jul-2023 |
|
| |
|
|
|
Economic activity in the manufacturing sector contracted in June for the eighth consecutive month following a 28-month period of growth. The June Manufacturing PMI® registered 46 percent, 0.9 percentage point lower than the 46.9 percent recorded in May. Regarding the overall economy, this figure indicates a seventh month of contraction after a 30-month period of expansion. The New Orders Index remained in contraction territory at 45.6 percent, 3 percentage points higher than the figure of 42.6 percent recorded in May. The Production Index reading of 46.7 percent is a 4.4-percentage point decrease compared to May's figure of 51.1 percent. |
No 7 |
46.0 |
|
Jun-2023 |
|
| |
|
|
|
The May Manufacturing PMI® registered 46.9 percent, 0.2 percentage point lower than the 47.1 percent recorded in April. Regarding the overall economy, this figure indicates a sixth month of contraction after a 30-month period of expansion. The New Orders Index remained in contraction territory at 42.6 percent, 3.1 percentage points lower than the figure of 45.7 percent recorded in April. The Production Index reading of 51.1 percent is a 2.2-percentage point increase compared to April's figure of 48.9 percent. The Prices Index registered 44.2 percent, down 9 percentage points compared to the April figure of 53.2 percent. |
No 6 |
46.9 |
|
May-2023 |
|
| |
|
|
|
The ISM said its manufacturing PMI increased to 47.1 last month from 46.3 in March, which was the lowest reading since May 2020. Economists polled by Reuters had forecast 46.8. It was the sixth straight month that the PMI remained below 50, which indicates contraction. And activity could remain subdued as the ISM noted that customers' inventory levels "are now at the low end of the 'too high' level," and "likely not conducive to future output growth." Manufacturing PMI rises to 47.1 in April ISM said 73% of manufacturing GDP contracting New orders improve moderately; prices paid pick up |
No 5 |
47.1 |
|
Apr-2023 |
|
| |
|
|
|
US manufacturing near three-year low; casts a shadow over economy. U.S. manufacturing activity slumped in March to the lowest level in nearly three years as new orders plunged, and analysts said activity could decline further due to tighter credit conditions. The Institute for Supply Management (ISM) survey on Monday showed all subcomponents of its manufacturing PMI below the 50 threshold for the first time since 2009. Some economists said this suggested a recession was around the corner, while others said much would depend on the services sector, whose PMI remains consistent with a growing economy. The survey made no direct comment on recent financial markets turmoil. Makers of miscellaneous products said they were "closely monitoring the global banking situation" but there were no impacts "at this time." The ISM's manufacturing PMI fell to 46.3 last month, the lowest level since May 2020, from 47.7 in February. Outside the COVID-19 pandemic, it was the weakest reading since mid-2009. |
No 4 |
46.3 |
|
Mar-2023 |
|
| |
|
|
|
The ISM's manufacturing PMI edged up to 47.7 last month from 47.4 in January 2023. The small rise was the first in six months. Economists polled by Reuters had forecast the index would increase to 48.0. A PMI reading below 50 indicates contraction in manufacturing, which accounts for 11.3% of the U.S. economy. U.S. manufacturing contracted for a fourth straight month in February, but there were signs that factory activity was starting to stabilize, with a measure of new orders pulling back from a more than 2-1/2-year low. The Institute for Supply Management survey on Wednesday also showed prices for raw materials increasing last month, which the ISM partly attributed to "a return to more balanced supplier-buyer relationships, as sellers are more interested in filling order books and buyers now see the need to reorder." The survey also hinted at buyer resistance to higher prices. Nevertheless, the rebound in prices at the factory gate suggests inflation could remain elevated for a while after monthly consumer and producer prices surged in January. |
No 3 |
47.7 |
|
Feb-2023 |
|
| |
|
|
|
A separate report from the Institute for Supply Management (ISM) on Wednesday showed its manufacturing PMI dropped to 47.4 in January 2023 from 48.4 in December 2023. The third straight monthly contraction pushed the index to the lowest level since May 2020 and below the 48.7 mark viewed as consistent with a recession in the broader economy.Manufacturing declined more than expected in January, ISM reading shows Manufacturing activity contracted again in January, even more than expected, according to the latest ISM survey.The manufacturing PMI for the month came in at 47.4%, representing the share of companies reporting expansion. That was below the 48.4% reading for December and less than the 48% Dow Jones estimate.Inventories and new orders registered monthly declines from December, while prices and new orders rose. |
No 2 |
47.4 |
|
Jan-2023 |
|
| |
|
|
|
U.S. manufacturing contracted further in December 2023, but weakening demand amid higher borrowing costs pushed a measure of prices paid by factories for inputs to the lowest level in more than 2-1/2 years, signaling that goods disinflation was underway. The Institute for Supply Management (ISM) said on Wednesday that its manufacturing PMI dropped to 48.4 last month from 49.0 in November 2022, contracting for a second straight month. That was the weakest reading since May 2020, when the economy was slammed by the first wave of COVID-19 cases, and pushed the index just below the 48.7 level, which the ISM says is consistent with a recession in the broader economy. But with the labor market still pumping out jobs at a solid clip and sustaining consumer spending, it is unlikely that the economy is in recession. A PMI reading below 50 indicates contraction in manufacturing, which accounts for 11.3% of the U.S. economy. Economists polled by Reuters had forecast the index slipping to 48.5. |
No 1 |
48.4 |
|
Dec-2022 |
|
| |
|
|
|
|
|
|
|
|
| |
|
|
|
|
|
| |
|
|
|
|
|
|
|
|
|
|
|
|
|
|
|
Brief News | 2022 |
|
|
ISM Manufacturing Index | Manufacturing |
|
Today's Week |
|
|
|
|
|
|
|
|
|
|
|
|
|
ISM Manufacturing Index (At 10:00 a.m ET)
| DATE/WEEK |
HIGHLIGHTS |
FOR |
ACTUAL |
|
The ISM Manufacturing Index registered a reading of 49%, representing the level of businesses reporting expansion for the period. The reading was 1.2 percentage points below October and the lowest since May 2020, in the early days of the Covid pandemic. Declines in order backlogs and imports were the biggest drags on the index. The closely watched prices index was off 3.6 points to 43%, indicating inflation is abating, while the employment index also receded, down 1.6 points to 48.4% an contraction territory. Markets were mostly lower following the morning’s data, with the Dow Jones Industrial Average down more than 250 points in early trading while the S&P 500 and Nasdaq Composite posted smaller losses. |
No12 |
49.0 |
|
Nov-2022 |
|
| |
|
|
|
In other economic news Tuesday, the ISM Manufacturing Index posted a 50.2 reading, representing the percent of companies reporting expansion for October. That was slightly better than the Dow Jones estimate for 50.0 but 0.9 percentage points lower than September. One good piece of news from the ISM data: The prices index fell another 5.1 points to a 46.6 reading, indicating a lessening of inflation pressures. Order backlogs also declined, falling 5.6 points to a 45.3 reading, while supplier deliveries fell 5.6 points to 46.8 and employment edged higher to 50. Meanwhile, the ISM manufacturing PMI will show whether factory activity has increased or decreased throughout October. September’s figures suggested the sector was close to contracting and reflected the slowest growth levels since 2020. |
No 11 |
50.2 |
|
Oct-2022 |
|
| |
|
|
|
ISM Manufacturing Index shows U.S. manufacturing expansion slowed in September 2022. September ISM Manufacturing PMI: 50.9 vs. 52.4 expected and 52.8 prior. With the index still, above 50, the U.S. manufacturing sector continued to expand in September, but the pace was the slowest since the pandemic recovery began, the Institute for Supply Management said.U.S. manufacturing activity grew at its slowest pace in nearly 2-1/2 years in September as new orders contracted amid aggressive interest rate increases from the Federal Reserve to cool demand and tame inflation |
No 10 |
52.8 |
|
Sep-2022 |
|
| |
|
|
|
U.S. manufacturing grew steadily in August as employment and new orders rebounded, while a further easing in price pressures strengthened expectations that inflation has likely peaked. The Institute for Supply Management (ISM) said on Thursday that its manufacturing PMI was at 52.8 last month, unchanged from July. A reading above 50 indicates expansion in manufacturing, which accounts for 11.9% of the U.S. economy. Economists polled by Reuters had forecast the index falling to 52.0. Manufacturing is showing resilience despite a shift in spending back to services as well as an ebb in business confidence amid rapidly rising interest rates, which have increased the risk of a recession. The Federal Reserve has hiked its policy rate by 225 basis points since March to tame inflation. The ISM survey's forward-looking new orders sub-index rebounded to 51.3 last month from a reading of 48.0 in July. That ended two straight monthly decreases. Order backlogs rose, suggesting factories will continue humming for a while. |
No 9 |
52.8 |
|
Aug-2022 |
|
| |
|
|
|
The July Manufacturing PMI® registered 52.8 percent, down 0.2 percentage point from the reading of 53 percent in June. This figure indicates expansion in the overall economy for the 26th month in a row after a contraction in April and May 2020. This is the lowest Manufacturing PMI® figure since June 2020, when it registered 52.4 percent. |
No 8 |
52.8 |
|
Jul-2022 |
|
| |
|
|
|
U.S. factory activity slows to two-year low as clouds gather over economy. U.S. manufacturing activity slowed more than expected in June, with a measure of new orders contracting for the first time in two years, signs that the economy was cooling amid aggressive monetary policy tightening by the Federal Reserve. ISM manufacturing index falls 3.1 points to 53.0 in June. New orders, employment measures contract Construction spending dips 0.1% in May. |
No 7 |
53.0 |
|
Jun-2022 |
|
| |
|
|
|
Manufacturing PMI at 56.1%; May 2022 Manufacturing ISM Report On Business. Economic activity in the manufacturing sector grew in May, with the overall economy achieving a 24th consecutive month of growth, say the nation's supply executives in the latest Manufacturing ISM Report On Business. The May Manufacturing PMI® registered 56.1 percent, an increase of 0.7 percentage point from the reading of 55.4 percent in April. This figure indicates expansion in the overall economy for the 24th month in a row after a contraction in April and May 2020. This is the second-lowest Manufacturing PMI® reading since September 2020, when it registered 55.4 percent. |
No 6 |
56.1 |
|
May-2022 |
|
| |
|
|
|
The ISM's index of national factory activity fell to a reading of 55.4 last month, the lowest since a matching reading in September 2020, from 57.1 in March. The last time the index was lower was in July 2020. A reading above 50 indicates expansion in manufacturing, which accounts for 12% of the U.S. economy. Economists polled by Reuters had forecast the index rising to 57.6. The second straight monthly decline in the index also reflects spending rotating back to services like travel, dining out and recreation. Government data on Friday showed consumer spending on services increasing by the most in eight months in March, while outlays on long-lasting manufactured goods dropped for a second consecutive month. |
No 5 |
55.4 |
|
Apr-2022 |
|
| |
|
|
|
Gold edged down as the headline manufacturing index from the Institute for Supply Management disappointed in March. The precious metal remained focused on rising bond yields. The ISM manufacturing index was at 57.1% last month versus the consensus forecast of 59%. The monthly figure also marked a 1.5 percentage-point increase from February’s reading of 58.6%. “This figure indicates expansion in the overall economy for the 22nd month in a row after a contraction in April and May 2020. This is the lowest reading since September 2020 (55.4 percent),” the report said.The U.S. March 2022 ISM factory index dropped to its lowest level since Sept. 2020. February 2022 construction spending data and March manufacturing data from ISM coming in below expectations.
|
No 4 |
57.1 |
|
Mar-2022 |
|
| |
|
|
|
Manufacturing PMI at 58.6%; February 2022 Manufacturing ISM Report On Business. The February Manufacturing PMI registered 58.6 percent, an increase of 1 percentage point from the January reading of 57.6 percent. This figure indicates expansion in the overall economy for the 21st month in a row after a contraction in April and May 2020. The New Orders Index registered 61.7 percent, up 3.8 percentage points compared to the January reading of 57.9 percent. The Production Index registered 58.5 percent, an increase of 0.7 percentage point compared to the January reading of 57.8 percent. |
No 3 |
58.6 |
|
Feb-2022 |
|
| |
|
|
|
The Institute for Supply Management Purchasing Managers’ Index, or PMI, came in at 57.6 for January 2022, down from 58.8 in December. Economists projected a reading of 57.5. The number is right in line with expectations. A reading of 50 indicates the manufacturing sector is growing, so the figure is a solid one. New orders, an indication of future demand, came in at 57.9, higher than the overall result but down from 62.1 in the previous month. |
No 2 |
57.6 |
|
Jan-2022 |
|
| |
|
|
|
The December 2021 Manufacturing PMI registered 58.7 percent, a decrease of 2.4 percentage points from the November reading of 61.1 percent. This figure indicates expansion in the overall economy for the 19th month in a row after a contraction in April 2020.The Institute for Supply Management’s (ISM) December manufacturing purchasing managers index slid to 58.7% in November from 61.1% in November. A number over 50 means the manufacturing sector is expanding, which it did for the 19th month in a row since April 2020. |
No 1 |
58.7 |
|
Dec-2021 |
|
| |
|
|
|
|
|
|
|
|
| |
|
|
|
|
|
| |
|
|
|
|
|
|
|
|
|
|
|
|
|
|
|
Brief News | 2021 |
|
|
ISM Manufacturing Index | Manufacturing |
|
Today's Week |
|
|
|
|
|
|
|
|
|
|
|
|
|
ISM Manufacturing Index (At 10:00 a.m ET)
| DATE/WEEK |
HIGHLIGHTS |
FOR |
ACTUAL |
|
Manufacturing PMI at 61.1%; November 2021 Manufacturing ISM Report On Business. The November Manufacturing PMI® registered 61.1 percent, an increase of 0.3 percentage point from the October reading of 60.8 percent. This figure indicates expansion in the overall economy for the 18th month in a row after a contraction in April 2020. The New Orders Index registered 61.5 percent, up 1.7 percentage points compared to the October reading of 59.8 percent. |
No 12 |
61.1 |
|
Nov-2021 |
|
| |
|
|
|
Manufacturing PMI at 60.8%, October 2021 Manufacturing ISM Report On Business. he October Manufacturing PMI® registered 60.8 percent, a decrease of 0.3 percentage point from the September reading of 61.1 percent. This figure indicates expansion in the overall economy for the 17th month in a row after a contraction in April 2020. The New Orders Index registered 59.8 percent, down 6.9 percentage points compared to the September reading of 66.7 percent. |
No 11 |
60.8 |
|
Oct-2021 |
|
| |
|
|
|
The ISM Manufacturing index for September 2021 registered a 61.1 reading, representing the percentage of companies seeing expansion. Anything above 50 represents growth; the Dow Jones estimate was 59.5. The survey also showed prices rising, with 81.2% of respondents reporting increases against 79.4% in August. Order backlogs decreased to 64.8, a drop of 3.4 points from a month ago, but companies overall were still reporting delays. “Supply chain concerns are growing beyond electronics and chips into most other commodities. |
No 10 |
61.1 |
|
Sep-2021 |
|
| |
|
|
|
Manufacturing PMI at 59.9%; August 2021 Manufacturing ISM Report On Business. The August Manufacturing PMI® registered 59.9 percent, an increase of 0.4 percentage point from the July reading of 59.5 percent. This figure indicates expansion in the overall economy for the 15th month in a row after contraction in April 2020. The New Orders Index registered 66.7 percent, increasing 1.8 percentage points from the July reading of 64.9 percent. The Production Index registered 60 percent, an increase of 1.6 percentage points compared to the July reading of 58.4 percent. The Prices Index registered 79.4 percent, down 6.3 percentage points compared to the July figure of 85.7 percent; this is its first reading below 80 percent since December 2020 (77.6 percent). |
No 9 |
59.9 |
|
Aug-2021 |
|
| |
|
|
|
Manufacturing grew in July, as the Manufacturing PMI registered 59.5 percent, 1.1 percentage points lower than the June reading of 60.6 percent. “The Manufacturing PMI® continued to indicate strong sector expansion and U.S. economic growth in July. Four out of five subindexes that directly factor into the Manufacturing PMI® were in growth territory. |
No 8 |
59.5 |
|
Jul-2021 |
|
| |
|
|
|
Manufacturing grew in June, as the Manufacturing PMI registered 60.6 percent, 0.6 percentage point lower than the May reading of 61.2 percent. “The Manufacturing PMI® continued to indicate strong sector expansion and U.S. economic growth in June. Four out of five subindexes that directly factor into the Manufacturing PMI® were in growth territory. |
No 7 |
60.6 |
|
Jun-2021 |
|
| |
|
|
|
Manufacturing PMI at 61.2%; May 2021 Manufacturing ISM Report On Business. The May Manufacturing PMI® registered 61.2 percent, an increase of 0.5 percentage point from the April reading of 60.7 percent. This figure indicates expansion in the overall economy for the 12th month in a row after contraction in April 2020. The New Orders Index registered 67 percent, increasing 2.7 percentage points from the April reading of 64.3 percent. The Production Index registered 58.5 percent, a decrease of 4 percentage points compared to the April reading of 62.5 percent. |
No 6 |
61.2 |
|
May-2021 |
|
| |
|
|
|
The April Manufacturing PMI® registered 60.7 percent, a decrease of 4 percentage points from the March reading of 64.7 percent. This figure indicates expansion in the overall economy for the 11th month in a row after contraction in April 2020. April ISM manufacturing index misses expectations at 60.7.The decline was a moderate surprise, as the consensus forecast had called for a slight uptick to 65.0. |
No 5 |
60.7 |
|
Apr-2021 |
|
| |
|
|
|
A measure of U.S. manufacturing activity soared to its highest level in more than 37 years in March, driven by strong growth in new orders, the clearest sign yet that a much anticipated economic boom was probably underway. The Institute for Supply Management (ISM) said on Thursday its index of national factory activity jumped to a reading of 64.7 last month from 60.8 in February. That was the highest level since December 1983. A reading above 50 indicates expansion in manufacturing, which accounts for 11.9% of the U.S. economy. Economists polled by Reuters had forecast the index rising to 61.3 in March. |
No 4 |
64.7 |
|
Mar-2021 |
|
| |
|
|
|
Manufacturing sector activity surged in February 2021 by the most in three years: ISM
Activity in the domestic manufacturing sector jumped by the most in three years, boosted by a rise in prices paid for raw materials.
The Institute for Supply Management's (ISM) manufacturing index jumped to a reading of 60.8 in February from 58.7 in January. Consensus economists were looking for a tick higher to just 58.9, according to Bloomberg consensus data. |
No 3 |
60.8 |
|
Feb-2021 |
|
| |
|
|
|
The January Manufacturing PMI registered 58.7 percent, down 1.8 percentage points from the seasonally adjusted December reading of 60.5 percent. This figure indicates expansion in the overall economy for the eighth month in a row after contraction in March, April, and May. The New Orders Index registered 61.1 percent, down 6.4 percentage points from the seasonally adjusted December reading of 67.5 percent. The Production Index registered 60.7 percent, a decrease of 4 percentage points compared to the seasonally adjusted December reading of 64.7 percent. |
No 2 |
58.7 |
|
Jan-2021 |
|
| |
|
|
|
The December 2020 Manufacturing PMI registered 60.7 percent, up 3.2 percentage points from the November reading of 57.5 percent. This figure indicates expansion in the overall economy for the eighth month in a row after contracting in March, April, and May, which ended a period of 131 consecutive months of growth. The New Orders Index registered 67.9 percent, up 2.8 percentage points from the November reading of 65.1 percent, |
No 1 |
60.7 |
|
Dec-2020 |
|
| |
|
|
|
|
|
|
|
|
| |
|
|
|
|
|
| |
|
Legends: |
|
Delayed |
|
Positive View |
|
Negative View |
|
Neutral View |
|
Non Available |
|
|
|
|
|
|
|
|
|
|
|
|
|
|
|
|
|
|
|
|
| |
|
|
|
|
|
|
|
|
|
|
|
|
|
|
|
|
|
|
|
|
|
Definitions | Explain |
|
|
ISM Manufacturing Index | Manufacturing |
|
Today's Week |
|
|
|
|
|
|
|
|
|
|
|
|
| |
|
|
|
|
|
| ISM Index |
What is the ISM Mfg Index?
The Manufacturing ISM Report On Business and the Non-Manufacturing ISM Report On Business gather data on a monthly basis through surveys of supply management professionals participating in the Business Survey Committee.
The make-up of this committee is determined by industry category and is based on each industry's contribution to Gross Domestic Product.
The Institute of Supply Chain Management sends out surveys every month based on the following 10 subindices:
- New Orders
- Production
- Employment
- Supplier Deliveries
- Inventories
- Customers' Inventories
- Prices
- Backlog of Orders
- Exports
- Imports
The production index is used to help predict industrial production.
The prices index is used to help predict the Producer Price Index.
The new orders index is used to help predict factory orders.
The employment index is used to help predict manufacturing employment.
The supplier deliveries index is a component of the leading economic indicators index.
|
|
|
|
| ISM MANUFACTURING INDEX |
How to interpret the Chart?
Generally, an ISM value of 50 is considered neutral, a value of over 50 points as an expansion of the manufacturing sector and a value of less than 50 points a decline in industrial production views. In other words, a ISM Manufacturing Index above 50% indicates that the manufacturing economy is generally expanding; below 50% that it is generally declining. Any level below 43 indicates that the economy is in recession.
Stock Market Impact
When this index is increasing, investors can assume that the stock markets should increase because of higher corporate profits. New orders, the most important detail in the report.
Bond Market Impact
The opposite can be thought of the bond markets, which may decrease as the ISM Manufacturing Index increases because of sensitivity to potential inflation.
Why Investors should follow this report
By monitoring the ISM Manufacturing Index, investors are able to better understand national economic conditions.
Revisions
The ISM manufacturing index is available very early in the month and not subject to revision. The ISM Mfg index is a big mood-setter for the market and has an average lead before the actual industrial production three to six months.
Seasonal Adjustment
The ISM Mfg index is Seasonally Adjusted so the values of neighboring months are usually easier to compare. When seasonal adjustment is not done with monthly data, year-on-year changes are utilised in an attempt to avoid contamination with seasonality.
Manufacturing Category
This report has a big influence on the markets by providing important data to the Manufacturing Sector which is a major source of cyclical variability in the economy.
For example: A wider gap between New Orders and Inventories is a decent leading indicator for further production gains.
Market Importance
High. Nearly always moves markets. Extremely timely -- and this is the king of all manufacturing indices. Considered the single best snapshot of the condition of the factory sector.
A limitation of the survey is that it doesn't include any questions on wages, which is an important component of overall costs.
The survey is sent towards the people who have the power to buy stuff and hire people so they have to answer a few simple questions.
How to Invest in Manufaturing?
The following ETFs give ample exposure to other companies which are likely to reap the benefits of increased manufacturing
1) iShares Dow Jones US Industrials (IYJ)
2) Industrials SPDR (XLI) |
|
|
| |
|
|
|
|
|
|
|
|
|
|
|
|
|
|
|
|
|
|
|
|
|
Data | Source |
|
|
ISM Manufacturing Index | Manufacturing |
|
Today's Week |
|
|
|
|
|
|
|
|
|
|
|
|
| |
|
|
|
|
|
|
| DATA INFORMATION |
ISM MANUFACTURING INDEX |
| SOURCE |
Institute for Supply Management. |
| WEB |
www.ism.ws |
| FREQUENCY |
Monthly |
| AVAILABILITY |
The first business day of the month. |
| COVERAGE |
Data are for the previous month. Data for June are released in July. |
| REVISIONS |
Yes |
| IMPORTANCE |
Manufacturing - Very Important |
|
| |
|
|
|
|
|
|
|
|
|
|
|
|