 |
 |
|
 |
Real GDP | Growth |
|
 |
|
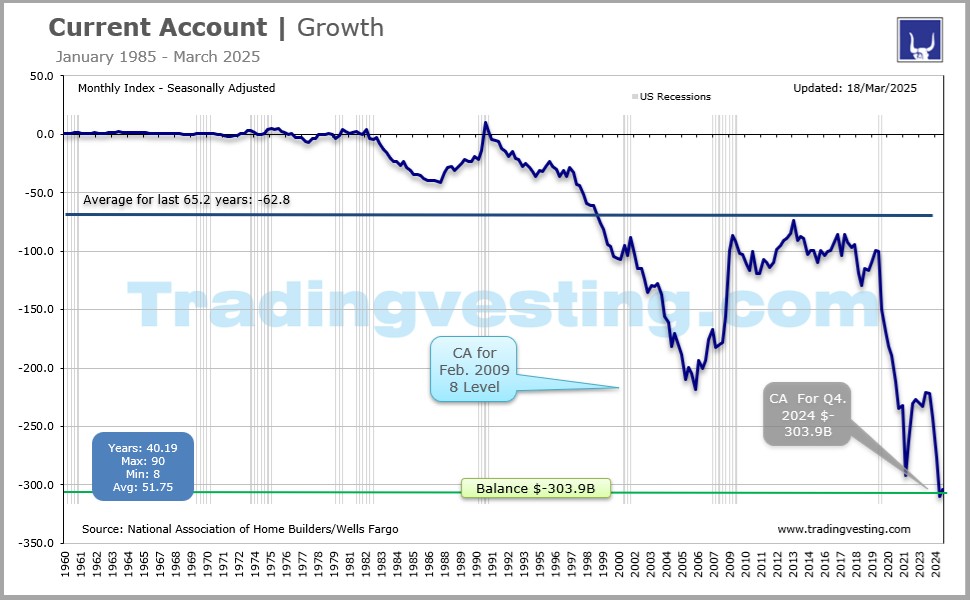
Gross Domestic Product (GDP) measures how much the economy has grown over a three-month period. Real GDP (inflation-adjusted) growth is always quoted at a quarterly annual rate (three-month period)..→ Read more
|
|
|
|
|
|
|
| |
|
| |
 1. Real GDP (1 of 6) 1. Real GDP (1 of 6) 2. US Trade Balance (2 of 6) 2. US Trade Balance (2 of 6) 3. US Trade in Goods (3 of 6) 3. US Trade in Goods (3 of 6) 4. Construction Spending (4 of 6) 4. Construction Spending (4 of 6) 5. Corporate Profit (5 of 6) 5. Corporate Profit (5 of 6) 6. Current Account (6 of 6) 6. Current Account (6 of 6)
|
 |
|
|
|
|
| |
|
→ Big Chart |
|
→ Release |
|
|
| |
|
|
|
|
|
|
|
|
|
|
|
|
|
| |
|
|
|
|
|
|
|
|
|
|
|
|
|
| |
|
|
|
|
|
|
|
|
|
|
|
|
Real GDP (At 8:30 a.m ET)
| RELEASE 2026 |
No 1 |
No 2 |
No 3 |
No 4 |
No 5 |
No 6 |
No 7 |
No 8 |
No 9 |
No 10 |
No 11 |
No 12 |
| Release | Week |
|
|
|
|
|
|
|
|
|
|
|
|
| Release | Date |
|
|
|
|
|
|
|
|
|
|
|
|
| Release | Day |
|
|
|
|
|
|
|
|
|
|
|
|
 |
|
|
|
|
|
|
|
|
|
|
|
|
| Prior |
4.4% |
1.4% |
0.7% |
0.5% |
2.0% |
... |
... |
... |
... |
... |
... |
... |
| Prior Revised |
... |
... |
... |
... |
... |
... |
... |
... |
... |
... |
... |
... |
| CONSENSUS |
2.8% |
1.4% |
0.7% |
2.1% |
2.1% |
... |
... |
... |
... |
... |
... |
... |
| Consensus Low |
1.7% |
1.3% |
0.6% |
1.0% |
1.9% |
... |
... |
... |
... |
... |
... |
... |
| Consensus High |
3.6% |
1.5% |
1.4% |
2.8% |
2.2% |
... |
... |
... |
... |
... |
... |
... |
| REAL GDP |
1.4% |
0.7% |
0.5% |
2.0% |
1.6% |
... |
... |
... |
... |
... |
... |
... |
| Type |
Advn |
Prelim |
FINAL |
Advn |
Prelim |
FINAL |
Advn |
Prelim |
FINAL |
Advn |
Prelim |
FINAL |
| RATING |
|
|
|
|
|
|
|
|
|
|
|
|
| Quarter for |
Q4-2025 |
Q4-2025 |
Q4-2025 |
Q1-2026 |
Q1-2026 |
Q1-2026 |
Q2-2026 |
Q2-2026 |
Q2-2026 |
Q3-2026 |
Q3-2026 |
Q3-2026 |
|
|
|
|
|
|
|
|
|
|
|
|
|
| PCE Annual Rate |
No 1 |
No 2 |
No 3 |
No 4 |
No 5 |
No 6 |
No 7 |
No 8 |
No 9 |
No 10 |
No 11 |
No 12 |
| Prior |
3.5% |
2.4% |
2.0% |
1.9% |
1.6% |
... |
... |
... |
... |
... |
... |
... |
| Prior Revised |
... |
... |
... |
... |
... |
... |
... |
... |
... |
... |
... |
... |
| PCE Consensus |
2.4% |
... |
... |
1.5% |
1.7% |
... |
... |
... |
... |
... |
... |
... |
| PCE Low |
2.4% |
.... |
... |
1.0% |
1.6% |
... |
... |
... |
... |
... |
... |
... |
| PCE High |
2.7% |
... |
... |
1.6% |
1.7% |
... |
... |
... |
... |
... |
... |
... |
| PCE Annual Rate |
2.4% |
2.0% |
1.9% |
1.6% |
1.4% |
... |
... |
... |
... |
... |
... |
... |
| Type |
Advn |
Prelim |
FINAL |
Advn |
Prelim |
FINAL |
Advn |
Prelim |
FINAL |
Advn |
Prelim |
FINAL |
| Quarter for |
Q4-2025 |
Q4-2025 |
Q4-2025 |
Q1-2026 |
Q1-2026 |
Q1-2026 |
Q2-2026 |
Q2-2026 |
Q2-2026 |
Q3-2026 |
Q3-2026 |
Q3-2026 |
|
|
| |
|
| |
|
|
Real GDP (At 8:30 a.m ET)
| SCHEDULE 2025 |
No 1 |
No 2 |
No 3 |
No 4 |
No 5 |
No 6 |
No 7 |
No 8 |
No 9 |
No 10 |
No 11 |
No 12 |
| Release | Week |
|
|
|
|
|
|
|
|
|
|
|
|
| Release | Date |
|
|
|
|
|
|
|
|
|
|
|
|
| Release | Day |
|
|
|
|
|
|
|
|
|
|
|
|
|
|
|
|
|
|
|
|
|
|
|
|
|
| Prior |
3.1% |
2.3% |
2.3% |
2.4% |
-0.3% |
-0.2% |
-0.5% |
3.0% |
3.3% |
... |
... |
4.3% |
| Prior Revised |
... |
... |
... |
... |
... |
... |
... |
... |
... |
... |
3.8% |
... |
| CONSENSUS |
2.6% |
2.3% |
2.4% |
0.2% |
-0.3% |
-0.2% |
2.5% |
3.1% |
3.3% |
... |
3.2% |
4.3% |
| Consensus Low |
2.2% |
2.3% |
2.2% |
-1.5% |
-0.5% |
-0.2% |
0.8% |
3.0% |
3.3% |
... |
2.5% |
4.3% |
| Consensus High |
3.0% |
2.8% |
2.5% |
1.1% |
0.0% |
-0.1% |
3.8% |
3.2% |
3.5% |
... |
3.8% |
4.4% |
| REAL GDP |
2.3% |
2.3% |
2.4% |
-0.3% |
-0.2% |
-0.5% |
3.0% |
3.3% |
3.8% |
... |
4.3% |
4.4% |
| Type |
Advn |
Prelim |
FINAL |
Advn |
Prelim |
FINAL |
Advn |
Prelim |
FINAL |
.. |
Adv |
FINAL |
| RATING |
|
|
|
|
|
|
|
|
|
|
|
|
| Quarter for |
Q4-2024 |
Q4-2024 |
Q4-2024 |
Q1-2025 |
Q1-2025 |
Q1-2025 |
Q2-2025 |
Q2-2025 |
Q2-2025 |
Q3-2025 |
Q3-2025 |
Q3-2025 |
|
|
|
|
|
|
|
|
|
|
|
|
|
| PCE Annual Rate |
No 1 |
No 2 |
No 3 |
No 4 |
No 5 |
No 6 |
No 7 |
No 8 |
No 9 |
No 10 |
No 11 |
No 12 |
| Prior |
3.7% |
4.2% |
4.2% |
4.0% |
1.8% |
1.2% |
0.5% |
1.4% |
1.6% |
... |
... |
3.5% |
| Prior Revised |
... |
... |
... |
... |
... |
... |
... |
... |
... |
... |
2.5% |
... |
| PCE Consensus |
3.1% |
4.2% |
4.2% |
... |
1.8% |
... |
1.4% |
1.4% |
... |
... |
2.7% |
3.5% |
| PCE Low |
2.9% |
4.2% |
4.2% |
... |
1.6% |
... |
0.9% |
1.4% |
... |
... |
2.7% |
3.5% |
| PCE High |
3.7% |
4.2% |
4.2% |
... |
1.8% |
... |
1.9% |
1.5% |
... |
... |
3.1% |
3.6% |
| PCE Annual Rate |
4.2% |
4.2% |
4.0% |
1.8% |
1.2% |
0.5% |
1.4% |
1.6% |
2.5% |
... |
3.5% |
3.5% |
| Type |
Advn |
Prelim |
FINAL |
Advn |
Prelim |
FINAL |
Advn |
Prelim |
FINAL |
... |
Advn |
FINAL |
| Quarter for |
Q4-2024 |
Q4-2024 |
Q4-2024 |
Q1-2025 |
Q1-2025 |
Q1-2025 |
Q2-2025 |
Q2-2025 |
Q2-2025 |
Q3-2025 |
Q3-2025 |
Q3-2025 |
|
|
| |
|
| |
|
|
Real GDP (At 8:30 a.m ET)
| SCHEDULE 2024 |
No 1 |
No 2 |
No 3 |
No 4 |
No 5 |
No 6 |
No 7 |
No 8 |
No 9 |
No 10 |
No 11 |
No 12 |
| Release | Week |
|
|
|
|
|
|
|
|
|
|
|
|
| Release | Date |
|
|
|
|
|
|
|
|
|
|
|
|
| Release | Day |
|
|
|
|
|
|
|
|
|
|
|
|
|
|
|
|
|
|
|
|
|
|
|
|
|
| Prior |
4.9% |
3.3% |
3.2% |
3.4% |
1.6% |
1.3% |
1.4% |
2.8% |
3.0% |
3.0% |
2.8% |
2.8% |
| Prior Revised |
... |
... |
... |
... |
... |
... |
... |
... |
... |
... |
... |
... |
| CONSENSUS |
2.0% |
3.3% |
3.2% |
2.3% |
1.5% |
1.4% |
2.0% |
2.8% |
3.0% |
3.0% |
2.8% |
2.8% |
| Consensus Low |
1.3% |
3.2% |
3.1% |
1.7% |
1.2% |
1.3% |
1.2% |
2.6% |
2.9% |
2.1% |
2.8% |
2.8% |
| Consensus High |
2.5% |
3.4% |
3.5% |
2.8% |
1.6% |
1.5% |
2.5% |
2.9% |
3.0% |
3.5% |
2.9% |
3.0% |
| REAL GDP |
3.3% |
3.2% |
3.4% |
1.6% |
1.3% |
1.4% |
2.8% |
3.0% |
3.0% |
2.8% |
2.8% |
3.1% |
| Type |
Advn |
Prelim |
FINAL |
Advn |
Prelim |
FINAL |
Advn |
Prelim |
FINAL |
Advn |
Prelim |
FINAL |
| RATING |
|
|
|
|
|
|
|
|
|
|
|
|
| Quarter for |
Q4-2023 |
Q4-2023 |
Q4-2023 |
Q1-2024 |
Q1-2024 |
Q1-2024 |
Q2-2024 |
Q2-2024 |
Q2-2024 |
Q3-2024 |
Q3-2024 |
Q3-2024 |
|
|
|
|
|
|
|
|
|
|
|
|
|
| PCE Annual Rate |
No 1 |
No 2 |
No 3 |
No 4 |
No 5 |
No 6 |
No 7 |
No 8 |
No 9 |
No 10 |
No 11 |
No 12 |
| Prior |
3.1% |
2.8% |
3.0% |
3.3% |
2.5% |
2.0% |
1.5% |
2.3% |
2.9% |
2.8% |
3.7% |
3.5% |
| Prior Revised |
... |
... |
... |
... |
... |
... |
... |
... |
... |
... |
... |
... |
| PCE Consensus |
2.5% |
2.8% |
3.0% |
2.8% |
2.2% |
2.0% |
1.9% |
2.3% |
2.9% |
3.0% |
3.7% |
3.5% |
| PCE Low |
2.4% |
2.8% |
3.0% |
2.6% |
2.2% |
2.0% |
1.6% |
2.3% |
2.9% |
2.0% |
3.7% |
3.5% |
| PCE High |
2.6% |
2.8% |
3.5% |
3.0% |
2.5% |
2.0% |
2.2% |
2.4% |
2.9% |
3.6% |
3.7% |
3.7% |
| PCE Annual Rate |
2.8% |
3.0% |
3.3% |
2.5% |
2.0% |
1.5% |
2.3% |
2.9% |
2.8% |
3.7% |
3.5% |
3.7% |
| Type |
Advn |
Prelim |
FINAL |
Advn |
Prelim |
FINAL |
Advn |
Prelim |
FINAL |
Advn |
Prelim |
FINAL |
| Quarter for |
Q4-2023 |
Q4-2023 |
Q4-2023 |
Q1-2024 |
Q1-2024 |
Q1-2024 |
Q2-2024 |
Q2-2024 |
Q2-2024 |
Q3-2024 |
Q3-2024 |
Q3-2024 |
|
|
| |
|
| |
|
|
Real GDP (At 8:30 a.m ET)
| SCHEDULE 2023 |
No 1 |
No 2 |
No 3 |
No 4 |
No 5 |
No 6 |
No 7 |
No 8 |
No 9 |
No 10 |
No 11 |
No 12 |
| Release | Week |
|
|
|
|
|
|
|
|
|
|
|
|
| Release | Date |
|
|
|
|
|
|
|
|
|
|
|
|
| Release | Day |
|
|
|
|
|
|
|
|
|
|
|
|
|
|
|
|
|
|
|
|
|
|
|
|
|
| Prior |
3.2% |
2.9% |
2.7% |
2.6% |
1.1% |
1.3% |
2.0% |
2.4% |
2.1% |
2.1% |
4.9% |
5.2% |
| Prior Revised |
... |
... |
... |
... |
... |
... |
... |
... |
... |
... |
... |
... |
| CONSENSUS |
2.7% |
2.9% |
2.7% |
2.0% |
1.1% |
1.4% |
1.5% |
2.4% |
2.3% |
4.2% |
4.9% |
5.2% |
| Consensus Low |
1.2% |
2.5% |
2.7% |
1.3% |
1.0% |
1.3% |
0.3% |
2.4% |
2.1% |
2.8% |
4.9% |
5.0% |
| Consensus High |
3.5% |
3.9% |
3.0% |
3.3% |
1.1% |
2.0% |
2.2% |
2.5% |
2.4% |
6.0% |
5.1% |
5.2% |
| REAL GDP |
2.9% |
2.7% |
2.6% |
1.1% |
1.3% |
2.0% |
2.4% |
2.1% |
2.1% |
4.9% |
5.2% |
4.9% |
| Type |
Advn |
Prelim |
FINAL |
Advn |
Prelim |
FINAL |
Advn |
Prelim |
FINAL |
Advn |
Prelim |
FINAL |
| RATING |
|
|
|
|
|
|
|
|
|
|
|
|
| Quarter for |
Q4-2022 |
Q4-2022 |
Q4-2022 |
Q1-2023 |
Q1-2023 |
Q1-2023 |
Q2-2023 |
Q2-2023 |
Q2-2023 |
Q3-2023 |
Q3-2023 |
Q3-2023 |
| PCE Annual Rate |
No 1 |
No 2 |
No 3 |
No 4 |
No 5 |
No 6 |
No 7 |
No 8 |
No 9 |
No 10 |
No 11 |
No 12 |
| Prior |
2.3% |
2.1% |
1.4% |
1.0% |
3.7% |
3.8% |
4.2% |
1.6% |
1.7% |
0.8% |
4.0% |
3.6% |
| Prior Revised |
... |
... |
... |
... |
... |
... |
... |
... |
... |
... |
... |
... |
| CONSENSUS PCE |
2.6% |
2.0% |
1.4% |
... |
3.7% |
3.8% |
1.5% |
1.7% |
1.7% |
4.1% |
4.0% |
3.6% |
| PCE Low |
1.9% |
1.9% |
1.4% |
... |
3.7% |
3.5% |
1.1% |
1.6% |
1.7% |
3.7% |
4.0% |
3.2% |
| PCE High |
2.7% |
2.1% |
1.6% |
... |
3.8% |
4.0% |
4.1% |
1.9% |
1.7% |
4.3% |
4.1% |
3.7% |
| PCE Annual Rate |
2.1% |
1.4% |
1.0% |
3.7% |
3.8% |
4.2% |
1.6% |
1.7% |
0.8% |
4.0% |
3.6% |
3.1% |
| Type |
Advn |
Prelim |
FINAL |
Advn |
Prelim |
FINAL |
Advn |
Prelim |
FINAL |
Advn |
Prelim |
FINAL |
| Quarter for |
Q4-2022 |
Q4-2022 |
Q4-2022 |
Q1-2023 |
Q1-2023 |
Q1-2023 |
Q2-2023 |
Q2-2023 |
Q2-2023 |
Q3-2023 |
Q3-2023 |
Q3-2023 |
|
|
|
|
|
|
|
|
|
|
|
|
|
|
|
| |
|
| |
|
|
Real GDP (At 8:30 a.m ET)
| SCHEDULE 2022 |
No 1 |
No 2 |
No 3 |
No 4 |
No 5 |
No 6 |
No 7 |
No 8 |
No 9 |
No 10 |
No 11 |
No 12 |
| Release | Week |
|
|
|
|
|
|
|
|
|
|
|
|
| Release | Date |
|
|
|
|
|
|
|
|
|
|
|
|
| Release | Day |
|
|
|
|
|
|
|
|
|
|
|
|
|
|
|
|
|
|
|
|
|
|
|
|
|
| Prior |
2.3% |
6.9% |
7.0% |
6.9% |
-1.4% |
-1.5% |
-1.6% |
-0.9% |
-0.6% |
-0.6% |
2.6% |
2.9% |
| Prior Revised |
.. |
2.3% |
... |
... |
... |
... |
... |
... |
... |
... |
... |
... |
| CONSENSUS |
5.7% |
7.0% |
7.1% |
1.1% |
-1.3% |
-1.4% |
-0.5% |
-0.9% |
-0.6% |
2.3% |
2.7% |
2.9% |
| Consensus Low |
3.7% |
6.0% |
7.0% |
0.2% |
-1.5% |
-1.5% |
-1.1% |
-0.9% |
-0.7% |
1.4% |
2.5% |
2.6% |
| Consensus High |
7.1% |
7.4% |
7.2% |
1.9% |
-1.2% |
-1.3% |
1.5% |
-0.2% |
-0.5% |
3.1% |
3.5% |
3.0% |
| REAL GDP |
6.9% |
7.0% |
6.9% |
-1.4% |
-1.5% |
-1.6% |
-0.9% |
-0.6% |
-0.6% |
2.6% |
2.9% |
3.2% |
|
|
|
|
|
|
|
|
|
|
|
|
|
| Prior |
2.3% |
3.3% |
3.1% |
2.5% |
2.5% |
3.1% |
1.8% |
1.0% |
1.5% |
2.0% |
1.4% |
1.7% |
| Prior Revised |
2.3% |
2.0% |
3.2% |
4.5% |
5.0% |
3.1% |
1.6% |
... |
1.3% |
0.8% |
... |
.... |
| CONSENSUS |
3.0% |
3.2% |
3.1% |
3.4% |
2.7% |
3.1% |
1.3% |
... |
1.5% |
0.8% |
1.5% |
1.7% |
| PCE Annual Rate |
3.3% |
3.1% |
2.5% |
2.5% |
3.1% |
1.8% |
1.0% |
1.5% |
2.0% |
1.4% |
1.7% |
2.3% |
| RATING |
|
|
|
|
|
|
|
|
|
|
|
|
| Quarter for |
Q4-2021 |
Q4-2021 |
Q4-2021 |
Q1-2022 |
Q1-2022 |
Q1-2022 |
Q2-2022 |
Q2-2022 |
Q2-2022 |
Q3-2022 |
Q3-2022 |
Q3-2022 |
| Type |
Advn |
Prelim |
FINAL |
Advn |
Prelim |
FINAL |
Advn |
Prelim |
FINAL |
Advn |
Prelim |
FINAL |
|
|
| |
|
| |
|
|
Real GDP (At 8:30 a.m ET)
| SCHEDULE 2021 |
No 1 |
No 2 |
No 3 |
No 4 |
No 5 |
No 6 |
No 7 |
No 8 |
No 9 |
No 10 |
No 11 |
No 12 |
| Release | Week |
|
|
|
|
|
|
|
|
|
|
|
|
| Release | Date |
28.Jan.21 |
24.Feb.21 |
25.Mar.21 |
29.Apr.21 |
27.May.21 |
24.Jun.21 |
|
|
|
|
|
|
| Release | Day |
|
|
|
|
|
|
|
|
|
|
|
|
|
|
|
|
|
|
|
|
|
|
|
|
|
| Prior |
3.1% |
4.0% |
4.1% |
4.3% |
6.4% |
6.4% |
6.4% |
6.5% |
6.6% |
6.7% |
2.0% |
2.1% |
| Prior Revised |
... |
... |
... |
... |
... |
.. |
6.3% |
... |
... |
... |
... |
... |
| CONSENSUS |
4.2% |
4.1% |
4.1% |
6.5% |
6.5% |
6.4% |
8.0% |
6.6% |
6.7% |
2.8% |
2.1% |
2.1% |
| Consensus Low |
2.5% |
3.9% |
4.0% |
4.7% |
6.4% |
6.4% |
5.6% |
6.3% |
6.5% |
2.3% |
1.9% |
2.1% |
| Consensus High |
4.6% |
4.4% |
4.4% |
10.0% |
7.0% |
6.6% |
9.5% |
6.9% |
6.8% |
2.9% |
4.0% |
2.3% |
| REAL GDP |
4.0% |
4.1% |
4.3% |
6.4% |
6.4% |
6.4% |
6.5% |
6.6% |
6.7% |
2.0% |
2.1% |
2.3% |
| RATING |
|
|
|
|
|
|
|
|
|
|
|
|
| Quarter for |
Q4-2020 |
Q4-2020 |
Q4-2020 |
Q1-2021 |
Q1-2021 |
Q1-2021 |
Q2-2021 |
Q2-2021 |
Q2-2021 |
Q3-2021 |
Q3-2021 |
Q3-2021 |
| Typ |
Advn |
Prelim |
FINAL |
Advn |
Prelim |
FINAL |
Advn |
Prelim |
FINAL |
Advn |
Prelim |
FINAL |
|
|
| |
|
| |
 |
Legends: |
 |
Delayed |
 |
Positive View |
 |
Negative View |
 |
Neutral View |
 |
Non Available |
 |
|
|
|
|
|
|
|
|
|
|
|
|
|
|
|
|
|
|
|
| |
|
|
|
|
|
|
|
|
|
|
|
|
Real GDP (At 8:30 a.m ET)
| DATE/WEEK |
HIGHLIGHTS |
FOR |
GDP |
|
Real GDP |
Q3-FINAL |
... |
|
2026 |
|
| |
|
|
|
Real GDP |
Q3-Pre |
... |
|
2026 |
|
| |
|
|
|
Real GDP |
Q3-Adv |
... |
|
2026 |
|
| |
|
|
|
Real GDP |
Q2-FINAL |
... |
|
2026 |
|
| |
|
|
|
Real GDP |
Q2-Pre |
... |
|
2026 |
|
| |
|
|
|
Real GDP |
Q2-Adv |
... |
|
2026 |
|
| |
|
|
|
Real GDP |
Q1-FINAL |
... |
|
2026 |
|
| |
|
|
|
Real GDP |
Q1-Pre |
... |
|
2026 |
|
| |
|
|
|
Real GDP |
Q1-Adv |
... |
|
2026 |
|
| |
|
|
|
Real GDP |
Q4-FINAL |
... |
|
2025 |
|
| |
|
|
|
US fourth-quarter GDP growth revised down to 0.7%.U.S. economic growth slowed more sharply than initially thought in the fourth quarter amid downward revisions to consumer spending and business investment, government data showed on Friday. Gross domestic product increased at a 0.7% annualized rate last quarter, revised down from the initially reported 1.4% pace, the Commerce Department's Bureau of Economic Analysis said in its second GDP estimate. Economists polled by Reuters had forecast GDP growth would be unrevised at 1.4%. |
Q4-Pre |
0.7% |
|
2025 |
|
| |
|
|
|
U.S. economic growth slowed more than expected in the fourth quarter, with government spending posting its biggest decline since 1972 because of last year's shutdown, but steady consumer and business outlays underscored the economy's resilience. Most of the drag on gross domestic product from the 43-day shutdown, however, will likely be reversed in the first quarter. Fourth-quarter economic growth increases at 1.4% rate. Consumer spending slows; inflation heats up |
Q4-Adv |
1.4% |
|
2025 |
|
| |
|
|
|
The U.S. economy grew a bit faster than initially thought in the third quarter, the government said on Thursday, while corporate profits were also revised higher. Gross domestic product increased at an upwardly revised 4.4% annualized rate, the fastest pace since the third quarter of 2023, the Commerce Department's Bureau of Economic Analysis said in its updated estimate of third-quarter GDP on Thursday. US third-quarter economic growth revised slightly higher. |
Q3-Final |
4.4% |
|
2025 |
|
| |
|
|
|
|
|
|
|
|
| |
|
|
|
|
|
| |
|
|
|
|
|
|
Real GDP (At 8:30 a.m ET)
| DATE/WEEK |
HIGHLIGHTS |
FOR |
GDP |
|
An initial reading of third-quarter gross domestic product showed the US economy expanded at an inflation-adjusted annualized rate of 4.3%, a far faster pace than the 3.8% recorded in the second quarter, according to Commerce Department data released Tuesday. That’s the fastest growth rate in two years. An acceleration in consumer spending, up 3.5% from 2.5% in the second quarter, and exports, up 8.8% from -1.8% in the second quarter, were the main contributors to the third-quarter GDP reading. |
Q3-Adv |
4.3% |
|
2025 |
|
| |
|
|
|
GDP for Q3. Pre: Delayed due to the government shut down. |
Q3-Pre |
... |
|
2025 |
|
| |
|
|
|
GDP for Q3. Adv: Delayed due to the government shut down. |
Q3-Adv |
... |
|
2025 |
|
| |
|
|
|
The U.S. economy grew at a strong 3.8% annualized pace in the second quarter, the government reported Thursday in its final revision of gross domestic product data for April through June. U.S. GDP — the nation's output of goods and services — rebounded in the spring from a 0.6% first-quarter drop caused by fallout from President Donald Trump's trade wars, the Commerce Department said. The department had previously estimated second-quarter growth at 3.3%, and forecasters had expected a repeat of that figure. Consumer spending buoyed the economy in the second quarter, rising at a 2.5% pace, up from 0.6% in the first quarter and well above the 1.6% the government previously estimated. The data provides evidence that Americans continued to open their wallets despite broader economic headwinds such as tariffs and a slowing job market, economists noted. |
Q2-FINAL |
3.8% |
|
2025 |
|
| |
|
|
|
The US real Gross Domestic Product (GDP) increased at an annual rate of 3.3 percent in the second quarter of 2025 (April, May, and June), a significant rebound from the 0.5 percent contraction in the first quarter. This higher-than-expected growth was primarily driven by a sharp decline in imports, a reversal from the first quarter's surge, and an increase in consumer spending. |
Q2-Pre |
3.3% |
|
2025 |
|
| |
|
|
|
Data for the first quarter of 2025 (which includes May) showed a contraction of 0.5% at an annual rate, primarily due to a sharp increase in imports and a slowdown in consumer spending, partially offset by increases in investment and exports. The advance estimate for the second quarter (April-June) showed an annualized growth rate of 3.0%, driven by a decrease in imports and increased consumer spending. |
Q2-Adv |
3.0% |
|
2025 |
|
| |
|
|
|
On June 26, 2025, the U.S. Bureau of Economic Analysis (BEA) released its third estimate for Gross Domestic Product (GDP) for the first quarter of 2025, indicating that real GDP decreased at an annualized rate of 0.5%, a downward revision from the previous estimate of a 0.2% decline. This contraction in Q1 2025 followed a 2.4% increase in Q4 2024 and marked the first quarterly contraction in three years, largely due to increased imports and a decrease in government spending, which more than offset increases in investment and consumer spending. |
Q1-FINAL |
-0.5% |
|
2025 |
|
| |
|
|
|
On May 29, 2025, the U.S. Bureau of Economic Analysis (BEA) released its second estimate for Gross Domestic Product (GDP) for the first quarter of 2025, indicating a decrease of 0.2% annualized, a slight improvement from the initial estimate of -0.3%. This contraction marks the first quarterly decline since 2022, attributed to factors including weaker consumer spending and a significant negative impact from net exports due to surging imports. |
Q1-Pre |
-0.2% |
|
2025 |
|
| |
|
|
|
U.S. economy shrank 0.3% in the first quarter as Trump policy uncertainty weighed on businesses. Gross domestic product fell at a 0.3% annualized pace, largely pushed by a surge in imports ahead of President Donald Trump’s tariffs. Imports soared 41.3%, driven by a 50.9% increase in goods. Imports subtract from GDP, so the contraction in growth may not be viewed as negatively given the potential for the trend to reverse. The report provided cross signals for the Fed. While the negative growth number might push the central bank to consider lowering interest rates, inflation readings could give policymakers pause. |
Q1-Adv |
-0.3% |
|
2025 |
|
| |
|
|
|
U.S. economy shrank 0.3% in the first quarter as Trump policy uncertainty weighed on Q4 economic growth rate revised up to 2.4% The U.S. economy grew a little faster than expected in the final three months of 2024, according to a Commerce Department report Thursday. Gross domestic product accelerated at a 2.4% pace for the October-through-December period, the Bureau of Economic Analysis said in its last of three estimates. That was 0.2 percentage points ahead of the previous estimate and came from an upward revision to consumer spending, which grew at a 4% rate in the fourth quarter. |
Q4-FINAL |
2.4% |
|
2024 |
|
| |
|
|
|
The Commerce Department said the U.S. economy grew at a 2.3% annualized pace in the fourth quarter of 2024, in a second estimate for gross domestic product that was unchanged from the initial figure. Second estimate of US growth confirms a 2.3% annual pace expansion in fourth quarter. The Commerce Department reported Thursday (February 27) that growth in gross domestic product — the nation’s output of goods and services — decelerated from a 3.1% pace in July- September 2024. For all of last year, the economy grew 2.8% compared with 2.9% in 2023. |
Q4-Pre |
2.3% |
|
2024 |
|
| |
|
|
|
GDP grew at a 2.3% pace in the fourth quarter, less than expected. U.S. growth slowed at end of 2024, GDP shows, but economy looks good under the hood. The U.S. economy grew at a mild 2.3% annual pace in the final three months of 2024, but the details of the report showed an economy on strong footing as the Biden administration handed off to the Trump White House.The rate of increase in gross domestic product, the official scorecard of the economy, slowed in the fourth quarter from a 3.1% growth rate in the third quarter. GDP accelerated at a 2.3% annualized pace in the fourth quarter. Economists surveyed by Dow Jones had been expecting an increase of 2.5% after growth of 3.1% in the third quarter.For the full year, GDP accelerated 2.8%, compared to 2.9% in 2023. |
Q4-Adv |
2.3% |
|
2024 |
|
| |
|
|
|
|
|
|
|
|
| |
|
|
|
|
|
| |
|
|
|
|
|
|
Real GDP (At 8:30 a.m ET)
| DATE/WEEK |
HIGHLIGHTS |
FOR |
GDP |
|
The U.S. economy was even stronger than it looked in the third quarter, GDP shows. We can thank consumers. US Gross Domestic Product grows by 3.1% in Q3 vs. 2.8% expected. US economy grew at a faster pace in Q3 than initially estimated. US Dollar Index stays in the red below 108.00. The United States' Gross Domestic Product (GDP) expanded at an annual rate of 3.1% in the third quarter, the US Bureau of Economic Analysis (BEA) reported in its final estimate on Thursday. This reading came in above the market expectation and the previous estimate of 2.8%. |
Q3-FINAL |
3.1% |
|
2024 |
|
| |
|
|
|
U.S. economy grew at 2.8% pace in third quarter - and it’s still going strong. The U.S. grew a 2.8% annual pace in the third quarter, revised figures showed, and indicated the economy headed into the crucial holiday shopping season with plenty of momentum. The increase in gross domestic product, the official scorecard of the economy, was unchanged from an initial 2.8% estimate last month. Economists polled by MarketWatch had forecast GDP to remain the same. Consumer spending, the lynchpin of GDP growth, expanded at a frothy 3.5% rate, down from the original 3.7% estimate. Consumer spending accounts for more than two-thirds of everything that goes on in the economy. |
Q3-Pre |
2.8% |
|
2024 |
|
| |
|
|
|
U.S. economy grew at a 2.8% pace in the third quarter, less than expected. Gross domestic product increased at a 2.8% annualized rate in the third quarter, below the 3.1% estimate and the 3.0% reading Q2. Consumer spending and federal government outlays were two of the biggest contributors to GDP growth. The release comes with the Federal Reserve poised to lower interest rates further despite the seemingly strong economy and inflation that remains above target. The U.S. economy posted another solid though slightly disappointing period of growth in the third quarter, propelled higher by strong consumer spending that has defied expectations for a slowdown. Gross domestic product, a measure of all the goods and services produced during the three-month period from July through September, increased at a 2.8% annualized rate, according to a Commerce Department report Wednesday that is adjusted for inflation and seasonality. |
Q3-Adv |
2.8% |
|
2024 |
|
| |
|
|
|
Thursday's reading on GDP is considered backward looking given it's an update to economic growth for a quarter that ended in June. But projections show the economy has been growing at a steady pace in the third quarter, which ends in September. The US economy grew at a 3% annualized pace in the second quarter, a faster rate than Wall Street had expected. The Bureau of Economic Analysis's third estimate of second quarter US gross domestic product (GDP) was unchanged from the second estimate which had shown 3% annualized growth. Economists had estimated the reading to show annualized growth of 2.9%. The third estimate for second quarter GDP confirms that economic growth was higher than the 1.4% annualized growth seen in the first quarter. |
Q2-FINAL |
3.0% |
|
2024 |
|
| |
|
|
|
US GDP for Q2-2024 Preliminary at 3.0% from Consensus of 2.8%. Economists predict the economy grew at a 2.8% seasonally adjusted annual pace from April through June. That follows a 1.4% annual growth pace in the first quarter, the slowest since spring 2022. The US economy grew last quarter at a healthy 3% annual pace, fueled by strong consumer spending and business investment. |
Q2-Pre |
3.0% |
|
2024 |
|
| |
|
|
|
U.S. economy grew at a 2.8% pace in the second quarter, much more than expected. Real gross domestic product increased at a 2.8% annualized pace in the second quarter, above the 2.1% forecast. The personal consumption expenditures price index, a key measure for the Fed, rose 2.6% for the quarter, down from the 3.4% move in Q1. Core PCE prices were up 2.9%, down from 3.7%. However, the report also indicated that the personal savings rate continues to decelerate, at 3.5% for the quarter, compared with 3.8% in Q1. Real gross domestic product, a measure of all the goods and services produced during the April-through-June period, increased at a 2.8% annualized pace adjusted for seasonality and inflation. Economists surveyed by Dow Jones had been looking for growth of 2.1% following a 1.4% rise in the first quarter. |
Q2-Adv |
2.8% |
|
2024 |
|
| |
|
|
|
U.S. GDP Final Q1-2024 was 1.4%. Consensus was 1.4%..More data showed that economic growth moderated sharply in the first quarter. Gross domestic product increased at a slightly upwardly revised 1.4% annualized rate last quarter, but down from the 3.4% registered in last three months of 2023. The GDP report also showed weak consumer spending. |
Q1-FINAL |
1.4% |
|
2024 |
|
| |
|
|
|
GDP Preliminary Q1-2024 grew less than initially thought in first quarter; inflation reading eases. Economic growth in the first three months of the year was lower than initially estimated, but so was a key inflation indicator, according to a Commerce Department report Thursday. Real gross domestic product accelerated at a 1.3% annualized rate in the first quarter, down from the initial 1.5% estimate. |
Q1-Pre |
1.3% |
|
2024 |
|
| |
|
|
|
The GDP report showed growth of 1.6%, which was lower than the 2.4% expected by economists surveyed by Dow Jones. Along with the downbeat growth rate for the quarter, the report showed consumer prices increased at a 3.4% pace, well above the previous quarter’s 1.8% advance. This raised concern over persistent inflation and put into question whether the Federal Reserve will be able to cut rates anytime soon, even with the economy slowing. Gross domestic product, a broad measure of goods and services produced in the January-through-March period, increased at a 1.6% annualized pace, below the 2.4% estimate. The personal consumption expenditures price index, a key inflation variable for the Federal Reserve, rose at a 3.4% annualized pace for the quarter, its biggest gain in a year. Consumer spending increased 2.5% in the period, down from a 3.3% gain in the fourth quarter and below the 3% Wall Street estimate. |
Q1-Adv |
1.6% |
|
2024 |
|
| |
|
|
|
U.S. GDP Final Q4-2023 was 3.4%. Consensus was 3.2%. Economists surveyed by Dow Jones had been looking for an increase of 3.2% Investors have had to adjust their view of when the Fed will start easing as inflation has remained elevated. The view as expressed through futures trading is that rate reductions will begin in September, with the Fed likely to cut just one or two times this year. |
Q4-FINAL |
3.4% |
|
2023 |
|
| |
|
|
|
According to revised gross domestic product numbers released Wednesday, The U.S. economy grew at a slightly slower pace in the fourth quarter of 20234 than previously reported. GDP rose at a 3.2% annualized rate adjusted for seasonality and inflation, 0.1 percentage point lower than the initial estimate. The downward revision came primarily due to smaller than expected private inventory investment, which offset upward revisions in local government and consumer spending. |
Q4-Pre |
2.7% |
|
2023 |
|
| |
|
|
|
Thursday’s GDP report expected to show the U.S. economy at a crossroads. Fourth-quarter gross domestic product is expected to show growth at a 2% seasonally adjusted annualized pace.The U.S. economy grew at blistering 3.3% pace in Q4 while inflation pulled back. GDP, a measure of all the goods and services produced, increased at a 3.3% annualized rate in the fourth quarter of 2023. Wall Street had been looking for a 2% gain. The U.S. economy for all of 2023 accelerated at a 2.5% annualized pace, well ahead of the Wall Street outlook at the beginning of the year for few if any gains and better than the 1.9% increase in 2022. A strong pace of consumer spending helped drive the expansion, as did government spending. There also was progress on inflation. Core prices for personal consumption expenditures rose 2% for the period, while the headline rate was 1.7%. |
Q4-Adv |
3.3% |
|
2023 |
|
| |
|
|
|
|
|
|
|
|
| |
|
|
|
|
|
| |
|
|
|
|
|
|
Real GDP (At 8:30 a.m ET)
| DATE/WEEK |
HIGHLIGHTS |
FOR |
GDP |
|
US GDP Data highlights: The third reading of real gross domestic product came in lower than expected. Real gross domestic product rose at an annual rate of 4.9% in the third quarter, according to the third estimate from the Bureau of Economic Analysis. That’s down from the second estimate’s increase of 5.2%, and lower than the rise of 5.1% anticipated by economists polled by Dow Jones. In the second quarter, real GDP rose by 2.1%. |
Q3-FINAL |
4.9% |
|
2023 |
|
| |
|
|
|
U.S. GDP grew at a 5.2% rate in the third quarter, even stronger than first indicated. The U.S. economy grew at an even stronger pace then previously indicated in the third quarter, the product of better-than-expected business investment and stronger government spending, the Commerce Department reported Wednesday. Gross domestic product, a measure of all goods and services produced during the three-month period, accelerated at a 5.2% annualized pace, the department’s second estimate showed. The acceleration topped the initial 4.9% reading and was better than the 5% forecast from economists polled by Dow Jones. |
Q3-Pre |
5.2% |
|
2023 |
|
| |
|
|
|
The U.S. economy grew even faster than expected in the third quarter, buoyed by a strong consumer in spite of higher interest rates, ongoing inflation pressures, and a variety of other domestic and global headwinds. Gross domestic product, a measure of all goods and services produced in the U.S., rose at a seasonally adjusted 4.9% annualized pace in the July-through-September period, up from an unrevised 2.1% pace in the second quarter, the Commerce Department reported Thursday. Economists surveyed by Dow Jones had been looking for a 4.7% acceleration in real GDP, which also is adjusted for inflation. |
Q3-Adv |
4.9% |
|
2023 |
|
| |
|
|
|
GDP up 2.1% in Q3 as government announces revisions. Real gross domestic product increased 2.1% at an annualized pace in the second quarter, according to a third and final estimate the Commerce Department released Thursday. That was unchanged from the previous reading but below the Dow Jones estimate for 2.2%. However, the government revised its previous readings on GDP, cutting first quarter growth for each of the years from 2020 to 2022. The new readings, respectively, are -5.3%, 5.2% and -2%, compared to the previous -4.6%, 6.3% and -1.6%. |
Q2-FINAL |
2.1% |
|
2023 |
|
| |
|
|
|
U.S. second-quarter GDP growth revised lower. U.S. economic growth was revised lower to a still-solid pace in the second quarter, but momentum appears to have picked up early in the third quarter as a tight labor market underpins consumer spending. Gross domestic product increased at a 2.1% annualized rate last quarter, the government said on Wednesday in its second estimate of GDP for the April-June period. That was revised down from the 2.4% pace reported last month. Economists polled by Reuters had expected GDP for the second quarter would be unrevised. The revision reflected downgrades to inventory investment as well as business spending on equipment and intellectual property products. |
Q2-Pre |
2.1% |
|
2023 |
|
| |
|
|
|
GDP grew at a 2.4% pace in the second quarter, topping expectations despite recession calls. Gross domestic product rose at a 2.4% annualized pace in the second quarter, topping the 2% estimate. Consumer spending powered the solid quarter, aided by increases in nonresidential fixed investment, government spending and inventory growth. A Commerce Department inflation gauge increased 2.6%, down from a 4.1% rise in Q1 and well below the estimate for a gain of 3.2%. |
Q2-Adv |
2.4% |
|
2023 |
|
| |
|
|
|
First-quarter economic growth was actually 2%, up from 1.3% first reported in major GDP revision. First-quarter economic growth was actually 2%, up from 1.3% first reported in major GDP revision. The U.S. economy grew at a 2% annualized pace in the first quarter, according to a final revision to the figure released Thursday. That was well above the previous estimate of 1.3% and the 1.4% Dow Jones consensus forecast. Upward revisions in consumer spending and inventories boosted the revised number. |
Q1-FINAL |
2.0% |
|
2023 |
|
| |
|
|
|
First-quarter GDP declined at a 1.5% annual pace, according to the second estimate from the Bureau of Economic Analysis. That was worse than the 1.3% Dow Jones estimate and a writedown from the initially reported 1.4%. Downward revisions for both private inventory and residential investment offset an upward change in consumer spending. A swelling trade deficit also subtracted from the GDP total. The pullback in GDP represented the worst quarter since the pandemic-scarred Q2 of 2020 in which the U.S. fell into a recession spurred by a government-imposed economic shutdown to battle Covid-19. GDP plummeted 31.2% in that quarter. Economists largely expect the U.S. to rebound in the second quarter as some of the factors holding back growth early in the year subside. A surge in the omicron variant slowed activity, and the Russian attack on Ukraine aggravated supply chain issues that had contributed to a 40-year high in inflation. |
Q1-Pre |
1.3% |
|
2023 |
|
| |
|
|
|
The U.S. economy has been surprisingly resilient in the face of aggressive interest rate hikes and stubborn inflation over the past year, but it started to show signs of wear and tear in the first quarter. Annualized U.S. gross domestic product growth slowed to 1.1%, the Bureau of Economic Analysis (BEA) reported Thursday, well below consensus expectations on Wall Street for 1.9%. At the same time, one of the Federal Reserve’s favorite inflation gauges, the personal consumption expenditures (PCE) index, increased to 4.2%, higher than the expected 3.7%. |
Q1-Adv |
1.1% |
|
2023 |
|
| |
|
|
|
A GDP report Thursday showed that growth was a bit less strong to closer 2022 than previously thought. The final Commerce Department reading for gross domestic product showed the economy grew at a 2.6% annualized rate in the fourth quarter, slightly below the previous estimate of 2.7%. That change came primarily due to downward revisions in consumer spending and exports, the department said. Growth likely accelerated for the first three months of 2023, according to the Atlanta Fed’s GDPNow tracker. That gauge shows GDP rising at a 3.2% pace. According to estimates last week, central bankers expect the unemployment rate to rise to 4.5% this year, from its current 3.6% level. Doing so would require the loss of more than 540,000 jobs, according to an Atlanta Fed calculator. |
Q4-FINAL |
2.6% |
|
2022 |
|
| |
|
|
|
U.S. GDP was 2.7% vs. prior 2.9%. Consensus was 2.9%.We are now in a period of low growth and moderating inflation. The big question is how far can inflation come down in that type of environment. It is possible that if supply pressures continue to abate in a period of below-trend growth, inflation will eventually return to the Fed’s target. However, this period of below-trend growth might need to be quite long, which is why the Fed is talking about keeping rates restrictive for an extended period. |
Q4-Pre |
2.7% |
|
2022 |
|
| |
|
|
|
GThe U.S. economy finished 2022 in solid shape even as questions persist over whether growth will turn negative in the year ahead. Fourth-quarter gross domestic product, the sum of all goods and services produced for the October-to-December period, rose at a 2.9% annualized pace, the Commerce Department reported Thursday. Economists surveyed by Dow Jones had expected a reading of 2.8%. The growth rate was slightly slower than the 3.2% pace in the third quarter. Consumer spending, which accounts for about 68% of GDP, increased 2.1% for the period, down slightly from 2.3% in the previous period but still positive. Inflation readings moved considerably lower to end the year after hitting 41-year highs in the summer. The personal consumption expenditures price index increased 3.2%, in line with expectations but down sharply from 4.8% in the third quarter. Excluding food and energy, the chain-weighted index rose 3.9%, down from 4.7%.. |
Q4-Adv |
2.9% |
|
2022 |
|
| |
|
|
|
|
|
|
|
|
| |
|
|
|
|
|
| |
|
|
|
|
|
|
Real GDP (At 8:30 a.m ET)
| DATE/WEEK |
HIGHLIGHTS |
FOR |
GDP |
|
Nevertheless, consumer spending is on track to provide another lift to economic growth this quarter, after teaming up with exports to boost gross domestic product in the third quarter. The economy grew at a 3.2% annualized rate last quarter after contracting in the first half of the year. Growth estimates for the fourth quarter are as high as a 2.7% pace. Consumer spending is being driven by solid wage gains, thanks to a tight labor market, as well as savings accumulated during first year of the COVID-19 pandemic. The Fed last week hiked its policy rate by 50 basis points to a 4.25%-4.50% range, the highest since late 2007. Fed officials expect the rate to rise to between 5.00% and 5.25% next year, a level that could be sustained for a while. |
Q3-FINAL |
3.2% |
|
2022 |
|
| |
|
|
|
.The U.S. economy rebounded more strongly than initially thought in the third quarter, the government confirmed on Wednesday, but higher interest rates as the Federal Reserve battles inflation have raised the risks of a recession next year. Gross domestic product increased at a 2.9% annualized rate, the government said in its second estimate of third-quarter GDP. That was revised up from the 2.6% pace reported last month. The economy had contracted at a 0.6% rate in the second quarter.The government’s primary measures of US third-quarter economic activity painted a mixed picture of the economy’s momentum after a lackluster first half of the year. Inflation-adjusted gross domestic product, or the total value of all goods and services produced in the economy, increased at a 2.9% annualized rate during the period, Commerce Department data showed Wednesday. That reflected upward revisions to consumer and business spending, and compares with a previously reported 2.6% advance. |
Q3-Pre |
2.9% |
|
2022 |
|
| |
|
|
|
U.S. GDP increased increased at a 2.6% annualized pace for the period, against the Dow Jones estimate for 2.3% growth. The report, the first quarter of positive growth for 2022, eased investors’ concerns about a recession. U.S. GDP accelerated at 2.6% pace in Q3, better than expected as growth turns positive. Gross domestic product rose 2.6% in the third quarter versus the estimate of 2.3%. A narrowing trade deficit and increases in consumer spending and government outlays boosted the number.. GDP, a sum of all the goods and services produced from July through September, increased at a 2.6% annualized pace for the period, according to the advance estimate. That was above against the Dow Jones forecast for 2.3%. |
Q3-Adv |
2.6% |
|
2022 |
|
| |
|
|
|
Gross domestic product fell at an unrevised 0.6% annualized rate last quarter, the government said in its third estimate of GDP. The economy contracted at a 1.6% rate in the first quarter. The government also revised GDP data from the fourth quarter of 2016 through the fourth quarter of 2021, which showed the economy's recovery from the COVID-19 pandemic was much stronger than initially thought. The revisions also showed the gap between GDP and the other economic growth measure, gross domestic income (GDI), was far much smaller than initially thought in 2021. The personal consumption expenditures price index, a favorite inflation gauge for the Fed, showed a 7.3% year-over-year price gain in the second quarter, the Commerce Department reported in its final GDP estimate for the period. |
Q2-FINAL |
-0.6% |
|
2022 |
|
| |
|
|
|
The US economy shrank at a slightly slower rate than estimated during the second quarter, according to updated data released Thursday by the US Bureau of Economic Analysis. The nation's gross domestic product -- the broadest measure of economic activity -- shrank 0.6% at an annualized rate from April through June. The activity was revised upward from the advanced estimate released in July, which showed a 0.9% decline. Despite the upward revision, the latest estimates show an economy that has been contracting for two consecutive quarters, a threshold that's generally considered an unofficial indicator of a recession (the official arbiter is a panel of National Bureau of Economic Research economists, who take an array of economic indicators into consideration). Many economists, however, don't believe the US is in the midst of a recession. |
Q2-Pre |
-0.6% |
|
2022 |
|
| |
|
|
|
GDP fell 0.9% in the second quarter, the second straight decline and a strong recession signal.Gross domestic product fell 0.9% at an annualized pace for the period, according to the advance estimate. That follows a 1.6% decline in the first quarter and was worse than the Dow Jones estimate for a gain of 0.3%. The drop came from a broad swath of factors, including decreases in inventories, residential and nonresidential investment, and government spending |
Q2-Adv |
-0.9% |
|
2022 |
|
| |
|
|
|
U.S. GDP drops 1.6% vs. prior 1.5% decline. Consensus was -1.4%. A 1.6% decline in the first quarter and was worse than the Dow Jones estimate for a gain of -1.4%. Officially, the National Bureau of Economic Research declares recessions and expansions, and likely won’t make a judgment on the period in question for months if not longer. |
Q1-FINAL |
-1.6% |
|
2022 |
|
| |
|
|
|
First-quarter GDP declined at a 1.5% annual pace, worse than the 1.3% Dow Jones estimate and a writedown from the initially reported 1.4%. The pullback in GDP represented the worst quarter since the pandemic-scarred Q2 of 2020. The U.S. economic contraction to start the year was worse than expected as weak business and private investment failed to offset strong consumer spending, the Commerce Department reported Thursday. First-quarter GDP declined at a 1.5% annual pace, according to the second estimate from the Bureau of Economic Analysis. That was worse than the 1.3% Dow Jones estimate and a writedown from the initially reported 1.4%. Downward revisions for both private inventory and residential investment offset an upward change in consumer spending. A swelling trade deficit also subtracted from the GDP total. |
Q1-Pre |
-1.5% |
|
2022 |
|
| |
|
|
|
Gross domestic product fell at a 1.4% annualized rate last quarter, the Commerce Department said in its advance GDP estimate on Thursday. That was the first decline since the pandemic recession nearly two years ago. The economy grew at a robust 6.9% pace in the fourth quarter. Economists polled by Reuters had forecast the economy growing at a 1.1% rate. Estimates ranged from as low as a 1.4% rate of contraction to as high as a 2.6% growth pace. The slump in output reflected a wider trade deficit and moderate pace of inventory accumulation. While the headline figure could lead to howls about stagflation and recession from some quarters, it is not a true reflection of the economy. |
Q1-Adv |
-1.4% |
|
2022 |
|
| |
|
|
|
Fourth-quarter GDP growth lowered to 6.9%. Key details: Consumer spending rose a revised 2.5% in the fourth quarter, updated GDP figures show. Previously the increase was reported as 3.1%. Business investment and the increase in inventories were somewhat stronger than previously reported, offsetting the revision to spending.Most other figures in the GDP report were little changed.The economy grew at a 5.7% pace in 2021, recovering from a steep 3.4% drop in 2020. |
Q$-FINAL |
6.9% |
|
2021 |
|
| |
|
|
|
Gross domestic product, a sum of all the goods and services produced in the U.S. economy, increased at a 7% annualized rate during the fourth quarter, according to the Commerce Department. On the broader economic side, the slight upward revision of GDP from the initial reading of 6.9% was in line with market estimates. That brought full-year growth to 5.7%, the fastest pace since 1984 that was driven by a strong inventory rebuild in the second half of the year. |
Q4-Pre |
7.0% |
|
2021 |
|
| |
|
|
|
GDP grew at a 6.9% pace to close out 2021, stronger than expected despite omicron spread, The U.S. economy grew at a much better than expected pace to end 2021 though the acceleration likely tailed off as the omicron spread put a damper on hiring and further hindered the global supply chain. Gross domestic product, the sum of all goods and services produced during the October-through-December period, increased at a 6.9% annualized pace, the Commerce Department reported Thursday. Economists surveyed by Dow Jones had been looking for a gain of 5.5%. The increase was well above the unrevised 2.3% growth in the third quarter. Gains came from increases in private inventory assessment, strong consumer activity as reflected in personal consumption expenditures, exports and business spending as measured by nonresidential fixed investment. |
Q4-Adv |
6.9% |
|
2021 |
|
| |
|
|
|
|
|
|
|
|
| |
|
|
|
|
|
| |
|
|
|
|
|
|
Real GDP (At 8:30 a.m ET)
| DATE/WEEK |
HIGHLIGHTS |
FOR |
GDP |
|
The nation’s gross domestic product expanded at an annual rate of 2.3% in the third quarter, in the final estimate released Wednesday by the Labor Department. The reading was revised from the prior 2.1% estimate and compares with increases of 6.4% and 6.7% in the first and second quarters, respectively. Third-quarter growth was curtailed by the presence of the delta variant of the coronavirus, concerns over inflation and supply-chain issues that hampered businesses in their ability to provide goods to consumers. Those have abated somewhat and economists now expect fourth-quarter GDP to come in anywhere from 5% to 7%, with uncertainty over the effects of the latest omicron variant of the coronavirus. |
Q3-Final |
2.3% |
|
2021 |
|
| |
|
|
|
US GDP Slowed Sharply in Q3 but Big Rebound Expected in Q4. The U.S. economy slowed to a modest annual rate of 2.1% in the July-September quarter, slightly better than first reported. The U.S. economy slowed to a modest annual rate of 2.1% in the July-September quarter according to the government’s second read of the data, slightly better than its first estimate. But economists are predicting a solid rebound in the current quarter as long as rising inflation and a recent uptick in COVID cases do not derail activity. |
Q3-Pre |
2.1% |
|
2021 |
|
| |
|
|
|
The U.S. economy grew at a 2% rate in the third quarter, its slowest gain of the pandemic-era recovery, as supply chain issues and a marked deceleration in consumer spending stunted the expansion, the Commerce Department reported Thursday. Gross domestic product, a sum of all the goods and services produced, grew at a 2.0% annualized pace in the third quarter, according to the department’s first estimate released Thursday. Economists surveyed by Dow Jones had been looking for a 2.8% reading. That marked the slowest GDP gain since the 31.2% plunge in the second quarter of 2020, which encompassed the period during which Covid-19 morphed into a global pandemic that resulted in a severe economic shutdown that sent tens of millions to the unemployment lines and put a chokehold on activity across the country. |
Q3-Adv |
2.0% |
|
2021 |
|
| |
|
|
|
US Slightly Revises up Its GDP Estimate for Q2 to 6.7%. The U.S. economy expanded at a 6.7% annual pace from April through June, the Commerce Department said Thursday, slightly upgrading its estimate of last quarter’s growth in the face of a resurgence of COVID-19 in the form of the delta variant. The U.S. economy expanded at a 6.7% annual pace from April through June, the Commerce Department said Thursday, slightly upgrading its estimate of last quarter's growth in the face of a resurgence of COVID-19 in the form of the delta variant.The government's estimate of growth in the second quarter — its last of three — was up from its previous estimate of a 6.6% annual pace that will likely mark a high point for the economy's expansion this year as the virus slows some activity, government support programs wind down and manufacturing supply-chain issues persist. |
Q2-FINAL |
6.7% |
|
2021 |
|
| |
|
|
|
The U.S. economy grew at a 6.6% annual rate last quarter, slightly faster than previously estimated, the government said Thursday in a report that pointed to a sustained consumer-led rebound from the pandemic recession. Second-quarter GDP was revised up to 6.6%, though that was a touch below the 6.7% estimate. In the GDP revision, the second reading for the pace of all goods and services produced came in higher from the initial estimate due to an upward revision in nonresidential fixed investment. Some cuts to the previous estimates for private inventory and residential fixed investment, along with a lower reading on state and local government spending, partially offset the higher number. The U.S. economy grew at a robust 6.6% annual rate last quarter, slightly faster than previously estimated, the government said Thursday in a report that pointed to a sustained consumer-led rebound from the pandemic recession. But worries are growing that the delta variant of the coronavirus is beginning to cause a slowdown. |
Q2-Pre |
6.6% |
|
2021 |
|
| |
|
|
|
U.S. GDP rose 6.5% last quarter, well below expectations. GDP rose at a 6.5% annualized pace in the second quarter, according to the Commerce Department’s first estimate Thursday. That was well below the Dow Jones estimate of 8.4%. The U.S. economy rose at a disappointing rate in the second quarter, the Commerce Department reported Thursday in a sign that the U.S. has escaped the shackles of the Covid-19 pandemic but still has more work to do. Gross domestic product, a measure of all goods and services produced during the April-to-June period, accelerated 6.5% on an annualized basis. That was slightly better than the 6.3% gain in the first quarter, which was revised down narrowly. The U.S. economy rose at a disappointing rate in the second quarter, the Commerce Department reported Thursday in a sign that the U.S. has escaped the shackles of the Covid-19 pandemic but still has more work to do. Gross domestic product, a measure of all goods and services produced during the April-to-June period, accelerated 6.5% on an annualized basis. That was slightly better than the 6.3% gain in the first quarter, which was revised down narrowly. |
Q2-Adv |
6.5% |
|
2021 |
|
| |
|
|
|
The economy grew at a 6.4% rate last quarter, unrevised from the estimate published in May. That followed a 4.3% pace of expansion in the fourth quarter. GDP report from the Commerce Department on Thursday confirmed economic growth accelerated in the first quarter, thanks to the massive fiscal stimulus. Gross domestic product increased at a 6.4% annualized rate last quarter, the government said in its third estimate of growth for the first three months of the year. That was unrevised from the estimate published last month. The economy grew at a 4.3% rate in the fourth quarter. Growth this quarter is forecast to be around a 10% rate. |
Q1-FINAL |
6.4% |
|
2021 |
|
| |
|
|
|
In a GDP report on Thursday, the Commerce Department confirmed that gross domestic product increased at a 6.4% annualized rate last quarter. The unrevised estimate followed a 4.3% growth rate in the fourth quarter. Before tax corporate profits slipped $0.2 billion after decreasing $31.4 billion in the October-December period. A rise in domestic nonfinancial corporation profits was offset by lower domestic financial corporation and international profits. The strong growth momentum held early in the second quarter, with another report from the Commerce Department showing orders for non-defense capital goods excluding aircraft, a closely watched proxy for business spending plans, jumped 2.3% in April. |
Q1-Pre |
6.4% |
|
2021 |
|
| |
|
|
|
Consumer-fueled economy pushes GDP to 6.4% first-quarter gain. First-quarter GDP for 2021 increased at a 6.4% rate, just below the Dow Jones estimate. It marked the second-fastest pace for growth since the second quarter of 2003 and was exceeded only by the reopening-fueled burst of Q3 in 2020. Economic activity boomed to start 2021, as widespread vaccinations and more fuel from government spending helped get the U.S. closer to where it was before the Covid-19 pandemic struck, the Commerce Department reported Thursday. Gross domestic product, the sum of all goods and services produced in the economy, jumped 6.4% for the first three months of the year on an annualized basis. Outside of the reopening-fueled third-quarter surge last year, it was the best period for GDP since the third quarter of 2003. Economists surveyed by Dow Jones had been looking for a 6.5% increase. Q4 of 2020 accelerated at a 4.3% pace. |
Q1-Adv |
6.4% |
|
2021 |
|
| |
|
|
|
Fourth-quarter GDP was stronger than expected at 4.3%. A separate release Thursday showed that gross domestic product was stronger than anticipated in the fourth quarter. The third and final reading on GDP showed a gain of 4.3%, up from previous estimates and the Wall Street consensus of 4.1%.Government Revises 4th Quarter GDP up Slightly to 4.3%/ The U.S. economy grew at an annual rate of 4.3% in the final three months of 2020, slightly faster than previously estimated, as recovery expectations for 2021 rise along with vaccinations and the provision of another nearly $2 trillion in government support. GDP in the October-December quarter rose from an estimated rate last month of 4.1%, the Commerce Department reported Thursday. The upward revision reflected stronger inventory restocking by businesses. For the entire year, the GDP shrank by 3.5%, the largest annual decline since a plunge of 11.6% in 1946 when the U.S. demobilized after World War II. The 3.5% drop was unchanged from the previous estimates. Economists are looking for a huge rebound this year, helped by government support packages including a $1.9 trillion package signed by President Joe Biden on March 11 that is delivering $1,400 payments to individuals, extending emergency unemployment until early September and providing billions of dollars in relief to state and local governments. |
Q4-FINAL |
4.3% |
|
2020 |
|
| |
|
|
|
Fourth-quarter reading of U.S. economy's recovery rate nudged up to 4.1% to 4%. GDP Rose 4.1% in the Fourth Quarter, While Jobless Claims Dropped Sharply Last Week.THE NATION'S GROSS domestic product increased 4.1% in the fourth quarter, the Bureau of Economic Analysis reported Thursday.The fourth quarter GDP figure was revised upward from the previous estimate of 4%, because of upgrades to residential fixed investment, private inventory investment, and state and local government spending.The upward revision to GDP comes as there is promising news on the labor market. |
Q4-Pre |
4.1% |
|
2020 |
|
| |
|
|
|
Other less economic data disappointed on Thursday, however. U.S. gross domestic product (GDP) grew for a second straight quarter in the final three months of 2020, albeit with slowing momentum heading into the new year, largely as a result of weakening consumer spending. All told, the U.S. economy contracted at a 3.5% annualized rate in 2020, for the biggest drop since 1946.
A day earlier, the Federal Open Market Committee issued a January monetary policy statement that pointed to moderating growth in the virus-stricken economy. Still, the central bank reiterated its commitment to keeping interest rates low and asset purchases robust as the economy weathers the COVID-19 pandemic.
4Q GDP comes in slightly below expectations, weekly jobless claims improve.
Fourth-quarter gross domestic product, tracking economic activity in the final three months of 2020, expanded at a 4.0% annualized clip, falling short of the 4.2% increase expected, according to Bloomberg data. This followed a record 33.4% annualized increase in the third quarter, which in turn had followed a record plunge in the second quarter. Personal consumption increased at an only 2.5% annualized rate, or well below the 3.1% expected. All told, gross domestic product remained below pre-pandemic levels from the fourth quarter of 2019. |
Q4-Adv |
4.0% |
|
2020 |
|
| |
|
|
|
|
|
|
|
|
| |
|
|
|
|
|
| |
|
Legends: |
|
Delayed |
|
Positive View |
|
Negative View |
|
Neutral View |
|
Non Available |
|
|
|
|
|
|
|
|
|
|
|
|
|
|
|
|
|
|
|
|
| |
|
|
|
|
|
|
|
|
|
|
|
| |
|
|
|
|
| |
|
| REAL GDP |
What is GDP?
GDP represents the total value of the country's production during the period and consists of the purchases of domestically-produced goods and services by individuals, businesses, foreigners and government entities. Real GDP (inflation-adjusted) growth is always quoted at a quarterly annual rate (three-month period).
GDP is the all-inclusive measure of economic activity. GDP and output reports give insight into production levels and expectations for future output. Figures such as GDP are often used as overall gauges for the health of an economy.
Stock Market Investors
Investors need to closely track the economy because it usually dictates how investments will perform. Investors in the stock market like to see healthy economic growth because robust business activity translates to higher corporate profits.
Bond Market Investors
Bond investors are more highly sensitive to inflation and robust economic activity could potentially pave the road to inflation. By tracking economic data such as GDP, investors will know what the economic backdrop is for these markets and their portfolios.
Real GDP, inflation-adjusted, growth is always quoted at a quarterly annual rate (three-month period).
It is labeled Real because each year's data is adjusted to account for changes in year-to-year prices.
A Nominal variable is one where the effects of inflation have not been accounted for. A Real variable is inflation adjusted.
In other words, if the gross GDP was calculated to be 6% higher than the previous year, but inflation measured 2% over the same period, GDP growth would be reported as 4%, or the net growth over the period.
GDP Components
GDP components such as consumer spending, business and residential investment, and price (inflation) indexes illuminate the economy's undercurrents, which can translate to investment opportunities and guidance in managing a portfolio.
Higher GDP:
The GDP Price Index is an indicator for inflation calculated by comparing the current GDP to GDP in the reference year. A high or rising GDP Price Index, like other indicators of inflation, puts pressure on the Federal Reserve to raise interest rates.
The gross domestic product (GDP) of a country can be defined as the value of the total final output of all goods and services produced in a single year within a country's boundaries. The growth is expressed as a percent.
Impact Interest Rates:
Unexpectedly high quarterly GDP growth is perceived to be potentially inflationary if the economy is close to full capacity; this, in turn, causes bond prices to drop and yields and interest rates to rise. Also, higher than expected GDP growth, good news about the economy, is bad news for the bond market because a strong report causes concern that the Fed might raise the Fed Funds rate to avoid higher inflation. This is bearish for the fixed income market.
Impact Inflation:
The GDP price index differs from other more popular inflation measures like CPI, in that it includes all products accounted for by GDP and does not include the affects of changes in import prices. Furthermore, the report is only released quarterly and commands little market attention because of it lack of timeliness. If real GDP grows too quickly, however, it can cause price inflation as firms are forced to bid against one another for increasingly scarce workers
Impact Stock Prices:
On one side higher than expected growth leads to higher profits and that's good for the stock market. On the other, it may increase expected inflation and lead to higher interest rates that are bad for the stock market.
Impact Exchange Rates:
Larger than expected GDP growth will tend to appreciate the exchange rate as it is expected to lead to higher interest rates.
Trade Deficit:
Any trade deficit is a drag on U.S. GDP growth, but a smaller deficit adds to growth, while a larger deficit decreases GDP growth.
Neo-Keynsian economic theory:
During peak periods of the business cycle when the economy is experiencing rapid growth in real GDP, employment will increase, and unemployment decrease, as businesses seek workers to produce a higher output. If real GDP grows too quickly, however, it can cause price inflation as firms are forced to bid against one another for increasingly scarce workers.
In contrast during trough periods of the business cycle the economy is experiencing declines in real GDP, and unemployment rates are high.
Employment and GDP
Annual growth of 2% generally adds only about 90,000 jobs a month, according to economists. That's not enough to drive down the unemployment rate, which is stuck at 8.2%. Healthier growth of 4% or more is needed to reduce unemployment significantly
Without more jobs, income growth is likely to remain sub-par and consumers are likely to remain cautious about spending.
Sluggish economic growth could compel the Federal Reserve to announce further efforts to bolster the economy. Fed officials meet Tuesday and Wednesday. |
| GDP REVISIONS AND FORECASTING |
Revisions
The government provides three estimates of economic growth each reflecting more complete information than the previous one. Quarterly GDP reports are broken down into three announcements: advance, preliminary, and final. After the final revision, GDP is not revised again until the annual benchmark revisions each July. These revisions can be quite large and usually affect the past five years of data.
Forecasting
Economists are forecasting a 2.0% growth rate for the current quarter, which ends Friday, and a 2.1% rate in the fourth quarter. Even if an outright recession is avoided, the pace of growth isn't expected to be fast enough to make a serious dent in the nation's persistently high unemployment rate.
GDP is made up of:
Y = C + I + G + ( X-Import )
Y= GDP
C= Consumption
I= Investment
G= Government Spending
(X-M)= Net Exports,X=Exports,M=Imports.
U.S. GDP includes Toyotas produced in Alabama but excludes Cadillac's made in Canada. GDP includes all U.S. exports but excludes all U.S. imports since imports, by definition, are produced in some other country and are a part of that country’s GDP.
|
|
|
| |
|
|
|
|
|
|
|
|
|
|
|
| |
|
|
|
|
|
|
| DATA INFORMATION |
REAL GDP |
| SOURCE |
Bureau of Economic Analysis (BEA), U.S. Department of Commerce. |
| WEB |
www.bea.gov |
| FREQUENCY |
Quarterly |
| AVAILABILITY |
Usually during the fourth week of the month. |
| COVERAGE |
Data are for the previous quarter. |
| REVISIONS |
Yes |
| IMPORTANCE |
Growth - Very Important |
|
| |
|
|
|
|
|
|
|
|
|
|
|
|