 |
 |
|
|
|
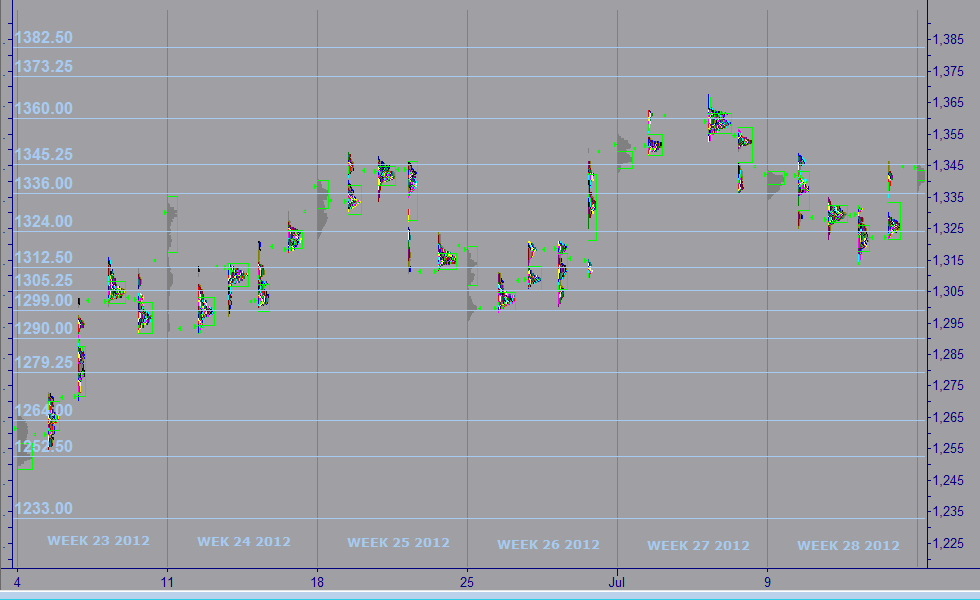
Week 29 -2012 | From July 16 to July 20, 2012 |
|
 |
|
|
|
|
|
|
| |
|
|
|
|
|
|
|
|
|
|
| |
Economic Data for Week 29-2012 | Global View | Week Rating
| DATE |
DAY |
REPORT/CATEGORY |
HIGHLIGHTS ON WEEK 29-2012 |
LAST |
|
Mon |
Retail Sales |
Retail sales rose at the weakest pace in seven months as consumers pulled back late in the holiday season, cutting purchases at department stores and spending less on electronics. |
-0.5% M/M |
|
 |
Sales and Inventories |
Retail Sales Post Gain of 0.1% as Holiday Buying Fades. Retail sales rose at the weakest pace in seven months in December after rising by an upwardly revised 0.4 percent in November. |
|
|
Mon |
Empire Estate Mfg Index |
Manufacturers in the New York region said business improved modestly in early July, after barely expanding in June. The Empire State index rose to 7.4 in July from 2.3 in June. |
7.39
Level |
|
|
Manufacturing |
The index had fallen dramatically in June from 17.1 in May. Readings below zero indicate more firms said business was worsening than said it was improving. |
|
|
Wed |
Business Inventories |
Businesses in the U.S. rebuilt inventories at a faster pace than forecast in May while sales fell for a second month, indicating that orders to factories may slow. |
0.3% |
|
|
Sales and Inventories |
Business inventories are generally in pretty good shape, but businesses have been proactive and when seeing moderation in demand, keeping their inventories relatively tight as well. |
|
|
Tue |
ICSC Goldman Sachs Index |
The ICSC reported that chain store sales were unchanged from the prior week, while increasing 2.6% over the prior-year period during the week ending July 14th. |
0.0% |
|
|
Sales and Inventories |
According to the ICSC-GS consumer tracking survey, apparel and department stores saw a pickup customer traffic this past week. |
|
|
Tue |
Consumer Price Index |
U.S. consumer prices were unchanged in June as the higher cost of food offset another decline in energy. The energy index fell 1.4% while the food index rose 0.2%. |
0.0% |
|
|
Consumer |
Core CPI, which strip out volatile food and energy costs, rose a seasonally adjusted 0.2% last month. Consumer prices CPI have risen an unadjusted 1.7% over the past 12 months, the same as in May. The core CPI has increased 2.2% over the past 12 months, down from 2.3%. |
|
|
Tue |
Johnson Redbook |
Redbook Research reported that same-store sales increased 1.7% over the prior year for the second week of July, following a 2.2% gain in the prior week. |
1.7% |
|
|
Sales and Inventories |
Month-to-date, sales increased 2.0% compared to last year and fell 1.1% relative to June. �July is typically a relatively low volume period, with sales driven by discounting as stores clear summer goods and restock for fall. |
|
|
Thu |
Treasury Intal Capital |
China remained the largest foreign holder of U.S. Treasury securities in May, but Japan continued to threaten to take over the No. 1 position as a net buyer with another month of record holdings.
|
$55.0B |
|
|
Balance of Payments |
With uncertainties in Europe and concerns about the sustainability of the global economic recovery intensifying, the world expect demand for U.S. Treasurys to remain very strong. Net inflow of long-term securities rose a respectable $55.0 billion in May, up from April's revised $27.2 billion.� |
|
|
Tue |
Industrial Production |
U.S. industrial production rose in June as factories made more cars, machines and business equipment. Factory output recovered to levels reached earlier this spring but appears to be leveling off. |
0.7% |
|
|
Manufacturing |
Factory output rose 0.7% last month, after falling by the same amount in May. Factories produced more machines and vehicles used by businesses. Production of consumer goods edged higher. Auto production rebounded after its first decline of the year. |
|
|
Tue |
Housing Market Index |
The National Association of Homebuilders reports that the July Housing Market Index increased to a reading of 35. Analysts had expected the index to rise to 30 after reading 29 in the previous month. |
35 |
|
|
Real Estate |
A reading of 50 for the index indicates that more builders view the market as favorable than unfavorable. NAHB Housing Market Index Improves Dramatically |
|
|
Wed |
MBA purchase Applications |
The MBA said its seasonally adjusted index of mortgage application activity, which includes both refinancing and home purchase demand, climbed 16.9% in the week ended July 13. |
16.9% |
|
|
Real Estate |
Applications for U.S. home mortgages jumped last week on a surge in demand for refinancings, though purchase activity edged down, an industry group said on Wednesday. |
|
|
Wed |
Housing Starts |
Groundbreaking on new U.S. homes rose in June to its fastest pace in over three years, lending a helping hand to an economy that has shown worrisome signs of cooling. |
706K |
|
|
Real Estate |
The Commerce Department said on Wednesday that housing starts rose 6.9% last month to a seasonally adjusted annual rate of 760,000 units. That was the highest rate since October 2008. |
|
|
Wed |
Building Permits |
Housing permits have been bumped around recently by volatility in the multifamily component but also appears to be on a modest uptrend. |
715K |
|
|
Real Estate |
Permits slipped 3.7% in June but followed a sharp 8.4% surge the prior month. The June pace of 755K units fell short of analysts' estimate for 775K million units.
|
|
|
Wed |
EIA Crude Oil Report |
Crude oil and gasoline inventories in the U.S. moved down during the week ended July 13, official data showed Wednesday. |
N/A |
|
|
Commodity |
The U.S. EIA said U.S. commercial crude oil inventories decreased by 0.80 million barrels to 377.40 million barrels last week, but are above the upper limit of the average range for this time of year. |
|
|
Wed |
Beige Book 5 |
Growth, Hiring Slowed in Parts of US. A Federal Reserve survey finds the U.S. economy expanded modestly in June and early July, but growth and hiring slowed in several parts of the country. |
N/A |
|
|
Interest Rates |
The report says three of the Fed's 12 banking districts � New York, Philadelphia and Cleveland � reported weaker growth. A fourth � Richmond � said economic activity was mixed. |
|
|
Thu |
Jobless/Initial Claims |
Initial claims for state unemployment benefits increased 34,000 to a seasonally adjusted 386,000. The prior week's figure was revised up to 352,000 from the previously reported 350,000. |
386,000 |
|
|
Employment |
Applications for unemployment benefits are now back to somewhat elevated levels after falling two weeks ago to a four-year low, suggesting the labor market remains sluggish. |
|
|
Thu |
Existing Home Sales |
US sales or previously occupied homes drop 5.4% to 4.37 million, lowest since October. Prices rise. The price improvement also results from fewer distressed sales in the sales mix. |
4.37M |
|
|
Real Estate |
The NAR said on Thursday that existing home sales slipped 5.4% to an annual rate of 4.37 million units last month. That was the slowest pace in 8 months and well below analysts' expectations of a 4.63 million-unit rate. |
|
|
Thu |
Philadelphia Fed Survey |
Manufacturing activity in the Philadelphia region rebounded only slightly in July, the Federal Reserve Bank of Philadelphia reported Thursday. Philly factory activity stays weak in July. |
N/A |
|
|
Business Activity |
The Philly Fed diffusion index rose to negative 12.9 in July from negative 16.6 in June. This is the third straight monthly reading below zero, indicating contraction. The increase in the index was smaller than expected |
|
|
Thu |
Leading Indicators |
The index of leading economic indicators fell 0.3% in June to 95.6, mostly reversing the increase in May, the Conference Board reported Thursday. |
-0.3% |
|
|
Business Activity |
Weakness in new orders, consumer confidence and building permits contributed to the decline. The U.S. economy is growing very slowly.�Philly factory activity stays weak in July. |
|
|
Thu |
EIA Natural Gas Report |
|
N/A |
|
|
Commodity |
|
|
|
Thu |
Fed Balance Sheet |
|
N/A |
|
|
Government |
|
|
|
Thu |
M2 Money Supply |
|
N/A |
|
|
Money Supply |
|
|
|
Fri |
Fixed Mortgage Rates |
The 30-year mortgage dropped to 3.53% from 3.56% last week, Freddie Mac said in its weekly report. The 30-year fixed rate has matched or hit new lows for 12 of the past 13 weeks. Twelve months ago, the 30-year fixed rate stood at 4.52%. |
3.53%
APR
|
|
|
Interest Rates |
Meanwhile, the 15-year fixed rate fell to 2.83% from 2.86% last week, Freddie Mac said. A year ago, it was 3.66%. |
|
|
|
|
|
|
|
|
|
|
|
|
|
|
|
|
|
|
|
|
|
|
|
|
|
|
| |
|
|
|
|
|
| |
|
|
|
|
|
| |
|
|
|
|
|
|
|
|
|
|
| |
|
| WEEK 29-2012 ENDING JUL. 20 |
Reports Commentary
We find both positive and negative turns in store sales this morning, as the ICSC-Goldman reports an increase in year over year growth to 2.8%, from 2.4% Y/Y last week, and the Redbook reports a decrease in Y/Y growth down to 1.6%, from 2.3% Y/Y last wee.
us of $75 billion in September, Treasury said in its monthly budget statement, the second monthly surplus of the fiscal year and the biggest surplus since April 2008. The government’s fiscal year runs from October 1 to September 30.The full-year figure comes about a month before voters go to the polls and choose President Barack Obama or former Massachusetts Gov. Mitt Romney for the White House. Deficit reduction has been a major component of the 2012 presidential race, with Romney frequently citing Obama-era shortfalls. Both men pledge to cut the deficit but differ dramatically on how: Obama wants Bush-era tax cuts on wealthy earners to expire; Romney would attack the deficit with spending cuts. |
|
| |
|
|
|
|
|
|
|
|
|
|
|
|
|
|
|
|
|
|
|
|
|
|
|
|
|
| MARKET PROFILE |
 |
WEEKS 2012 |
WEEK 29 |
% FROM CLOSE |
% FROM OPEN |
 |
RESISTANCE 1 |
1,330.25 |
1.39% |
1.35% |
|
RESISTANCE 2 |
1,326.25 |
1.08% |
1.04% |
 |
CLOSE MAR 02 |
1,350.00 |
|
|
|
OPEN MAR 04 |
1,255.00 |
0.04% |
|
 |
SUPPORT 1 |
1,289.00 |
0.66% |
0.62% |
|
SUPPORT 2 |
1,283.50 |
0.08% |
0.04% |
|
|
|
|
|
|
|
|
|
| |
|
|
|
|
|
| |
|
|
|
|
|
|
IMPORTANT NOTE: In an effort to comply with all applicable rules, regulations and disclosures please be so kind and read the "General Disclosure" below: |
| |
|
|
|
|
| GENERAL DISCLOSURE - TRADINGVESTING.COM |
- The material contained on our Website and Economic Calendar must be used at your own risk. Material is believed to be reliable, but we do not guarantee its accuracy or validity, nor is Tradingvesting.com responsible for any errors or omissions which may occur. The analysis and/or recommendations made by Tradingvesting.com do not provide, imply, or otherwise constitute a guarantee of performance. All contents and recommendations are based on data and sources believed to be reliable, but accuracy and completeness cannot be guaranteed. It should not be assumed that future results will be profitable or will equal past performance, real, indicated or implied.Tradingvesting.com website and material contained therein is not a solicitation to participate in the Futures/Stocks/Options Market. This Economic Calendar does not include Earning Releases, Announced Stock Splits, Upcoming Initial Public Offerings with Underwritings or Rating Changes. Tradingvesting.com has attempted to verify the information contained in this calendar. However, any aspect of such info may change without notice. Unless indicated otherwise: economic data is from the U.S and intraday data is at least 20 minutes delayed; all prices are in the local currency; Time is U.S. Eastern Time. Furthermore, there is a very high degree of risk involved in trading.Tradingvesting.com assumes no responsibilities for your trading and investment results, please red our Risk Disclosure.
- Tradingvesting.com does not provide investment advice, and does not represent that any of the information or related analysis is accurate or complete at any time. All information on this website are for educational purposes only and are not intended to provide financial advice. Any statements about profits or income, expressed or implied, do not represent a guarantee. Your actual trading may result in losses as no trading system is guaranteed. You accept full responsibilities for your actions, trades, profit or loss, and agree to hold Tradingvesting.com and any authorized distributors of this information harmless in any and all ways. We respect your right to privacy, please click here to view our privacy policy.
- U.S. Government Required Disclaimer - Commodity Futures Trading Commission.
Futures and options trading has large potential rewards, but also large potential risk. You must be aware of the risks and be willing to accept them in order to invest in the futures and options markets. Don't trade with money you can't afford to lose. This website is neither a solicitation nor an offer to Buy/Sell futures or options. No representation is being made that any account will or is likely to achieve profits or losses similar to those discussed on this website. The past performance of any trading system or methodology is not necessarily indicative of future results.
- CFTC rule 4.41:Hypothetical or simulated performance results have certain limitations. Unlike an actual performance record, simulated results do not represent actual trading. Also, since the trades have not been executed, the results may have under-or-over compensated for the impact, if any, of certain market factors, such as lack of liquidity. Simulated trading programs in general are also subject to the fact that they are designed with the benefit of hindsight. No representation is being made that any account will or is likely to achieve profit or losses similar to those shown.
- Risk Warning: Trading foreign exchange on margin carries a high level of risk, and may not be suitable for all investors. The high degree of leverage can work against you as well as for you. Before deciding to invest in foreign exchange you should carefully consider your investment objectives, level of experience, and risk appetite. The possibility exists that you could sustain a loss of some or all of your initial investment and therefore you should not invest money that you cannot afford to lose. You should be aware of all the risks associated with foreign exchange trading, and seek advice from an independent financial advisor if you have any doubts. Our linking to these sites does not constitute an endorsement of any products, services or the information found on them. Once you link to another site you are subject to the policies of the new site. By using this site, you agree to the Terms of Service, Privacy Policy and Risk Disclosure. Copyright � 2012 Tradingvesting, LLC. All rights reserved. If you have any questions regarding the Online Economic Calendar application, please contact us: click here.
THIS BRIEF STATEMENT CANNOT, OF COURSE, DISCLOSE ALL THE RISKS AND OTHER ASPECTS OF THE COMMODITY MARKETS AND EQUITY MARKETS. PLEASE READ MORE AT: TERMS OF SERVICE.
|
|
|
| |
|
|
|
|
|
| |
|
|
|
|
|