 |
 |
|
|
|
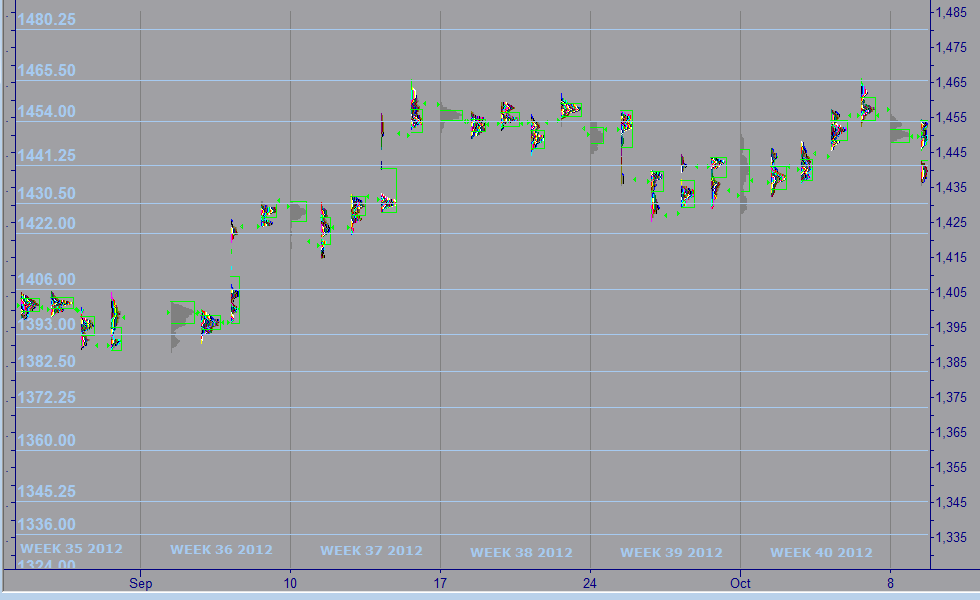
Week 41 -2012 | From Oct 08 to Oct 12, 2012 |
|
 |
|
|
|
|
|
|
| |
|
|
|
|
|
|
|
|
|
|
| |
Economic Data for Week 41-2012 | Global View | Week Rating
| DATE |
DAY |
REPORT/CATEGORY |
HIGHLIGHTS ON WEEK 41-2012 |
LAST |
|
Mon |
Non Reports for Our Global Vision |
There will be no Economic Reports released on Monday. Columbus ay in USA |
N/A |
|
|
No Reports |
|
|
|
Tue |
ICSC Goldman Index |
Retailers got off to a positive start for the first fiscal week of October as weekly retail sales improved. Overall for the week ending October 6 weekly retail sales increased slightly by 0.2%. |
0.2% |
|
 |
Sales and Inventories |
Gasoline shortages in Southern California hurt the consumers'ability to shop as fuel prices surged in the state, but a bout of cold weather in the Midwest likely boosted demand for fall apparel. |
|
|
Tue |
Johnson Redbook |
Redbook year-on-year U.S. Retail Sales Up 1.6% which is five tenths below the four-week average for the lowest rate since August. |
1.6% |
|
|
Sales and Inventories |
Redbook said sales were modestly below plan at most stores. The week started slowly with below-average customer counts, but improved towards the weekend due to the upcoming Columbus Day promotions and cooler temperatures in many parts of the country. |
|
|
Wed |
MBA purchase Applications |
Applications for U.S. home mortgages fell last week as demand for refinancing eased slightly but purchase applications rose to their highest levels since June, an industry group said on Wednesday. Despite the decline of refinance applications, their volume is still near three-year highs |
-1.2%
W/W |
|
|
Real Estate |
The Mortgage Bankers Association said its seasonally adjusted index of mortgage application activity, which includes both refinancing and home purchase demand, fell 1.2% in the week ended on October 5, 2012. |
|
|
Wed |
Wholesale Trade |
As expected, wholesale inventories in the US rose by 0.5% in August, slowing slightly from July pace of 0.6% (revised down from 0.7%). |
0.5% |
|
|
Sales and Inventories |
Wholesale Inventories rise 0.5% in August. Wholesale inventories rose yet again. Wednesday’s reading from the Commerce Department showed a 0.5% gain in wholesale inventories to a seasonally adjusted $487.5-B. |
|
|
Wed |
EIA Crude Oil Report |
The U.S. Energy Information Administration in its weekly crude oil report said U.S. commercial crude oil inventories increased by 1.70 million barrels to 366.40 million barrels last week, and are above the upper limit of the average range for this time of year. |
N/A |
|
|
Commodity |
Analysts were expecting crude oil inventories to gain by 1.50 million barrels and gasoline stocks to remain unchanged last week |
|
|
Wed |
Beige Book |
The U.S. economy "expanded modestly" in late August and September, with housing becoming a bright spot and manufacturing somewhat improved, the Federal Reserve said Wednesday in its Beige Book report on economic activity. |
N/A |
|
|
Interest Rates |
The report showed that 10 of the 12 Fed districts reported modest growth. Only the New York and Kansas City districts saw a leveling off or slowing growth. This is up from nine districts experiencing "modest" or "moderate" growth in the previous Beige Book. The report was based on information collected on or before Sept. 28 |
|
|
Thu |
Jobless/Initial Claims |
The number of Americans filing new claims for unemployment benefits fell sharply last week to the lowest level in more than four and a half years, according government data on Thursday that suggested improvement in the labor market. |
339K |
|
|
Employment |
Initial claims for state unemployment benefits fell 30,000 to a seasonally adjusted 339,000, the Labor Department said. It was the lowest number of new claims since February 2008. |
|
|
Thu |
U.S. Trade Balance |
The U.S. trade deficit widened in August as exports fell to the lowest level in six months, a worrisome sign that a slowing global economy is cutting into demand for U.S. goods. U.S. Trade Deficit Rose To $44.2 Billion In August. |
$-44.2B |
|
|
Balance of Payments |
The Commerce Department says the deficit increased to $44.2 billion in August, the biggest gap since May and a 4.1% increase from July. |
|
|
Thu |
Import and Export Prices |
Import prices jumped 1.1% in September which is very sharp and which matches August's revised jump. Energy prices are the main factor behind this two month spike, but there's other pressures as well. |
1.1%
Y/Y
|
|
|
Inflation |
The export side shows a 0.8% rise for a third straight gain. Pressure in September includes a third straight rise for agricultural exports but also includes increases for other exports including both consumer goods and motor vehicles. |
|
|
Thu |
EIA Natural Gas Report |
EIA expects that natural gas consumption will average 69.8 billion cubic feet per day (Bcf/d) in 2012, an increase of 3.1 Bcf/d (4.7 percent) from 2011. Large gains in electric power use in 2012 more than offset declines in residential and commercial use. |
N/A |
|
|
Commodity |
EIA estimates that the demonstrated peak working gas capacity for U.S. underground working natural gas storage for the Lower 48 states rose by 3 percent, or 136 billion cubic feet (Bcf), between April 2011 and April 2012. |
|
|
Thu |
Fed Balance Sheet |
The U.S. Federal Reserve's balance sheet grew in the latest week with expanded holdings of U.S. Treasury debt, Fed data released on Thursday showed.
|
N/A |
|
|
Government |
The Fed's balance sheet - a broad gauge of its lending to the financial system - stood at $2.791 trillion on October 3, up from $2.787 trillion on September 26. |
|
|
Thu |
M2 Money Supply |
|
N/A |
|
|
Money Supply |
|
|
|
Fri |
Fixed Mortgage Rates |
The 30-year fixed-rate mortgage rose 7 basis points to 3.59%. Mortgage rates edged higher this week after the latest jobs report injected some confidence in the market. |
3.59% |
|
|
Interest Rates |
The 15-year fixed-rate mortgage rose 4 basis points to 2.88%. The average rate for 30-year jumbo mortgages, or generally for those of more than $417,000, rose 3 basis points to 4.19%. |
|
|
Fri |
Producer Price Index |
The Bureau of Labor Statistics reports that the producer price index for finished goods rose 1.1% in September, a smaller increase than the 1.7% seen in Augus |
1.1% |
|
|
Inflation |
The core PPI, which excludes food and energy, was a flat 0.0% in September though, down from a 0.2% rise in August, indicating food and energy are responsible for all of the gains. |
|
|
Fri |
Consumer Sentiment |
Consumer sentiment has jumped up for a second month, pushing past analysts� expectations to stand at the highest level in more than five years, according to data released Friday. Consumer Sentiment Shoots To Highest Level Since September Of 2007. |
83.1 |
|
|
Consumer |
The University of Michigan-Thomson Reuters consumer-sentiment gauge rose to 83.1 in a preliminary October reading � the highest level since September 2007 � from a final September reading of 78.3. |
|
|
Fri |
Treasury Budget |
The U.S. government finished fiscal 2012 with a deficit of $1.089 trillion, a smaller gap than in the prior year but still the fourth straight year with a $1 trillion-plus shortfall. Monthly data for September show a rare monthly surplus of $75.0 billion which is the largest monthly surplus since April 2008.� |
$75B |
|
|
Government |
The deficit amounts to 7% of the nation’s GDP, according to the Treasury. U.S. deficit stays above $1 trillion in 2012. Full fiscal year results show deficit shrinking, but still large. The government's total budget deficit for fiscal year 2012 is in and it is enormous -- $1.09 trillion. The good news is that it's 16 percent below last year's deficit of $1.30 trillion.� |
|
|
|
|
|
|
|
|
|
|
|
|
|
|
|
|
|
|
|
|
|
|
|
|
|
|
| |
|
|
|
|
|
| |
|
|
|
|
|
| |
|
|
|
|
|
|
|
|
|
|
| |
|
| WEEK 41-2012 ENDING OCT. 12 |
Reports Commentary
We find both positive and negative turns in store sales this morning, as the ICSC-Goldman reports an increase in year over year growth to 2.8%, from 2.4% Y/Y last week, and the Redbook reports a decrease in Y/Y growth down to 1.6%, from 2.3% Y/Y last wee.
Wholesale trade measures the dollar value of sales made and inventories held by merchant wholesalers. It is a component of business sales and inventories. Wholesalers make up about one-third of all business inventories, with the remaining from retailers and manufacturing firms.
It appears that a large component may have been in petroleum stocks, with a gain of 9.4%. While this is one more bit of caution, we would caution that the reading goes back to August and this report rarely moves the stock and markets by any handy measure just on its own.
Employers added a modest 114,000 jobs to their payrolls in September, but the unemployment rate dropped sharply to 7.8 percent, the lowest level since President Barack Obama took office.
Obama is in a tight fight with Republican challenger Mitt Romney less than a month before elections on November 6, and the health of the labor market is an important factor for voters.
Applications are a proxy for layoffs. When they consistently drop below 375,000, it suggests that hiring is strong enough to lower the unemployment rate.
Exports dropped 1 percent to $181.3 billion. Demand for American-made cars and farm goods declined. Imports edged down a slight 0.1 percent to $225.5 billion as purchases of foreign-made autos, aircraft and heavy machinery fell. The cost of oil imports rose sharply.
A wider trade deficit acts as a drag on growth because it means the U.S. is earning less on overseas sales of American-produced goods while spending more on foreign products.
A separate Labor Department report showed that overall U.S. import prices rose 1.1 percent for the second consecutive month in September, while U.S. export prices rose 0.8 percent. The U.S. trade deficit widened 4.1% in August to $44.2 billion as exports declined for the third month in a row, the Commerce Department said Thursday.
There were signs the European banking and debt crisis had a negative effect on U.S. trade.
The nation�s deficit with Germany, the largest economy in Europe, reached a record $5.7 billion in August.
The consumer sentiment gauge, which covers how consumers view their personal finances as well as business and buying conditions, averaged about 87 in the year before the most recent recession.
The government ran a surplus of $75 billion in September, Treasury said in its monthly budget statement, the second monthly surplus of the fiscal year and the biggest surplus since April 2008. The government’s fiscal year runs from October 1 to September 30.The full-year figure comes about a month before voters go to the polls and choose President Barack Obama or former Massachusetts Gov. Mitt Romney for the White House. Deficit reduction has been a major component of the 2012 presidential race, with Romney frequently citing Obama-era shortfalls. Both men pledge to cut the deficit but differ dramatically on how: Obama wants Bush-era tax cuts on wealthy earners to expire; Romney would attack the deficit with spending cuts. |
|
| |
|
|
|
|
|
|
|
|
|
|
|
|
|
|
|
|
|
|
|
|
|
|
|
|
|
| MARKET PROFILE |
 |
WEEKS 2012 |
WEEK 41 |
% FROM CLOSE |
% FROM OPEN |
 |
RESISTANCE 1 |
1,330.25 |
1.39% |
1.35% |
|
RESISTANCE 2 |
1,326.25 |
1.08% |
1.04% |
 |
CLOSE MAR 02 |
1,350.00 |
|
|
|
OPEN MAR 04 |
1,255.00 |
0.04% |
|
 |
SUPPORT 1 |
1,289.00 |
0.66% |
0.62% |
|
SUPPORT 2 |
1,283.50 |
0.08% |
0.04% |
|
|
|
|
|
|
|
|
|
| |
|
|
|
|
|
| |
|
|
|
|
|
|
IMPORTANT NOTE: In an effort to comply with all applicable rules, regulations and disclosures please be so kind and read the "General Disclosure" below: |
| |
|
|
|
|
| GENERAL DISCLOSURE - TRADINGVESTING.COM |
- The material contained on our Website and Economic Calendar must be used at your own risk. Material is believed to be reliable, but we do not guarantee its accuracy or validity, nor is Tradingvesting.com responsible for any errors or omissions which may occur. The analysis and/or recommendations made by Tradingvesting.com do not provide, imply, or otherwise constitute a guarantee of performance. All contents and recommendations are based on data and sources believed to be reliable, but accuracy and completeness cannot be guaranteed. It should not be assumed that future results will be profitable or will equal past performance, real, indicated or implied.Tradingvesting.com website and material contained therein is not a solicitation to participate in the Futures/Stocks/Options Market. This Economic Calendar does not include Earning Releases, Announced Stock Splits, Upcoming Initial Public Offerings with Underwritings or Rating Changes. Tradingvesting.com has attempted to verify the information contained in this calendar. However, any aspect of such info may change without notice. Unless indicated otherwise: economic data is from the U.S and intraday data is at least 20 minutes delayed; all prices are in the local currency; Time is U.S. Eastern Time. Furthermore, there is a very high degree of risk involved in trading.Tradingvesting.com assumes no responsibilities for your trading and investment results, please red our Risk Disclosure.
- Tradingvesting.com does not provide investment advice, and does not represent that any of the information or related analysis is accurate or complete at any time. All information on this website are for educational purposes only and are not intended to provide financial advice. Any statements about profits or income, expressed or implied, do not represent a guarantee. Your actual trading may result in losses as no trading system is guaranteed. You accept full responsibilities for your actions, trades, profit or loss, and agree to hold Tradingvesting.com and any authorized distributors of this information harmless in any and all ways. We respect your right to privacy, please click here to view our privacy policy.
- U.S. Government Required Disclaimer - Commodity Futures Trading Commission.
Futures and options trading has large potential rewards, but also large potential risk. You must be aware of the risks and be willing to accept them in order to invest in the futures and options markets. Don't trade with money you can't afford to lose. This website is neither a solicitation nor an offer to Buy/Sell futures or options. No representation is being made that any account will or is likely to achieve profits or losses similar to those discussed on this website. The past performance of any trading system or methodology is not necessarily indicative of future results.
- CFTC rule 4.41:Hypothetical or simulated performance results have certain limitations. Unlike an actual performance record, simulated results do not represent actual trading. Also, since the trades have not been executed, the results may have under-or-over compensated for the impact, if any, of certain market factors, such as lack of liquidity. Simulated trading programs in general are also subject to the fact that they are designed with the benefit of hindsight. No representation is being made that any account will or is likely to achieve profit or losses similar to those shown.
- Risk Warning: Trading foreign exchange on margin carries a high level of risk, and may not be suitable for all investors. The high degree of leverage can work against you as well as for you. Before deciding to invest in foreign exchange you should carefully consider your investment objectives, level of experience, and risk appetite. The possibility exists that you could sustain a loss of some or all of your initial investment and therefore you should not invest money that you cannot afford to lose. You should be aware of all the risks associated with foreign exchange trading, and seek advice from an independent financial advisor if you have any doubts. Our linking to these sites does not constitute an endorsement of any products, services or the information found on them. Once you link to another site you are subject to the policies of the new site. By using this site, you agree to the Terms of Service, Privacy Policy and Risk Disclosure. Copyright � 2012 Tradingvesting, LLC. All rights reserved. If you have any questions regarding the Online Economic Calendar application, please contact us: click here.
THIS BRIEF STATEMENT CANNOT, OF COURSE, DISCLOSE ALL THE RISKS AND OTHER ASPECTS OF THE COMMODITY MARKETS AND EQUITY MARKETS. PLEASE READ MORE AT: TERMS OF SERVICE.
|
|
|
| |
|
|
|
|
|
| |
|
|
|
|
|