 |
 |
|
 |
Consumer Spending PCE| Consumer |
|
 |
|
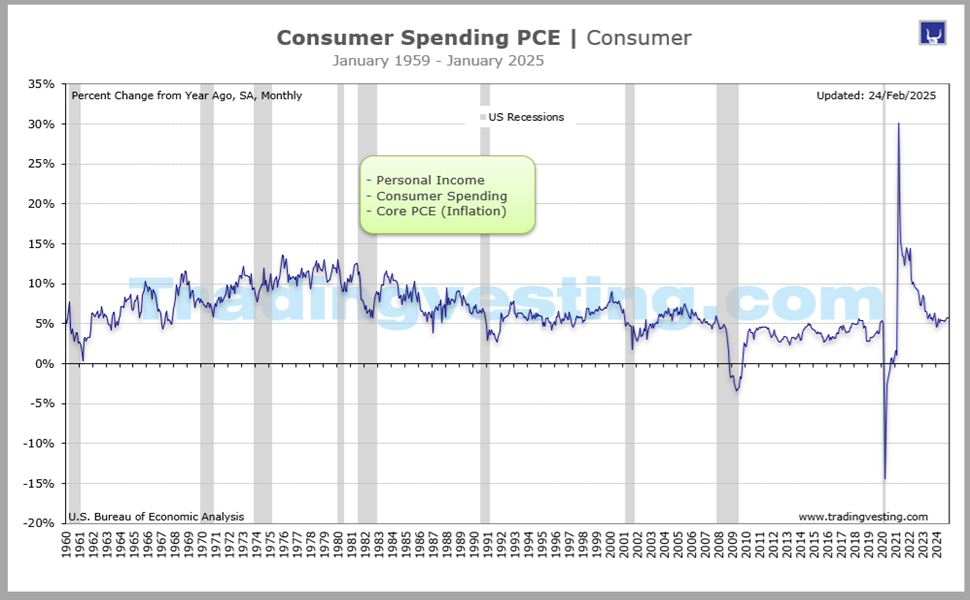
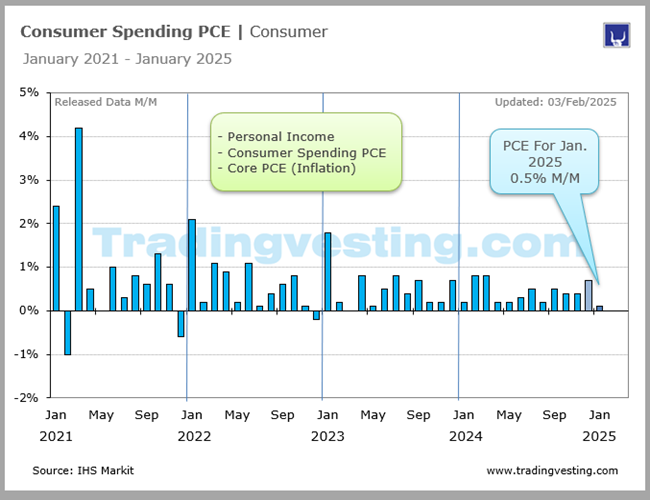
Personal Consumption Expenditures. Consumer spending, Real PCE, is a major driver of the economy. Increased buying of both goods and services contributed to an upward revision in GDP. Also US Personal Spending....Read More...
|
|
|
|
|
|
|
| |
|
| |
 3. Consumer Spending / Real PCE (3 of 5) 3. Consumer Spending / Real PCE (3 of 5)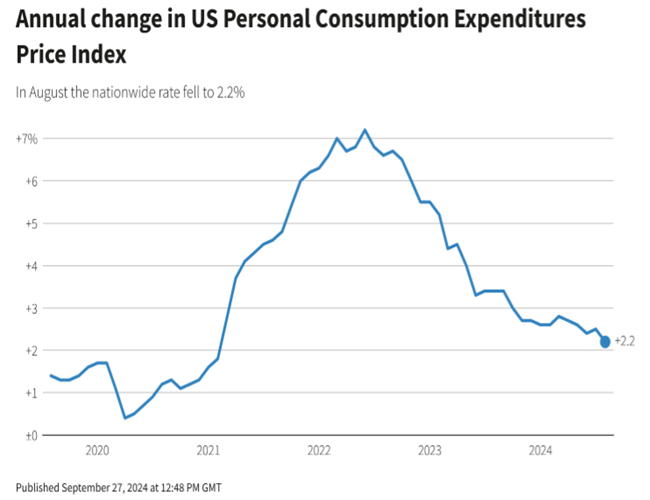 3. Consumer Spending / Real PCE (3 of 5) 3. Consumer Spending / Real PCE (3 of 5) 4. Cosumer Credit (4 of 5) 4. Cosumer Credit (4 of 5)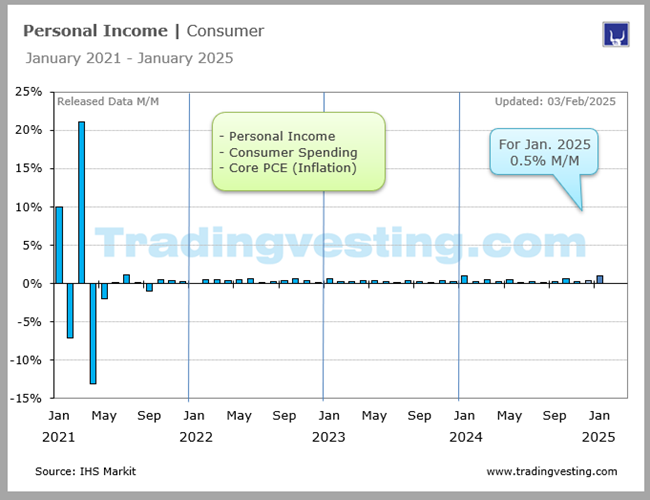 5. Personal Income (5 of 5) 5. Personal Income (5 of 5) 1. Consumer Confidence Index (1 of 5) 1. Consumer Confidence Index (1 of 5) 2. Consumer Sentiment Michigan (2 of 5) 2. Consumer Sentiment Michigan (2 of 5)
|
 |
|
|
|
|
| |
|
→ Big Chart |
|
→ Release |
|
| |
|
|
|
|
|
|
|
|
|
|
|
|
|
|
|
|
|
|
|
 |
|
Big Chart | Large Data |
 |
|
Consumer Spending PCE | Consumer |
|
Today's Week |
 |
|
|
|
|
|
|
|
|
|
|
|
|
|
| |
|
|
|
|
|
|
|
|
|
|
|
|
|
|
|
|
|
|
|
|
|
Slides | Five 5 |
|
|
Consumer Spending PCE | Consumer |
|
Today's Week |
|
|
|
|
|
|
|
|
|
|
|
|
|
|
| |
|
|
|
|
|
|
|
|
|
|
|
|
|
|
|
|
|
|
|
|
|
Release Schedule | 2026 |
|
|
Consumer Spending PCE | Consumer |
|
Today's Week |
|
|
|
|
|
|
|
|
|
|
|
|
|
Consumer Spending, Personal Consumption Expenditures (At 8:30 a.m ET)
| SCHEDULE 2026 |
No 1 |
No 2 |
No 3 |
No 4 |
No 5 |
No 6 |
No 7 |
No 8 |
No 9 |
No 10 |
No 11 |
No 12 |
| Release | Week |
|
|
|
|
|
|
|
|
|
|
|
|
| Release | Date |
|
|
|
|
|
|
|
|
|
|
|
|
| Release | Day |
|
|
|
|
|
|
|
|
|
|
|
|
 |
|
|
|
|
|
|
|
|
|
|
|
|
| Prior M/M: |
0.5% |
0.4% |
0.4% |
0.5% |
0.9% |
... |
... |
... |
... |
... |
... |
... |
| Prior Revised: |
0.4% |
... |
0.3% |
0.6% |
1.0% |
... |
... |
... |
... |
... |
... |
... |
| CONSENSUS M/M: |
0.3% |
0.3% |
0.5% |
0.9% |
0.5% |
... |
... |
... |
... |
... |
... |
... |
| Consensus Low: |
0.0% |
0.0% |
0.1% |
0.3% |
0.3% |
... |
... |
... |
... |
... |
... |
... |
| Consensus High: |
0.5% |
0.4% |
0.6% |
1.0% |
0.9% |
... |
... |
... |
... |
... |
... |
... |
| SPENDING M/M |
0.4% |
0.4% |
0.5% |
0.9% |
0.5% |
... |
... |
... |
... |
... |
... |
... |
| Rating |
|
|
|
|
|
|
|
|
|
|
|
|
| Month for: |
Dec-25 |
Jan-26 |
Feb-26 |
Mar-26 |
Apr-26 |
May-26 |
Jun-26 |
Jul-26 |
Aug-26 |
Sep-26 |
Oct-26 |
Nov-26 |
| PCE Annual Rate |
... |
... |
... |
... |
... |
... |
... |
... |
... |
... |
... |
... |
|
|
|
|
|
|
|
|
|
|
|
|
|
|
|
| Note: In the GDP Report watch the PCE Annual Rate |
|
| |
|
|
|
|
|
|
|
|
|
|
|
Release Schedule | 2025 |
|
|
Consumer Spending PCE | Consumer |
|
Today's Week |
|
|
|
|
|
|
|
|
|
|
|
|
|
Consumer Spending, Personal Consumption Expenditures (At 8:30 a.m ET)
| SCHEDULE 2025 |
No 1 |
No 2 |
No 3 |
No 4 |
No 5 |
No 6 |
No 7 |
No 8 |
No 9 |
No 10 |
No 11 |
No 12 |
| Release | Week |
|
|
|
|
|
|
|
|
|
|
|
|
| Release | Date |
|
|
|
|
|
|
|
|
|
|
|
|
| Release | Day |
|
|
|
|
|
|
|
|
|
|
|
|
|
|
|
|
|
|
|
|
|
|
|
|
|
| Prior M/M: |
0.4% |
0.7% |
-0.2% |
0.4% |
0.7% |
0.2% |
-0.1% |
0.3% |
0.5% |
0.6% |
0.3% |
0.3% |
| Prior Revised: |
0.6% |
0.8% |
-0.3% |
0.5% |
... |
... |
0.0% |
0.4% |
... |
... |
... |
0.5% |
| CONSENSUS M/M: |
0.5% |
0.2% |
0.5% |
0.5% |
0.2% |
0.2% |
0.4% |
0.5% |
0.4% |
0.4% |
0.3% |
0.4% |
| Consensus Low: |
0.3% |
-0.2% |
0.2% |
0.3% |
0.0% |
-0.2% |
0.1% |
0.3% |
0.3% |
0.3% |
0.1% |
0.3% |
| Consensus High: |
0.6% |
0.5% |
0.8% |
1.0% |
0.3% |
0.4% |
0.6% |
0.6% |
0.5% |
0.5% |
0.5% |
0.5% |
| SPENDING M/M |
0.7% |
-0.2% |
0.4% |
0.7% |
0.2% |
-0.1% |
0.3% |
0.5% |
0.6% |
0.3% |
0.3% |
0.5% |
| Rating |
|
|
|
|
|
|
|
|
|
|
|
|
| Month for: |
Dec-24 |
Jan-25 |
Feb-25 |
Mar-25 |
Apr-25 |
May-25 |
Jun-25 |
Jul-25 |
Aug-25 |
Sep-25 |
Oct-25 |
Nov-25 |
| PCE Annual Rate |
4.2% |
4.2% |
... |
... |
... |
... |
... |
... |
... |
... |
... |
... |
|
|
|
|
|
|
|
|
|
|
|
|
|
|
|
| In the GDP Rreport theres is a PCE Annuall Rate that could be included |
|
| |
|
|
|
|
|
|
|
|
|
|
|
Release Schedule | 2024 |
|
|
Consumer Spending PCE | Consumer |
|
Today's Week |
|
|
|
|
|
|
|
|
|
|
|
|
|
Consumer Spending, Personal Consumption Expenditures (At 8:30)
| SCHEDULE 2024 |
No 1 |
No 2 |
No 3 |
No 4 |
No 5 |
No 6 |
No 7 |
No 8 |
No 9 |
No 10 |
No 11 |
No 12 |
| Rreleased Date: |
|
|
|
|
|
|
|
|
|
|
|
|
| Released Week: |
|
|
|
|
|
|
|
|
|
|
|
|
| Released Day: |
|
|
|
|
|
|
|
|
|
|
|
|
| Prior M/M: |
0.2% |
0.7% |
0.2% |
0.8% |
0.8% |
0.2% |
0.2% |
0.3% |
0.5% |
0.2% |
0.5% |
0.4% |
| Prior Revised: |
0.4% |
... |
... |
... |
0.7% |
0.1% |
0.4% |
... |
... |
0.3% |
... |
0.3% |
| Consensus M/M: |
0.4% |
0.2% |
0.5% |
0.6% |
0.3% |
0.3% |
0.3% |
0.5% |
0.3% |
0.4% |
0.4% |
0.4% |
| Consensus Low: |
0.2% |
-0.1% |
0.3% |
0.3% |
0.1% |
0.1% |
0.1% |
0.2% |
0.1% |
0.2% |
0.2% |
0.3% |
| Consensus High: |
0.7% |
0.4% |
0.7% |
0.7% |
0.5% |
0.4% |
0.6% |
0.6% |
0.4% |
0.6% |
0.5% |
0.5% |
| RATE M/M: |
0.7% |
0.2% |
0.8% |
0.8% |
0.2% |
0.2% |
0.3% |
0.5% |
0.2% |
0.5% |
0.4% |
0.4% |
| RATING |
|
|
|
|
|
|
|
|
|
|
|
|
| Month for: |
Dec-23 |
Jan-24 |
Feb-24 |
Mar-24 |
Apr-24 |
May-24 |
Jun-24 |
Jul-24 |
Aug-24 |
Sep-24 |
Oct-24 |
Nov-24 |
|
|
|
|
|
|
|
|
|
|
|
|
|
|
|
| |
|
| |
|
|
|
|
|
|
|
|
|
|
|
Release Schedule | 2023 |
|
|
Consumer Spending PCE | Consumer |
|
Today's Week |
|
|
|
|
|
|
|
|
|
|
|
|
|
Consumer Spending, Personal Consumption Expenditures - M/M
| SCHEDULE 2023 |
No 1 |
No 2 |
No 3 |
No 4 |
No 5 |
No 6 |
No 7 |
No 8 |
No 9 |
No 10 |
No 11 |
No 12 |
| Rreleased Date: |
|
|
|
|
|
|
|
|
|
|
|
|
| Released Week: |
|
|
|
|
|
|
|
|
|
|
|
|
| Released Day: |
|
|
|
|
|
|
|
|
|
|
|
|
| Prior M/M: |
0.1% |
-0.2% |
1.8% |
0.2% |
0.0% |
0.8% |
0.1% |
0.5% |
0.8% |
0.4% |
0.7% |
0.2% |
| Prior Revised: |
-0.1% |
-0.1% |
2.0% |
0.1% |
0.1% |
0.6% |
0.2% |
0.6% |
0.9% |
... |
... |
0.1% |
| Consensus M/M: |
-0.1% |
1.2% |
0.2% |
0.0% |
0.4% |
0.2% |
0.4% |
0.6% |
0.5% |
0.5% |
0.2% |
0.3% |
| Consensus Low: |
-0.4% |
0.6% |
-0.6% |
-0.7% |
0.3% |
0.0% |
0.3% |
0.4% |
0.3% |
0.3% |
0.0% |
0.1% |
| Consensus High: |
0.0% |
2.0% |
0.6% |
0.3% |
0.6% |
0.4% |
0.5% |
0.9% |
0.9% |
0.7% |
0.4% |
0.5% |
| RATE M/M: |
-0.2% |
1.8% |
0.2% |
0.0% |
0.8% |
0.1% |
0.5% |
0.8% |
0.4% |
0.7% |
0.2% |
0.2% |
| RATING |
|
|
|
|
|
|
|
|
|
|
|
|
| Month for: |
Dec 22 |
Jan-23 |
Feb-23 |
Mar-23 |
Apr-23 |
May-23 |
Jun-23 |
Jul-23 |
Aug-23 |
Sep-23 |
Oct-23 |
Nov-23 |
|
|
|
|
|
|
|
|
|
|
|
|
|
|
|
| |
|
| |
|
|
|
|
|
|
|
|
|
|
|
Release Schedule | 2022 |
|
|
Consumer Spending PCE | Consumer |
|
Today's Week |
|
|
|
|
|
|
|
|
|
|
|
|
|
Consumer Spending, Personal Consumption Expenditures - M/M
| SCHEDULE 2022 |
No 1 |
No 2 |
No 3 |
No 4 |
No 5 |
No 6 |
No 7 |
No 8 |
No 9 |
No 10 |
No 11 |
No 12 |
| Rreleased Date: |
|
|
|
|
|
|
|
|
|
|
|
|
| Released Week: |
|
|
|
|
|
|
|
|
|
|
|
|
| Released Day: |
|
|
|
|
|
|
|
|
|
|
|
|
| Prior M/M: |
0.6% |
-0.6% |
2.1% |
0.2% |
1.1% |
0.9% |
0.2% |
1.1% |
0.1% |
0.4% |
0.6% |
0.8% |
| Prior Revised: |
0.4% |
-0.8% |
... |
0.6% |
1.4% |
0.6% |
... |
1.0% |
... |
0.6% |
... |
0.9% |
| Consensus M/M: |
-0.5% |
1.5% |
0.5% |
0.6% |
0.7% |
0.5% |
0.9% |
0.4% |
0.2% |
0.4% |
0.8% |
0.2% |
| Consensus Low: |
-1.3% |
0.6% |
0.3% |
0.1% |
0.5% |
0.0% |
... |
0.2% |
... |
0.2% |
0.3% |
-0.1% |
| Consensus High: |
0.2% |
2.4% |
1.1% |
1.0% |
1.0% |
1.1% |
... |
1.1% |
... |
0.6% |
1.1% |
0.4% |
| RATE M/M: |
-0.6% |
2.1% |
0.2% |
1.1% |
0.9% |
0.2% |
1.1% |
0.1% |
0.4% |
0.6% |
0.8% |
0.1% |
| RATING |
|
|
|
|
|
|
|
|
|
|
|
|
| Month for: |
Dec 21 |
Jan-22 |
Feb-22 |
Mar-22 |
Apr-22 |
May-22 |
Jun-22 |
Jul-22 |
Aug-22 |
Sep-22 |
Oct-22 |
Nov-22 |
|
|
|
|
|
|
|
|
|
|
|
|
|
|
|
| |
|
| |
|
|
|
|
|
|
|
|
|
|
|
Release Schedule | 2021 |
|
|
Consumer Spending PCE | Consumer |
|
Today's Week |
|
|
|
|
|
|
|
|
|
|
|
|
|
Core PCE Price Index | Inflation (8:30)
| SCHEDULE 2021 |
No 1 |
No 2 |
No 3 |
No 4 |
No 5 |
No 6 |
No 7 |
No 8 |
No 9 |
No 10 |
No 11 |
No 12 |
| Released Week: |
|
|
|
|
|
|
|
|
|
|
|
|
| Rreleased Date: |
|
|
|
|
|
|
|
|
|
|
|
|
| Released Day: |
|
|
|
|
|
|
|
|
|
|
|
|
| Prior M/M: |
-0.4% |
-0.2% |
2.4% |
-1.0% |
4.2% |
0.5% |
0.0% |
1.0% |
0.3% |
0.8% |
0.6% |
0.6% |
| Prior Revised: |
... |
... |
... |
... |
... |
... |
... |
... |
... |
... |
... |
... |
| Consensus M/M: |
-0.4% |
2.5% |
-0.7% |
4.1% |
0.5% |
0.4% |
0.7% |
0.3% |
0.6% |
0.5% |
1.0% |
0.6% |
| Consensus Low: |
... |
... |
... |
... |
... |
... |
... |
... |
... |
... |
... |
... |
| Consensus High: |
... |
... |
... |
... |
... |
... |
... |
... |
... |
... |
... |
... |
| RATE M/M |
-0.2% |
2.4% |
-1.0% |
4.2% |
0.5% |
0.0% |
1.0% |
0.3% |
0.8% |
0.6% |
1.3% |
0.6% |
| RATING |
|
|
|
|
|
|
|
|
|
|
|
|
| Month for: |
Dec 20 |
Jan-21 |
Feb-21 |
Mar-21 |
Apr-21 |
May-21 |
Jun-21 |
Jul-21 |
Aug-21 |
Sep-21 |
Oct-21 |
Nov-21 |
|
|
|
|
|
|
|
|
|
|
|
|
|
|
|
| |
|
| |
|
Legends: |
 |
Delayed |
 |
Positive View |
 |
Negative View |
 |
Neutral View |
 |
Non Available |
|
|
|
|
|
|
|
|
|
|
|
|
|
|
|
|
|
|
|
|
| |
|
|
|
|
|
|
|
|
|
|
|
|
|
|
|
|
|
|
|
|
|
Brief News | 2026 |
|
|
Consumer Spending PCE | Consumer |
|
Today's Week |
|
|
|
|
|
|
|
|
|
|
|
|
| |
|
|
|
|
| |
|
|
|
|
| |
|
|
|
|
| |
|
|
|
|
|
|
|
|
|
|
|
|
|
|
|
Brief News | 2025 |
|
|
Consumer Spending PCE | Consumer |
|
Today's Week |
|
|
|
|
|
|
|
|
|
|
|
|
|
Consumer Spending, Personal Consumption Expenditures (At 8:30 a.m ET)
| DATE/WEEK |
HIGHLIGHTS |
FOR |
Y/Y |
|
Key Fed |
No 12 |
... |
|
Nov-2025 |
|
| |
|
|
|
bbbbbbbbbbbbbbbbbbbbbbbbbbbbbbbb |
No 12 |
0.3% |
|
Sep-2025 |
|
| |
|
|
|
Personal Income Oct. 2025. Delayed due to the government shut down. |
No 11 |
... |
|
Oct-2025 |
|
| |
|
|
|
Personal Income Sep. 2025: Delayed due to the government shut down, |
No 10 |
... |
|
Sep-2025 |
|
| |
|
|
|
Key Fed |
No 9 |
0.6% |
|
Aug-2025 |
|
| |
|
|
|
Key Fed |
No 8 |
0.5% |
|
Jul-2025 |
|
| |
|
|
|
Key Fed |
No 7 |
0.3% |
|
Jun-2025 |
|
| |
|
|
|
Along with the inflation numbers, consumer spending and income showed further signs of weakening. Spending fell 0.1% for the month, compared with the estimate for an increase of 0.1%. Personal income declined 0.4%, against the forecast for a gain of 0.3%. Consumer spending and income showed further signs of weakening. Spending fell 0.1% for the month, while personal income declined 0.4%. |
No 6 |
2.7% |
|
May-2025 |
|
| |
|
|
|
The Core Personal Consumption Expenditures (PCE) Price Index for April 2025 showed a month-over-month increase of 0.1%, in line with market expectations, and a year-over-year increase of 2.5%, which was a slowdown from the previous month's 2.7% and the softest increase since March 2021. The core PCE is the Federal Reserve's preferred inflation measure as it excludes volatile food and energy prices. |
No 5 |
2.5% |
|
Apr-2025 |
|
| |
|
|
|
The Core Personal Consumption Expenditures (PCE) Price Index for March 2025, a key inflation gauge for the Federal Reserve, remained unchanged month-over-month, surprising economists who had anticipated a marginal increase, while increasing by 2.6% year-over-year, marking its slowest increase since March 2021. |
No 4 |
2.6% |
|
Mar-2025 |
|
| |
|
|
|
The core PCE (Personal Consumption Expenditures) Price Index in February 2025, which excludes volatile food and energy prices, increased by 0.4% month-over-month and rose to a 2.8% annual rate, exceeding forecasts and the Federal Reserve's 2% target. This hotter-than-expected rise in core inflation, particularly in services, suggests persistent inflation pressures and could influence the Federal Reserve's decisions on interest rates. |
No 3 |
2.8% |
|
Feb-2025 |
|
| |
|
|
|
Fed’s favorite core inflation measure hits 2.6% in January, as expected. Excluding food and energy, the core PCE also rose 0.3% for the month and was at 2.6% annually. Fed officials more closely follow the core measure as a better indicator of longer-term trends. The 12-month core measure showed a step down from the upwardly revised 2.9% level in December. Headline inflation eased by 0.1 percentage point. The CPI for January showed an all-items inflation rate of 3% and 3.3% at the core. |
No 2 |
2.6% |
|
Jan-2025 |
|
| |
|
|
|
Inflation finishes 2024 well above Fed’s 2% target, PCE shows.. Key Fed measure shows core inflation at 2.8%, in line with expectations. Core inflation rose 2.8% year-on-year in December 2024 as forecast. The U.S. central bank tracks the PCE price measures for monetary policy. The Fed on Wednesday left its benchmark overnight interest rate in the 4.25%-4.50% range, having reduced it by 100 basis points since September when it started its policy easing cycle. |
No 1 |
2.8% |
|
Dec-2024 |
|
| |
|
|
|
|
|
|
|
|
| |
|
|
|
|
|
| |
|
|
|
|
|
|
|
|
|
|
|
|
|
|
|
Brief News | 2024 |
|
|
Consumer Spending PCE | Consumer |
|
Today's Week |
|
|
|
|
|
|
|
|
|
|
|
|
|
Consumer Spending, Personal Consumption Expenditures (At 8:30 a.m ET)
| DATE/WEEK |
HIGHLIGHTS |
FOR |
Y/Y |
|
Key Fed inflation measure shows 2.4% rate in November, lower than expected. The PCE price index, the Fed’s preferred inflation gauge, showed an increase of just 0.1% from October and a 2.4% annual rate, both below expectations. Excluding food and energy, core PCE also increased 0.1% monthly and was 2.8% higher from a year ago, with both readings being 0.1 percentage point below the forecast. Excluding food and energy, core PCE also increased 0.1% monthly and was 2.8% higher from a year ago, with both readings also being 0.1 percentage point below the forecast. Fed officials generally consider the core reading to be a better gauge of long-run inflation trends as it excludes the volatile gas and groceries category. |
No 12 |
2.8% |
|
Nov-2024 |
|
| |
|
|
|
Inflation edged higher in October as the Federal Reserve is looking for clues on how much it should lower interest rates, the Commerce Department reported Wednesday. Excluding food and energy, core inflation showed even stronger readings, with the increase at 0.3% on a monthly basis and an annual reading of 2.8%. Both also met expectations. The annual rate was 0.1 percentage point above the prior month. Fed’s preferred inflation gauge rises to 2.3% annually, meeting expectations. The personal consumption expenditures price index increased 0.2% on the month and showed a 12-month inflation rate of 2.3%, both in line with expectations. Core inflation showed even stronger readings, with an increase at 0.3% on a monthly basis and an annual reading of 2.8%, also as forecast. Spending rose 0.4% on the month, as forecast, while personal income jumped 0.6%, well above the 0.3% estimate. |
No 11 |
2.8% |
|
Oct-2024 |
|
| |
|
|
|
Key inflation rate hits 2.1% in September, as expected, closing in on Fed target. However, the core inflation rate was at 2.7% after the measure increased 0.3% on a monthly basis.The personal consumption expenditures price index showed a seasonally adjusted 0.2% increase for the month, with the 12-month inflation rate at 2.1%, both in line with Dow Jones estimates. The Fed uses the PCE reading as its primary inflation gauge, though policymakers also follow a variety of other indicators. Fed officials target inflation at a 2% annual rate, a level it has not achieved since February 2021. The September headline rate was down 0.2 percentage point from August. |
No 10 |
|
|
Sep-2024 |
|
| |
|
|
|
Excluding food and energy, core PCE rose 0.1% in August 2024 and was up 2.7% from a year ago, the 12-month number 0.1 percentage point higher than July. Fed officials tend to focus more on core as a better measure of long-run trends. The respective forecasts were for 0.2% and 2.7% on core. Key Fed inflation gauge at 2.2% in August, lower than expected. The PCE price index, a measure the Fed focuses on to measure the cost of goods and services in the U.S. economy, rose 0.1% for the month, putting the 12-month inflation rate at 2.2%. Excluding food and energy, core PCE rose 0.1% in August and was up 2.7% from a year ago. The all-items inflation gauge was below Wall Street estimates and the lowest since early 2021. |
No 9 |
2.7% |
|
Aug-2024 |
|
| |
|
|
|
The Fed’s favorite inflation indicator increased 0.2% in July, as expected. Inflation edged higher in July, according to a measure favored by the Federal Reserve as the central bank prepares to enact its first interest rate reduction in more than four years. The Commerce Department reported Friday that the personal consumption expenditures price index rose 0.2% on the month and was up 2.5% from the same period a year ago, exactly in line with the Dow Jones consensus estimates. Excluding volatile food and energy prices, core PCE also increased 0.2% for the month but was up 2.6% from a year ago. The 12-month figure was slightly softer than the 2.7% estimate. |
No 8 |
2.6% |
|
Jul-2024 |
|
| |
|
|
|
Fed’s Favored Price Gauge Rises at Mild Pace, Spending Holds Up. Core PCE prices and real consumer spending each advance 0.2%. Measures of wage growth cooled in June as saving rate fell. US Core PCE Rises 0.2% in June, Personal Spending Remains Firm. The Federal Reserve’s preferred measure of underlying US inflation rose at a tame pace in June and consumer spending remained healthy, encouraging signs for officials looking to cool inflation without breaking the economy. Fed’s key inflation gauge rose 2.5% in June from a year ago, easing path to rate cut. The personal consumption expenditures price index increased 0.1% in June and was up 2.5% from a year ago, with the annual rate showing a slight decline from the prior month. Core inflation, which excludes food and energy, showed a monthly increase of 0.2% and 2.6% on the year, both also in line with expectations. |
No 7 |
2.6% |
|
Jun-2024 |
|
| |
|
|
|
US inflation cools in May, boosting hopes of Fed rate cut. PCE price index flat in May; up 2.6% on year-on-year basis. Core PCE edges up 0.1%; rises 2.6% on year-on-year basis. Consumer spending gains 0.2%; personal income up 0.5%. U.S. monthly inflation was unchanged in May as a modest increase in the cost of services was offset by the largest drop in goods prices in six months, drawing the Federal Reserve closer to start cutting interest rates later this year.. The report from the Commerce Department on Friday also showed consumer spending rose marginally last month. Underlying prices advanced at the slowest pace in six months, raising optimism that the U.S. central bank could engineer a much-desired "soft landing" for the economy in which inflation cools without triggering a recession and a sharp rise in unemployment. The flat reading in the personal consumption expenditures (PCE) price index last month followed an unrevised 0.3% gain in April, the Commerce Department's Bureau of Economic Analysis said. It was the first time in six months that PCE inflation was unchanged. Goods prices fell 0.4%, the biggest drop since November. |
No 6 |
2.6% |
|
May-2024 |
|
| |
|
|
|
U.S. inflation tracked sideways in April, a worrying sign for the U.S. central bank that suggests the elevated pace of price increases could last longer than expected and casts doubt on how soon it will be able to cut interest rates. The personal consumption expenditures (PCE) price index increased 0.3% last month, the Commerce Department said on Friday, matching the unrevised gain in March. The PCE price index rose 2.7% year on year, after advancing 2.7% in March. Economists polled by Reuters had forecast it would climb 0.3% on the month and 2.7% on a year-on-year basis. Core PCE subtracting food and energy prices, rose 0.2% month to month, less than the forecast repeat of March's 0.3% rise. In the 12 months to April the core index rose 2.8%, the same as expected and as last month's rise. |
No 5 |
2.8% |
|
Apr-2024 |
|
| |
|
|
|
The Fed’s preferred inflation gauge just moved in the wrong direction in March 2024, Inflation remained stubbornly high last month, but it hasn’t stopped Americans from spending. The Personal Consumption Expenditures price index — a closely watched inflation gauge favored by the Federal Reserve — accelerated to 2.7% for the year ended in March, according to data released Friday by the Commerce Department. That rate was above economists’ expectations for a 2.6% gain and landed above February’s reading of 2.5%. On a monthly basis, prices rose 0.3%, unchanged from the pace seen in February. Inflation has cooled significantly from the decades-high levels seen in the summer of 2022; however, progress that was made last year did not continue into 2024. While rising gas prices played their role, the biggest bogeyman to lower inflation has been shelter costs and overall services, where price hikes tend to be more “sticky.” |
No 4 |
2.8% |
|
Mar-2024 |
|
| |
|
|
|
Consumer spending jumps 0.8%; personal income up 0.3%. U.S. prices moderated in February, with the cost of services outside housing and energy slowing significantly, keeping a June interest rate cut from the Federal Reserve on the table. The report from the Commerce Department on Friday also showed consumer spending rising by the most in just over a year last month, underscoring the economy's resilience. The United States continues to outperform its global peers despite higher borrowing costs, thanks to persistent labor market strength. The personal consumption expenditures (PCE) price index rose 0.3% last month, the Commerce Department's Bureau of Economic Analysis said. Data for January was revised higher to show the PCE price index climbing 0.4% instead of 0.3% as previously reported. Economists polled by Reuters had forecast the PCE price index gaining 0.4% on the month. |
No 3 |
2.8% |
|
Feb-2024 |
|
| |
|
|
|
Services drive US prices higher in January; inflation gradually cooling. Core PCE price index rises 0.4%; up 2.8% year-on-year. Consumer spending gains 0.2%; personal income jumps 1.0%. U.S. prices accelerated in January amid a surge in the costs of services like housing and finance, but the annual increase in inflation was the smallest in three years, keeping a mid-year interest rate cut from the Federal Reserve on the table. The report from the Commerce Department on Thursday also showed consumer spending slowing last month, restrained by decreases in outlays on goods, including motor vehicles, furniture and other long-lasting household equipment. The inflation and consumer spending readings were in line with economists' expectations. But with the costs of services increasing by the most in 12 months, likely as businesses raised prices at the start of the year, the timing of the first Fed rate cut remains uncertain. Most economists do not expect the price increases to repeat in February. The personal consumption expenditures (PCE) price index rose 0.3% last month, the Commerce Department's Bureau of Economic Analysis said. Data for December was revised lower to show the PCE price index gaining 0.1% instead of the previously reported 0.2%. Goods prices fell 0.2% as the cost of energy dropped 1.4%, offsetting a 0.5% rise in food prices. |
No 2 |
2.8% |
|
Jan-2024 |
|
| |
|
|
|
Consumer spending increased 0.7%, stronger than the 0.5% estimate. Personal income growth edged lower to 0.3%, in line with the forecast. The data was included in the fourth quarter's advance gross domestic product report published on Thursday. Consumer spending increased at a strong 2.8% rate last quarter, accounting for the bulk of the economy's 3.3% growth pace. The pace of growth in consumer spending is, however, likely to moderate in the months ahead. Personal income increased 0.3% in December after rising 0.4% in November. The saving rate dropped to a one-year low of 3.7%, from 4.1% in November. |
No 1 |
2.9% |
|
Dec-2023 |
|
| |
|
|
|
|
|
|
|
|
| |
|
|
|
|
|
| |
|
|
|
|
|
|
|
|
|
|
|
|
|
|
|
Brief News | 2023 |
|
|
Consumer Spending PCE | Consumer |
|
Today's Week |
|
|
|
|
|
|
|
|
|
|
|
|
|
Consumer Spending, Personal Consumption Expenditures (At 8:30 a.m ET)
| DATE/WEEK |
HIGHLIGHTS |
FOR |
ACTUAL |
|
The Federal Reserve’s preferred measure of inflation rose less than expected in November, bolstering bets that the central bank will begin cutting interest rates next year. The Personal Consumption Expenditures price index (PCE), a gauge of core inflation that excludes food and energy costs, rose 0.1% from a month earlier, according to a report the Bureau of Economic Analysis released Friday. That was lower than the 0.2% rise forecast by economists polled by Reuters. |
No 12 |
3.2% |
|
Nov-2023 |
|
| |
|
|
|
Consumer spending increases 0.2% in October. Personal income gains 0.2%; saving rate climbs to 3.8%. Core PCE price index rises 0.2%; up 3.5% year-on-year. U.S. consumer spending rose moderately in October, while the annual increase in inflation was the smallest in more than 2-1/2 years, signs of cooling demand that bolstered expectations the Federal Reserve's interest rate hiking campaign was over. Consumer spending, which accounts for more than two-thirds of U.S. economic activity, increased 0.2% last month after an unrevised 0.7% gain in September, the Commerce Department's Bureau of Economic Analysis said. |
No 11 |
3.5% |
|
Oct-2023 |
|
| |
|
|
|
Consumer spending increases 0.7% in September. Personal income gains 0.3%; saving rate falls to 3.4%. Core PCE price index rises 0.3%; up 3.7% year-on-year. U.S. consumer spending surged in September as households boosted purchases of motor vehicles and traveled, keeping spending on a higher growth path heading into the fourth quarter. The stronger-than-expected increase in spending reported by the Commerce Department on Friday was accompanied by elevated monthly inflation readings, against the backdrop of higher costs for services like housing. Spending is, however, seen cooling off in early 2024 as excess savings accumulated during the pandemic start running out, leaving economists convinced the Federal Reserve is done raising interest rates. Consumer spending, which accounts for more than two-thirds of U.S. economic activity, accelerated 0.7% last month after an unrevised 0.4% rise in August, the Commerce Department's Bureau of Economic Analysis reported. Economists polled by Reuters had forecast spending gaining 0.5%. |
No 10 |
|
|
Sep-2023 |
|
| |
|
|
|
Consumer spending increases 0.4% in August. Core PCE price index gains 0.1%; up 3.9% year-on-year. Personal income rises 0.4%; saving rate dips to 3.9%. Underlying U.S. inflation moderated in August, with the annual rise in prices excluding food and energy falling below 4.0% for the first time in more than two years, welcome news for the Federal Reserve as it ponders the monetary policy outlook. The battle against inflation is, however, far from being won as the report from the Commerce Department on Friday showed overall prices were still elevated, partly due to higher gasoline prices. While the economy remains strong, consumer spending is slowing, which combined with cooling underlying price pressures raised hopes that the U.S. central bank will not hike interest rates in November. The consumer spending and inflation report is probably the last official economic data release before an expected partial shutdown of the U.S. government due to begin after midnight on Saturday. |
No 9 |
3.9% |
|
Aug-2023 |
|
| |
|
|
|
mmmmmm |
No 8 |
0.3% |
|
Jul-2023 |
|
| |
|
|
|
The personal consumption expenditures (PCE) price index increased 0.2% last month after edging up 0.1% in May, the Commerce Department said. Food prices dipped 0.1% while the cost of energy products increased 0.6%. In the 12 months through June, the PCE price index advanced 3.0%. That was the smallest annual gain since March 2021 and followed a 3.8% rise in May. Excluding the volatile food and energy components, the PCE price index gained 0.2% after rising 0.3% in the prior month. That lowered the year-on-year increase in the so-called core PCE price index to 4.1%, the smallest advance since September 2021. |
No 7 |
0.5% |
|
Jun-2023 |
|
| |
|
|
|
US consumer spending edges up in May; inflation still high. U.S. consumer spending slowed sharply in May, but persistently strong underlying inflation pressures could compel the Federal Reserve to resume raising interest rates next month. |
No 6 |
0.1% |
|
May-2023 |
|
| |
|
|
|
Strong US consumer spending, inflation readings put Fed in tough spot. Consumer spending increases 0.8% in April. Core PCE price index rises 0.4%; up 4.7% year on year. Core capital goods orders rebound 1.4%; shipments up 0.5%. U.S. consumer spending increased more than expected in April, boosting the economy's growth prospects for the second quarter, and inflation picked up, which could prompt the Federal Reserve to raise interest rates again next month. Consumer spending jumped 0.8% last month after gaining 0.1% in March. Economists polled by Reuters had forecast consumer spending, which accounts for more than two-thirds of U.S. economic activity, would rise 0.4%. Consumer spending is being supported by strong wage gains in a tight labor market. Wages increased 0.5% after rising 0.3% in March. That helped lift personal income 0.4% after a gain of 0.3% in March. Growth estimates for the second quarter are currently as high as a 2.9% annualized rate. |
No 5 |
0.8% |
|
Apr-2023 |
|
| |
|
|
|
mmmmmm |
No 4 |
0.0% |
|
Mar-2023 |
|
| |
|
|
|
mmmmm |
No 3 |
0.2% |
|
Feb-2023 |
|
| |
|
|
|
U.S. consumer spending posts biggest gain in nearly two years; inflation picks up. Consumer spending increases 1.8% in January. Income climbs 0.6%; wages jump 0.9%. Core PCE price index rises 0.6%; up 4.7% year-on-year. U.S. consumer spending increased by the most in nearly two years in January amid a surge in wage gains, while inflation accelerated, adding to financial market fears that the Federal Reserve could continue raising interest rates into summer. Consumer spending, which accounts for more than two-thirds of U.S. economic activity, shot up 1.8% last month. That was the largest increase since March 2021 |
No 2 |
1.8% |
|
Jan-2023 |
|
| |
|
|
|
mmmmm |
No 1 |
-0.2% |
|
Dec-2022 |
|
| |
|
|
|
|
|
|
|
|
| |
|
|
|
|
|
| |
|
|
|
|
|
|
|
|
|
|
|
|
|
|
|
Brief News | 2022 |
|
|
Consumer Spending PCE | Consumer |
|
Today's Week |
|
|
|
|
|
|
|
|
|
|
|
|
|
Consumer Spending PCE | Consumer (8:30)
| DATE/WEEK |
HIGHLIGHTS |
M/M |
Y/Y |
|
|
No 12 |
0.4% |
|
Nov-2022 |
|
| |
|
|
|
|
No 11 |
0.7% |
|
Oct-2022 |
|
| |
|
|
|
|
No 10 |
0.4% |
|
Sep-2022 |
|
| |
|
|
|
|
No 9 |
0.3% |
|
Aug-2022 |
|
| |
|
|
|
|
No 8 |
0.2% |
|
Jul-2022 |
|
| |
|
|
|
|
No 7 |
0.6% |
|
Jun-2022 |
|
| |
|
|
|
|
No 6 |
0.5% |
|
May-2022 |
|
| |
|
|
|
|
No 5 |
0.4% |
|
Apr-2022 |
|
| |
|
|
|
|
No 4 |
0.5% |
|
Mar-2022 |
|
| |
|
|
|
In February 2022, U.S. consumer spending (Personal Consumption Expenditures) increased by $34.9 billion or 0.2 percent. This growth was driven by higher spending on services like healthcare, recreation, and transportation, but was partially offset by a decline in spending on goods, particularly motor vehicles. In real, inflation-adjusted terms, consumer spending decreased by 0.4%. |
No 3 |
0.5% |
|
Feb-2022 |
|
| |
|
|
|
In January 2022, U.S. consumer spending (PCE) increased by $337.2 billion, or 2.1%, driven by higher spending on goods and services. This surge was accompanied by a significant rise in inflation, with the core PCE price index (excluding food and energy) rising 5.2% from a year prior, while the headline PCE price index rose 6.1% from a year ago. |
No 2 |
0.0% |
|
Jan-2022 |
|
| |
|
|
|
In December 2021, U.S. consumer spending, or Personal Consumption Expenditures (PCE), decreased by $95.2 billion (1.0 percent in real terms) after adjusting for inflation, while personal income rose by (0.3) percent. The PCE price index, a key inflation measure, increased by (0.4) percent for the month, or (5.8) percent year-over-year. This spending decrease was driven by a (3.1) percent drop in spending on goods, while services spending saw a slight increase of (0.1) percent. |
No 1 |
0.3% |
|
Dec-2021 |
|
| |
|
|
|
|
|
|
|
|
| |
|
|
|
|
|
| |
|
|
|
|
|
|
|
|
|
|
|
|
|
|
|
Brief News | 2021 |
|
|
Consumer Spending PCE | Consumer |
|
Today's Week |
|
|
|
|
|
|
|
|
|
|
|
|
|
Consumer Spending PCE | Consumer (8:30)
| DATE/WEEK |
HIGHLIGHTS |
M/M |
Y/Y |
|
In November 2021, US personal consumption expenditures (PCE) increased by 0.6% in nominal terms, while the PCE price index, a key inflation gauge, rose 0.6% compared to the previous month. Year-over-year, the PCE price index increased by 5.7%, and the core PCE index (excluding food and energy) was up 4.7%. Real PCE, which adjusts for inflation, grew by a mere 0.1%. |
No 12 |
0.6% |
|
Nov-2021 |
|
| |
|
|
|
In October 2021, U.S. consumer spending increased by $214.3 billion, or 1.3%. The real (inflation-adjusted) PCE grew 0.7%, with a 1.0% increase in goods and a 0.5% increase in services. The overall PCE price index rose 0.6% from the previous month, while the core PCE price index (excluding food and energy) increased by 0.4%. |
No 11 |
1.3% |
|
Oct-2021 |
|
| |
|
|
|
In September 2021, U.S. personal consumption expenditures (PCE), or consumer spending, increased by $93.4 billion, a 0.6% rise from the previous month. This was accompanied by a 1.0% decrease in personal income, primarily due to the winding down of pandemic-related assistance programs. Spending on services grew by 0.4%, while spending on goods increased by 0.1% in real terms. |
No 10 |
0.6% |
|
Sep-2021 |
|
| |
|
|
|
In August 2021, U.S. consumer spending (PCE) increased by $130.5 billion, or 0.8%, driven by a $64.6 billion increase in services and a $66.0 billion increase in goods. Spending on services was led by housing, utilities, health care, and other services like personal care, while spending on goods saw increases in food and beverages and other nondurables, offset by a decrease in motor vehicles. |
No 9 |
0.8% |
|
Aug-2021 |
|
| |
|
|
|
In July 2021, consumer spending (PCE) increased by $42.2 billion or 0.3%, while spending adjusted for inflation (real PCE) decreased by 0.1%. The Personal Consumption Expenditures (PCE) price index rose 4.2% over the year and 0.4% from the previous month, with services like food services and accommodations seeing the largest gains. |
No 8 |
0.3% |
|
Jul-2021 |
|
| |
|
|
|
In June 2021, U.S. consumer spending (PCE) increased by 1.0% in current dollars, driven largely by a strong increase in services. Real (inflation-adjusted) spending increased by 0.5%, with goods decreasing slightly and services increasing by 0.8%. The PCE price index rose 0.5% from the previous month and 4.0% from a year ago, while the core PCE price index (excluding food and energy) increased 0.4% from the previous month and 3.5% year-over-year. |
No 7 |
1.0% |
|
Jun-2021 |
|
| |
|
|
|
In May 2021, U.S. consumer spending (PCE) was nearly flat, increasing by only $2.9 billion (less than 0.1%). This modest growth occurred as spending on services increased, but it was offset by a significant drop in spending on goods. Meanwhile, personal income declined by 2.0% primarily due to a decrease in pandemic-related government assistance payments. The PCE price index rose 0.4% for the month, and core PCE inflation (excluding food and energy) increased 0.5%. |
No 6 |
0.0% |
|
May-2021 |
|
| |
|
|
|
In April 2021, U.S. consumer spending (Personal Consumption Expenditures or PCE) increased by $80.2 billion, driven primarily by a rise in services spending, especially for recreation and food services. Concurrently, the PCE price index rose 3.6% year-over-year, reflecting higher inflation in the recovering economy. |
No 5 |
0.5% |
|
Apr-2021 |
|
| |
|
|
|
In March 2021, U.S. personal consumption expenditures (PCE) increased by (4.2%) from the previous month, a significant rebound after a decrease in February. This rise in consumer spending was driven by a surge in government stimulus payments, though spending on services remained below pre-pandemic levels. |
No 4 |
4.2% |
|
Mar-2021 |
|
| |
|
|
|
In February 2021, U.S. consumer spending, measured by Personal Consumption Expenditures (PCE), decreased by 1.0% following the prior month's surge from economic stimulus checks. This drop was influenced by the fading impact of economic impact payments and was exacerbated by severe winter weather that gripped parts of the country, impacting spending on both goods and services. |
No 3 |
-1.0% |
|
Feb-2021 |
|
| |
|
|
|
In January 2021, U.S. consumer spending (PCE) increased by $340.9 billion (2.4%) increase) driven by stimulus payments from the Coronavirus Response and Relief Supplemental Appropriations (CRRSA) Act. Real spending (adjusted for inflation) increased by (2.0%), with goods spending rising faster (5.1%) than services (0.5%). |
No 2 |
2.4% |
|
Jan-2021 |
|
| |
|
|
|
In December 2020, U.S. personal consumption expenditures (PCE) decreased by $27.9 billion (0.2%), while real PCE (adjusted for inflation) fell 0.6%. This decrease came after a period of volatile spending throughout the year, which was impacted by the COVID-19 pandemic. In contrast, for the full year of 2020, real PCE for the nation decreased by 3.8%. |
No 1 |
-0.2% |
|
Dec-2020 |
|
| |
|
|
|
|
|
|
|
|
| |
|
|
|
|
|
| |
|
Legends: |
|
Delayed |
|
Positive View |
|
Negative View |
|
Neutral View |
|
Non Available |
|
|
|
|
|
|
|
|
|
|
|
|
|
|
|
|
|
|
|
|
| |
|
|
|
|
|
|
|
|
|
|
|
|
|
|
|
|
|
|
|
|
|
Definitions | Explain |
|
|
Consumer Spending | Consumer |
|
Today's Week |
|
|
|
|
|
|
|
|
|
|
|
|
| |
|
|
|
|
| |
|
| How the Real PCE Affects You? |
Personal Income and Outlays:
1. Personal Income - Consumer
2. Personal Consumption Expenditures, Real PCE - Consumer Spending
3. PCE Price Index and Core PCE Price Index - Inflation
PCE price index
This inflation index measures a basket of goods and services that is updated annually in contrast to the CPI, which measures a fixed basket. Changes in import and export prices are a valuable gauge of inflation here and abroad
Consumer Spending
Consumer spending, Real PCE, is a major driver of the economy. Increased buying of both goods and services contributed to an upward revision in GDP. Consumer spending is critical because it drives roughly 70% of growth and correspond to the amount of money spent by household in an economy.
Consumer Spending is also known as Consumption or Personal Consumption Expenditure (PCE) and includes durables, like TV, and nondurables, like food.
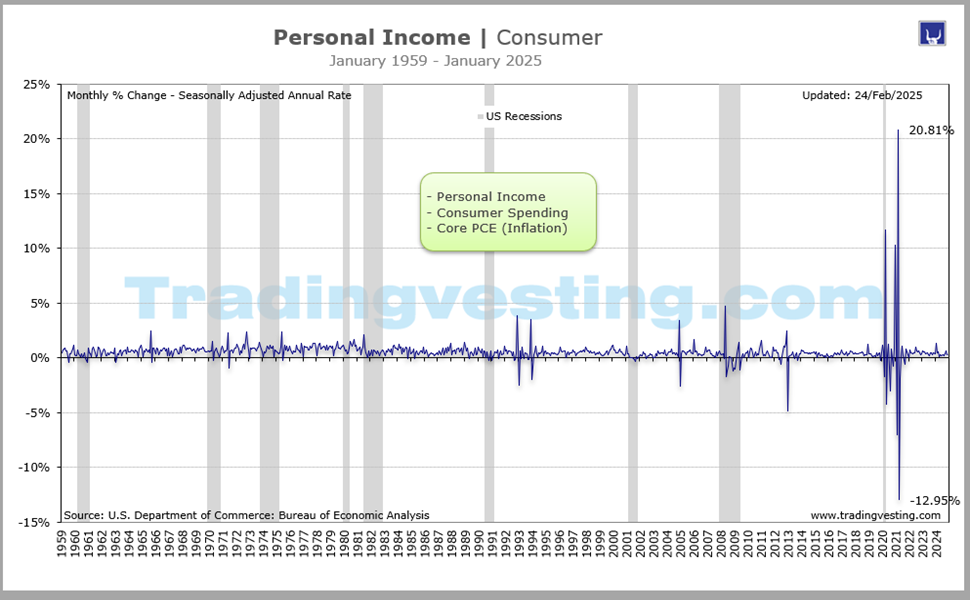
Changes in personal income signal changes in consumer spending. The income and outlays data are another handy way to gauge the strength of the consumer sector in this economy and where it is headed.
The PCE or Cosumer Spending is indicative of the general consumption by individuals and their willingness to spend. Sharply declining or negative values indicate reduced consumption and are likely to correspond to times of economic stress.
Personal Income
Personal Consuomtion Expebditures - Consumer Spending
PCE Price index - Este no lo sigo solo i ICLUYE food and Enegy se llama Healine PCE, The headline, or all-items, PCE
Core PCE Price index... no incluye Food and Energy
|
|
|
| |
|
|
|
|
|
|
|
|
|
|
|
| |
|
|
|
|
|
|
| DATA INFORMATION |
CONSUMER SPENDING |
| SOURCE |
The Conference Board |
| WEB |
www.conference-board.org |
| FREQUENCY |
Monthly |
| AVAILABILITY |
The last week of the month |
| COVERAGE |
Data are for same month as the release month. |
| REVISIONS |
Yes |
| IMPORTANCE |
Consumer - Very Important |
|
| |
|
|
|
|
|
|
|
|
|
|
|
|