Fibonacci Series
0, 1, 1, 2, 3, 5, 8, 13, 21, 34, 55, 89, 144, 233, 377, 610, 987, 1597, 2584, 4181, 6765, 10946...
Golden Ratio
The Golden Rectangle is proposed to be the most aesthetically pleasing of all possible rectangles. For this reason, it and the Golden Ratio have been used extensively in art and architecture for thousands of years. The most prominent and well known uses of the Golden Rectangle in art were created by the great Italian artist, inventor, and mathematician, Leonardo da Vinci.
Fibonacci Ratios
The last three sections have done much to explain Golden geometry, but haven't explained how they relate to the topic of the Fibonacci series. Actually, the Golden Ratio and the Fibonacci numbers are two concepts that have a lot to do with each other.
The most important appearance of the Golden Ratio in Fibonacci mathematics is the Fibonacci ratio sequence. The Fibonacci ratio sequence is the series of numbers you get when you divide each Fibonacci number with the one that precedes it. Let's look at a few terms of this sequence.
f(1) = 1
f(2) = 1
f(3) = 2
f(4) = 3
f(5) = 5
f(6) = 8
f(7) = 13
f(8) = 21
In order to create the first few terms of the sequence, we divide each Fibonacci number by the one before it. Since there is no Fibonacci number before f(1), we start with f(2). Dividing f(2) by f(1) gives a value of 1, so 1 is the first number of the Fibonacci ratio sequence, or r(1). Then we divide f(3) by f(2) to get the value of r(2), 2. Continuing in this fashion, we get:
r(1) = 1 / 1 = 1
r(2) = 2 / 1 = 2
r(3) = 3 / 2 = 1.5
r(4) = 5 / 3 = 1.67
r(5) = 8 / 5 = 1.6
r(6) = 13 / 8 = 1.625
r(7) = 21 / 13 = 1.615
Fibonacci numbers appear in this infinite sequence: 0, 1, 1, 2, 3, 5, 8, 13, 21, 34 , where each number is the sum of the previous two. Divide one Fibonacci number by its predecessor, and the quotients will cluster around 1.618 -- the golden mean, or so-called divine proportion. Technical analysts, as opposed to those who rely on fundamentals like earnings and economic growth, say that both can be used to predict a market’s direction.
Markets are governed by waves that crest and fall based on a sequence of numbers called the Fibonacci sequence and the closely related golden mean, or golden ratio.
Gann Angles
W D Gann was an innovator in technical trading systems and made fortune of over 50 million dollars Gann died in 1955, but his methods live on and traders around the world use them for big profits.
Gann angles are a tool used by many savvy traders Quite simply Gann angles allow you to pinpoint your entry and exit levels for great profit potential. Let's look at the effectiveness of Gann angles.
Gann based his investment strategy on the fact that by studying the Past, We Can Predict the Future. He assumed the following:
1. Price, time, and range are the only three factors relevant to market movement.
2. Markets are cyclical in nature.
3. The markets are geometric in their design and in function. Gann knew that market movements were a reflection of human nature which is constant over time, and this shows up in repetitive price patterns that can be seen with the right tolls and traded for profit.
Gann identified nine significant angles, with the 1 x 1 being the most important:
1 x 8 = 82.5 degrees
1 x 4 = 75 degrees
1 x 3 = 71.25 degrees
1 x 2 = 63.75 degrees
1 x 1 = 45 degrees
2 x 1 = 26.25 degrees
3 x 1 = 18.75 degrees
4 x 1 = 15 degrees
8 x 1 = 7.5 degrees
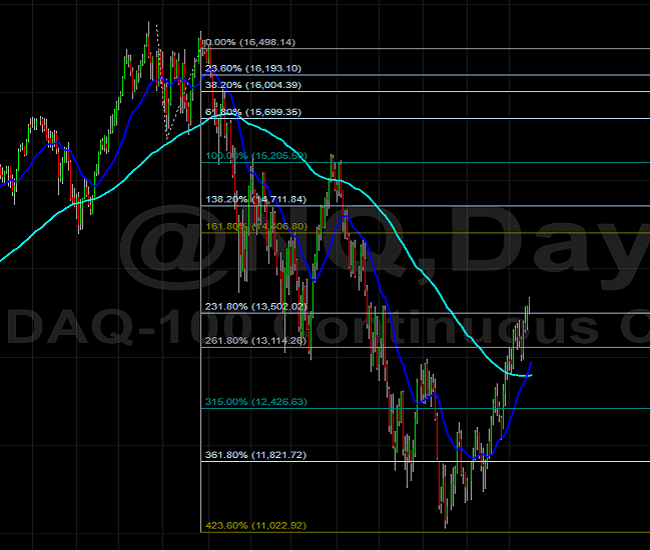
Targeting 423.6% Fibonacci Expansion Level
What Is Fibonacci Expansion?
If you want to use Fibonacci expansions, you should know about two waves.
The first one is AB, that stands for the entire trend. The distance between A and B amounts to 100%.
The second wave is BC. It represents a correction of the primary trend. Point C is the start of the expansion. The expansion levels are 61.8% and 161.8%. There can also be two additional points 261.8% and 423.6%.
In general, three points are required to implement the tool. You need to determine the start of a new trend. After, you will need to find a higher low if you trade in the downtrend or a lower high in case of the uptrend.
Let’s consider an example. We have a price chart and we connect points A and B which determine the strength of the trend. After that, we need to select the Fibonacci tool again by clicking on the baseline. We draw the second line, dragging the line to the third top or bottom (C point). All three points should be connected.
How to Trade Fibonacci Expansion
There are two points where you can open a position.
The entry point may lie at one of the Fibonacci retracement levels (38.2%, 50%, or 61.8%). For instance, at point C.
Or you can place the trade when the price is beyond point B (end of the first wave).
The Take Profit level will lie at 161.8%. If the third line is strong, the price may move to the next levels, for example, 261.8%.
Fibonacci Extensions
Levels used in Fibonacci retracement to forecast areas of support or resistance. Extensions consist of all levels drawn beyond the standard 100% level and are used by many traders to determine areas where they will wish to take profits. The most popular extension levels are 161.8%, 261.8% and 423.6%.
In practice, most traders use Fibonacci extensions in combination with other technical indicators/patterns to help them determine appropriate target prices. As this chart shows, the 161.8% level is often used to set the price target on a breakout of an ascending triangle. This specific target is calculated by multiplying the vertical distance of the triangle by the key Fibonacci ratio of 61.8% and then adding the result to the upper resistance of the triangle.
Fibonacci Extensions Definition
Fibonacci levels are a standard measure for support and resistance levels within the market. This levels are calculated by analyzing the retracement levels between two swing points. The next question we have to ask ourselves as traders, is what happens when price exceeds the very swing points we use to calculate our fibonacci levels? At what point do we look to exit our position? The key to these questions are fibonacci extensions. Fibonacci extensions provide price targets that go beyond a 100% retracement of a prior move. The levels for fibonacci extensions are calculated by taking the standard fibonacci levels and adding them to 100%. Therefore, the standard fibonacci extension levels are as follows: 138.2%, 150%, 161.8%, 231.8%, 261.8%, 361.8% and 423.6%.
Identifying Fibonacci Extension Levels
The first step in drawing fibonacci extension levels is to identify two clear swing points. These point should be in relation to both your current timeframe and length of trend. In the below example we will be reviewing the fibonacci extension levels for Provident Bankshares (PBKS). As you can see, the stock was able to exceed its high of $18.76. Once PBKS exceeded this prior swing high, the stock began an impulsive move up that would not face any real resistance until achieving its 261.8% retracement level.
Fibonacci Extensions
Levels used in Fibonacci retracement to forecast areas of support or resistance. Extensions consist of all levels drawn beyond the standard 100% level and are used by many traders to determine areas where they will wish to take profits. The most popular extension levels are 161.8%, 261.8% and 423.6%
In practice, most traders use Fibonacci extensions in combination with other technical indicators/patterns to help them determine appropriate target prices. As this chart shows, the 161.8% level is often used to set the price target on a breakout of an ascending triangle. This specific target is calculated by multiplying the vertical distance of the triangle by the key Fibonacci ratio of 61.8% and then adding the result to the upper resistance of the triangle.
|