 |
 |
|
|
|
Week 33 -2012 | From Aug 13 to Aug 17, 2012 |
|
 |
|
|
|
|
|
|
| |
|
|
|
|
|
|
|
|
|
|
| |
Economic Data for Week 33-2012 | Global View | Week Rating
| DATE |
DAY |
REPORT/CATEGORY |
HIGHLIGHTS ON WEEK 33-2012 |
LAST |
|
Mon |
Non Reports for Our Global Vision |
There will be no Economic Reports released on Monday. |
N/A |
|
|
No Reports |
|
|
|
Tue |
ICSC Goldman Sachs Index |
The ICSC Index edged down 0.3% in the week ended Saturday from the week before on a seasonally adjusted, comparable-store basis, as consumers reverted back to conservative shopping patterns. |
-0.3% |
|
 |
Sales and Inventories |
Sales were mixed this past week as the year-over-year results were strong but on a weekly basis the sequential change was slightly down for the prior week. |
|
|
Tue |
Producer Price Index |
The Producer Price Index rose 0.3% in July,above expectations for a 0.2% rise, as food prices rose 0.5% and the core PPI rose 0.4%, offsetting a 0.4% decline in energy prices |
0.3% |
|
|
Inflation |
Despite the increase in July PPI due to food inflation, the year/year rise for that measure slowed further to 0.5%, the slowest 12-month rate since a 2.0% decline in October 2009. |
|
|
Tue |
Retail Sales |
After three straight monthly declines, sales at U.S. retailers increased 0.8% in July to a seasonally adjusted $403.9 billion, the Commerce Department estimated Tuesday. |
0.8% |
|
|
Sales and Inventories |
The tone of this report was unambiguously encouraging, as it points to a meaningful improvement in household spending activity after stagnating for three consecutive month. |
|
|
Tue |
Johnson Redbook |
National chain store sales slipped 0.3% in the first two weeks of August from July. The index's fall compared with a targeted 0.5% decline. |
1.8% |
|
|
Sales and Inventories |
The Johnson Redbook Index also showed seasonally adjusted sales for the period were up 1.9% from last year compared with a 1.7% targeted gain. |
|
|
Tue |
Business Inventories |
U.S. companies barely increased their stockpiles in June from May, and sales plunged by the largest amount in more than three years. |
0.1% |
|
|
Sales and Inventories |
Business inventories edged up a slight 0.1% in June after a 0.3% gain in May. Sales fell 1.1%, the sharpest decline since March 2009 when the economy was still in recession. |
|
|
Wed |
MBA purchase Applications |
Applications for U.S. home mortgages tumbled last week, with demand for new loans down for the fifth week in a row as interest rates held steady. |
-4.5% |
|
|
Real Estate |
The MBA said its seasonally adjusted index of mortgage application activity, which includes both refinancing and home purchase demand, fell 4.5% in the week ended Aug 10. |
|
|
Wed |
Consumer Price Index |
U.S. consumer prices were flat in July for a second straight month and the year-over-year increase was the smallest since November 2010, giving the Federal Reserve room for further monetary stimulus to tackle stubbornly high unemployment. |
0.0% |
|
|
Inflation |
In the 12 months to July the CPI rose 1.4%, slowing from June's 1.7% rise. Stripping out food and energy, inflation pressures were also tame. Core CPI rose 0.1%, the smallest increase since February, and breaking four consecutive months of 0.2% increases. |
|
|
Wed |
Empire Estate Mfg Index |
The New York Fed's "Empire State" general business conditions index dropped to minus 5.85 from 7.39 in July, missing expectations for 6.5. |
-5.85 |
|
|
Manufacturing |
The gauge of manufacturing in New York state unexpectedly contracted in August for the first time since October 2011 as new orders shrank further. |
|
|
Wed |
Treasury Intal Capital |
The closely watched figure of net long-term securities transactions showed total buying slowed sharply at $9.3 billion in long-term U.S. securities in June, after purchases of $55.9 billion the month before. |
$9.3B |
|
|
Balance of Payments |
Overall, foreigners were net buyers of long-term U.S. financial assets in June. While foreign investors boosted their holdings of Treasurys, they were net sellers of riskier assets such as corporate and agency bonds and equities. |
|
|
Wed |
Industrial Production |
Industrial production picked up in July after two months of slight growth, the Federal Reserve said Wednesday in the latest reading that shows the economy in the third quarter got off to a decent start. |
0.6% |
|
|
Manufacturing |
Industrial production rose 0.6% in July after slender 0.1% monthly gains in May and June, the Fed said. The Fed had previously reported a 0.4% gain in June and a 0.2% drop in May. |
|
|
Wed |
Housing Market Index |
Builder confidence in the market for newly built single-family homes climbed in August to the highest level in more than five years on expectations the recovery in housing can continue. |
37 |
|
|
Real Estate |
The National Association of Home Builders/Wells Fargo housing market index rose 2 points to a seasonally adjusted reading of 37, the best level since February 2007. |
|
|
Wed |
EIA Crude Oil Report |
Oil inventories fell 3.7 million barrels in the August 10 week but at a total of 366.2 million barrels they remain above their historical upper limit.� |
-3.7M |
|
|
Commodity |
Brent crude oil fell to around $113 on Friday after the United States said it was considering the possible release of oil reserves to dampen prices and the Israeli president spoke out against any lone Israeli attack on Iran. |
|
|
Thu |
Jobless/Initial Claims |
U.S. says initial jobless claims tick higher to 366,000 last week, up 2,000. The number of initial claims in the week ending Aug. 11 rose 2,000 to 366,000. The consensus was for claims to rise to 365,000. |
366K |
|
|
Employment |
Claims have been at the low end of the recent range. As a result, the four-week average fell 5,500 to 363,750. This is the lowest level since the week ended March 31. |
|
|
Tue |
Housing Starts |
Starts fell 1.1% in July to an annualized rate of 746,000 units; permits jump 6.8%. Starts had jumped a revised 6.8% in June to a 754,000 rate, the highest since October 2008. |
|
|
|
Real Estate |
Housing starts eased a bit in July after a strong June but permits showed moderate strength. Housing starts in July slipped 1.1%, following a 6.8% rebound the month before |
|
|
Tue |
Building Permits |
Strength in housing permits reinforces the perception that the rebound in housing shows resilience showing moderate upward momentum.� |
|
|
|
Real Estate |
Building permits increased 6.8% to a seasonally adjusted annual rate of 812,000 in July. This is the highest level since August 2008. |
|
|
Thu |
Philadelphia Fed Survey |
The Philadelphia Fed�s manufacturing index had a - 7.1 reading, which marks a slight improvement from July�s negative 12.9 reading but which came in below consensus -5.0 level. |
-7.1 |
|
|
Business Activity |
A measure of Philadelphia-area manufacturing was negative for a fourth month running,showing the continued worries industry insiders have in one of the leading indicators for the broader economy. |
|
|
Thu |
EIA Natural Gas Report |
The natural gas market had a weak reaction to yesterday's EIA inventory data that showed a smaller than expected injection last week of 20 bcf.
|
20 bcf |
|
|
Commodity |
This brought total storage to 3,261 bcf, or 12.5% above the five year average. While the market might have found support from recent US nuclear plant outages, moderating US weather forecasts and dissipating storm activity appeared to offset any potential demand increase. |
|
|
Thu |
Fed Balance Sheet |
The U.S. Federal Reserve's balance sheet shrank over the past week as the central bank continued its program to extend the maturity of its debt holdings. |
$-22.9B |
|
|
Government |
The Fed's asset holdings in the week ended Aug. 15 were $2.835 trillion, down from $2.858 trillion a week earlier, it said in a weekly report released Thursday. |
|
|
Thu |
M2 Money Supply |
|
$-17.8B |
|
|
Money Supply |
|
|
|
Fri |
Fixed Mortgage Rates |
Mortgage buyer Freddie Mac says the rate on the 30-year loan increased to 3.62%, up from 3.59% last week. Three weeks ago, the rate fell to 3.49%, the lowest since long-term mortgages began in the 1950s. |
3.62%
APR
|
|
|
Interest Rates |
The average rate on the 15-year fixed mortgage, a popular refinancing option, rose to 2.88%. That's up from 2.84% last week and record low of 2.80% three weeks ago. |
|
|
Fri |
Consumer Sentiment |
U.S. consumer sentiment improved in early August to its highest level in three months as sales at retailers and low mortgage rates spurred Americans to buy more. |
73.6 |
|
|
Consumer |
Concerns about rising food prices caused a jump in both short- and long-term inflation expectations. Despite that fact, consumer sentiment was a better-than-expected report for early august. |
|
|
Fri |
Leading Indicators |
The Conference Board said on Friday its Leading Economic Index climbed 0.4% to 95.8, reversing a 0.4% decline in June. |
0.4% |
|
|
Business Actvity |
Fewer jobless claims last month was the biggest driver in the increase of the index. Also, building permits jumped during the month, which could point to more construction down the road. |
|
|
|
|
|
|
|
|
|
|
|
|
|
|
|
|
|
|
|
|
|
|
|
|
|
|
| |
|
|
|
|
|
| |
|
|
|
|
|
| |
|
|
|
|
|
|
|
|
|
|
| |
|
| WEEK 33-2012 ENDING AUG. 17 |
Reports Commentary
Investors can perhaps take at least some comfort in the producer price data as it almost always takes a few higher readings before those prices start to show as actual inflation at the consumer level. Generally speaking, the businesses just have to absorb higher costs until they all have to start passing on the higher costs to Joe Public.
The Retail Sales report continues to support the emerging view that growth has not downshifted further at the start of the third quarter but may actually be showing a small pickup in activity.
Markets have rallied in large part from expectations for policy easing, yet the data are not suggesting an urgency for action
Historically, food prices have not been a significant driver of U.S. inflation compared with energy or core prices. Wholesale inflation has been trending lower in recent months.
producer prices climbing in July at the fastest pace in five months, although falling energy prices pointed to muted�inflation�pressures.
The retail sales and price data could also splash a bit of water on hopes the Federal Reserve could soon launch another bond-buying program to help the economy.
The reports suggest that the U.S. economy continues to grow, although at a slow pace.
Europe's debt crisis appears to be slowing growth around the world, including in China, and has pushed oil prices lower this year. The producer prices report reflected the drop in oil prices.
The data in Industrial Production showing both the improvement in output and the reduced level of spare capacity may weigh into the Fed’s decisions on whether to launch a third round of bond buying. Already, data showing a pick-up in hiring and gains in retail sales have pushed out expectations of easing.
Overall, analysts are expressing optimism about the nation’s housing market and with it, prospects for the economy.
However, with jobless claims moving lower, signs of modest recovery in housing, and a pickup in retail sales in July, we do not think that these survey reports are pointing to a deterioration in overall economic conditions.
The market moved a long way in quite a short time and we are now seeing some profit-taking,
Although the growth rate in personal consumption expenditures can be expected to rebound from the second quarter lull, growth can be expected to remain just under two percent to the end of the first quarter of 2013.
Strong retail sales during July has boosted the view that economic growth will pick up in the second half of the year but remain lackluster. Growth and hiring were disappointing in the spring, boosting expectations the Federal Reserve could unleash more economic stimulus |
|
| |
|
|
|
|
|
|
|
|
|
|
|
|
|
|
|
|
|
|
|
|
|
|
|
|
|
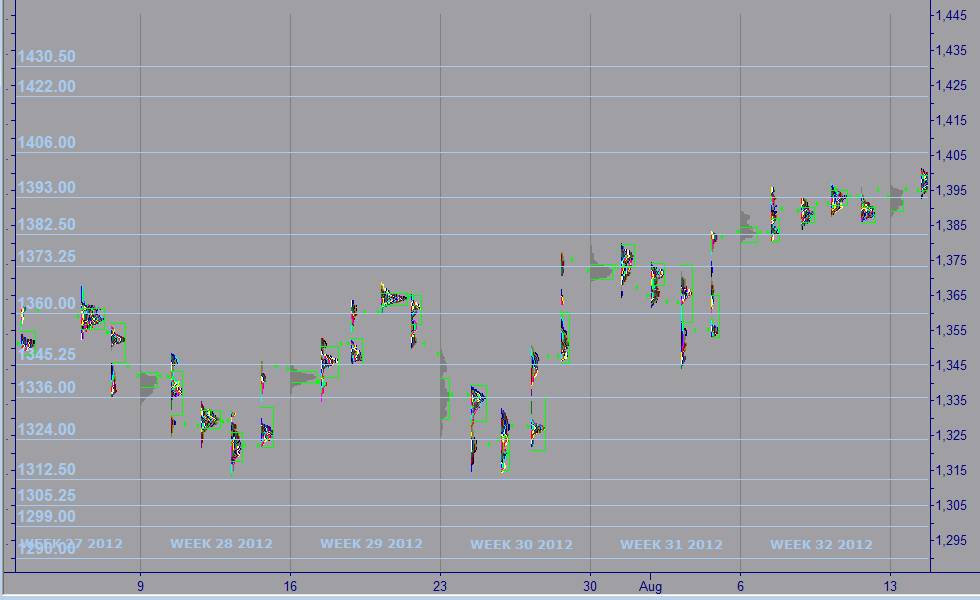
| MARKET PROFILE |
 |
WEEKS 2012 |
WEEK 33 |
% FROM CLOSE |
% FROM OPEN |
 |
RESISTANCE 1 |
1,330.25 |
1.39% |
1.35% |
|
RESISTANCE 2 |
1,326.25 |
1.08% |
1.04% |
 |
CLOSE MAR 02 |
1,350.00 |
|
|
|
OPEN MAR 04 |
1,255.00 |
0.04% |
|
 |
SUPPORT 1 |
1,289.00 |
0.66% |
0.62% |
|
SUPPORT 2 |
1,283.50 |
0.08% |
0.04% |
|
|
|
|
|
|
|
|
|
| |
|
|
|
|
|
| |
|
|
|
|
|
|
IMPORTANT NOTE: In an effort to comply with all applicable rules, regulations and disclosures please be so kind and read the "General Disclosure" below: |
| |
|
|
|
|
| GENERAL DISCLOSURE - TRADINGVESTING.COM |
- The material contained on our Website and Economic Calendar must be used at your own risk. Material is believed to be reliable, but we do not guarantee its accuracy or validity, nor is Tradingvesting.com responsible for any errors or omissions which may occur. The analysis and/or recommendations made by Tradingvesting.com do not provide, imply, or otherwise constitute a guarantee of performance. All contents and recommendations are based on data and sources believed to be reliable, but accuracy and completeness cannot be guaranteed. It should not be assumed that future results will be profitable or will equal past performance, real, indicated or implied.Tradingvesting.com website and material contained therein is not a solicitation to participate in the Futures/Stocks/Options Market. This Economic Calendar does not include Earning Releases, Announced Stock Splits, Upcoming Initial Public Offerings with Underwritings or Rating Changes. Tradingvesting.com has attempted to verify the information contained in this calendar. However, any aspect of such info may change without notice. Unless indicated otherwise: economic data is from the U.S and intraday data is at least 20 minutes delayed; all prices are in the local currency; Time is U.S. Eastern Time. Furthermore, there is a very high degree of risk involved in trading.Tradingvesting.com assumes no responsibilities for your trading and investment results, please red our Risk Disclosure.
- Tradingvesting.com does not provide investment advice, and does not represent that any of the information or related analysis is accurate or complete at any time. All information on this website are for educational purposes only and are not intended to provide financial advice. Any statements about profits or income, expressed or implied, do not represent a guarantee. Your actual trading may result in losses as no trading system is guaranteed. You accept full responsibilities for your actions, trades, profit or loss, and agree to hold Tradingvesting.com and any authorized distributors of this information harmless in any and all ways. We respect your right to privacy, please click here to view our privacy policy.
- U.S. Government Required Disclaimer - Commodity Futures Trading Commission.
Futures and options trading has large potential rewards, but also large potential risk. You must be aware of the risks and be willing to accept them in order to invest in the futures and options markets. Don't trade with money you can't afford to lose. This website is neither a solicitation nor an offer to Buy/Sell futures or options. No representation is being made that any account will or is likely to achieve profits or losses similar to those discussed on this website. The past performance of any trading system or methodology is not necessarily indicative of future results.
- CFTC rule 4.41:Hypothetical or simulated performance results have certain limitations. Unlike an actual performance record, simulated results do not represent actual trading. Also, since the trades have not been executed, the results may have under-or-over compensated for the impact, if any, of certain market factors, such as lack of liquidity. Simulated trading programs in general are also subject to the fact that they are designed with the benefit of hindsight. No representation is being made that any account will or is likely to achieve profit or losses similar to those shown.
- Risk Warning: Trading foreign exchange on margin carries a high level of risk, and may not be suitable for all investors. The high degree of leverage can work against you as well as for you. Before deciding to invest in foreign exchange you should carefully consider your investment objectives, level of experience, and risk appetite. The possibility exists that you could sustain a loss of some or all of your initial investment and therefore you should not invest money that you cannot afford to lose. You should be aware of all the risks associated with foreign exchange trading, and seek advice from an independent financial advisor if you have any doubts. Our linking to these sites does not constitute an endorsement of any products, services or the information found on them. Once you link to another site you are subject to the policies of the new site. By using this site, you agree to the Terms of Service, Privacy Policy and Risk Disclosure. Copyright � 2012 Tradingvesting, LLC. All rights reserved. If you have any questions regarding the Online Economic Calendar application, please contact us: click here.
THIS BRIEF STATEMENT CANNOT, OF COURSE, DISCLOSE ALL THE RISKS AND OTHER ASPECTS OF THE COMMODITY MARKETS AND EQUITY MARKETS. PLEASE READ MORE AT: TERMS OF SERVICE.
|
|
|
| |
|
|
|
|
|
| |
|
|
|
|
|