 |
 |
|
|
|
Week 21 -2012 | From May 21 to May 25, 2012 |
|
 |
|
|
|
|
|
|
| |
|
|
|
|
|
|
|
|
|
|
| |
Economic Data for Week 21-2012 | Global View | Week Rating
| DATE |
DAY |
REPORT/CATEGORY |
HIGHLIGHTS ON WEEK 21-2012 |
LAST |
|
Mon |
Chicago Fed Nat Activity Index |
In April, two of the four economic indicator categories improved, causing the overall CFNAI to increase to +0.11, from -0.44 in March. |
0.11 |
|
 |
Growth |
The three-month moving average decreased to -0.06 in April, from +0.02 in March. The March monthly index was revised to -0.44 from an initial estimate of -0.29 due to revisions. |
|
|
Tue |
ICSC Goldman Sachs Index |
The steady sell off in the stock market mirrors a pullback underway in retail sales. The ICSC index standing at minus 1.7 % in the May 19 week, is down for a fourth week in a row. |
-1.7% W/W |
|
|
Sales and Inventories |
The year-on-year rate is down seven tenths to plus 3.8 %. The report notes little positive effect from favorable weather or from lower gas prices. |
|
|
Tue |
Johnson Redbook |
Redbook reports 2.7 % year-on-year same-store sales growth in the May 19 week, a full percentage point drop from the prior week and confirming weakness reported earlier this morning from ICSC-Goldman. |
2.7% Y/Y |
|
|
Sales and Inventories |
ICSC-Goldman describes the week's weather as favorable but not Redbook which calls it cool and wet and which it says hurt apparel sales, lawn & garden sales, and sales of sporting goods. |
|
|
Tue |
exis |
Existing Home sales Report for April came with solid gains, but below expectations. The annual rate of 4.620 million is up 3.4% from March. |
4.62M |
|
|
Real Estate |
The Existing Home sales Report for April may be a little below expectations but the Dow is moving higher in reaction to today's report. |
|
|
Wed |
MBA purchase Applications |
Purchase applications fell 3.0 % in the May 18 week, posting back-to-back declines and offering an early signal of weakness for May home sales. |
3.8% W/W |
|
|
Real Estate |
Refinance applications rose 5.6 %, extending a strong upward trend tied to low interest rates. |
|
|
|
fhfa |
The FHFA home price index rose an outsized 1.8% in March vs a 0.3% gain and a 0.5% decline in the two prior months. The March headline reading was better than the monthly gain of 0.4% expected by consensus. |
1.8% M/M |
|
|
|
The FHFA home price index rose a seasonally adjusted 1.8% m/m in March and 2.7% on a year over year basis, after rising just 0.3% m/m in February. |
|
|
Wed |
New Home Sales |
Americans bought more new homes in April, the latest signal that the U.S. housing market is steadily improving. |
343K |
|
|
Real Estate |
The Commerce Department said Wednesday that sales increased 3.3 % in April from March to a seasonally adjusted annual rate of 343,000. |
|
|
Wed |
EIA Crude Oil Report |
|
N/A |
|
|
Commodity |
|
|
|
Thu |
HSBC China Flash PMI |
May HSBC flash manufacturing PMI slid to a two month low of 48.7. The index reading in April was 49.3. The manufacturing output index edged upward however, to a reading of 50.5 from 49.3 in April. A reading above 50 signifies growth. New orders and new export orders contracted as did employment. |
48.7 |
|
|
China |
|
|
|
Thu |
Jobless/Initial Claims |
Initial claims for the May 19 week came in at 370,000 vs a revised 372,000 in the prior week and compared with another 370,000 reading the week before. |
370,000 |
|
|
Employment |
The four-week average is down for a third week in a row, also at 370,000 for a roughly 15,000 improvement from late April. |
|
|
Thu |
Durable Goods Orders |
Demand for long-lasting U.S. manufactured goods rebounded more than expected in May, 0.2%, and a gauge of planned business spending increased, but a cooling global economy suggests the momentum might not be sustained. |
0.2% |
|
|
Manufacturing |
U.S. durable goods orders up but trend, outlook weak. Today's report indicates softening in the manufacturing sector. |
|
|
|
PMI Mafg Index Flash |
|
N/A |
|
|
|
|
|
|
Thu |
ISM Non-Mfg Index |
|
N/A |
|
|
Sales and Inventories |
|
|
|
Thu |
EIA Natural Gas Report |
|
N/A |
|
|
Commodity |
|
|
|
Thu |
Fed Balance Sheet |
|
N/A |
|
|
Government |
|
|
|
Thu |
M2 Money Supply |
|
N/A |
|
|
Money Supply |
|
|
|
Fri |
Fixed Mortgage Rates |
The 30-year fixed mortgage, the most popular mortgage product, dipped slightly to 3.78% from 3.79%. Last year, 30-year loans averaged 4.60%. The new low can save borrowers $48 a month for every $100,000 borrowed. Over a 30-year term, that comes to $17,217 compared to last year. |
3.78%
APR
|
|
|
Interest Rates |
The 15-year fixed mortgage, which is popular among those looking to refinance, held steady at 3.04%, according to Freddie Mac's survey. That's down from 3.78% a year ago. |
|
|
Fri |
Consumer Sentiment |
The US consumer sentiment is clearly stronger than it's ever been during the recovery. This last reading shows that the rise in optimism is now picking up intensity. |
79.3 |
|
|
Consumer |
The Reuters/University of Michigan index jumped to 79.3, up nearly 3 points from April and up 1.5 points from the mid-month reading. |
|
|
|
|
|
|
|
|
|
|
|
|
|
|
|
|
|
|
|
|
|
|
|
|
|
|
| |
|
|
|
|
|
| |
|
|
|
|
|
| |
|
|
|
|
|
|
|
|
|
|
| |
|
| WEEK 15-2012 ENDING MAY. 25 |
Reports Commentary
Factory orders fell in January in the typical pattern of declines in the first month of the quarter. Nevertheless, new orders have been on a rising trend since March 2009 although they remain below their pre-recession peak..
|
|
| |
|
|
|
|
|
|
|
|
|
|
|
|
|
|
|
|
|
|
|
|
|
|
|
|
|
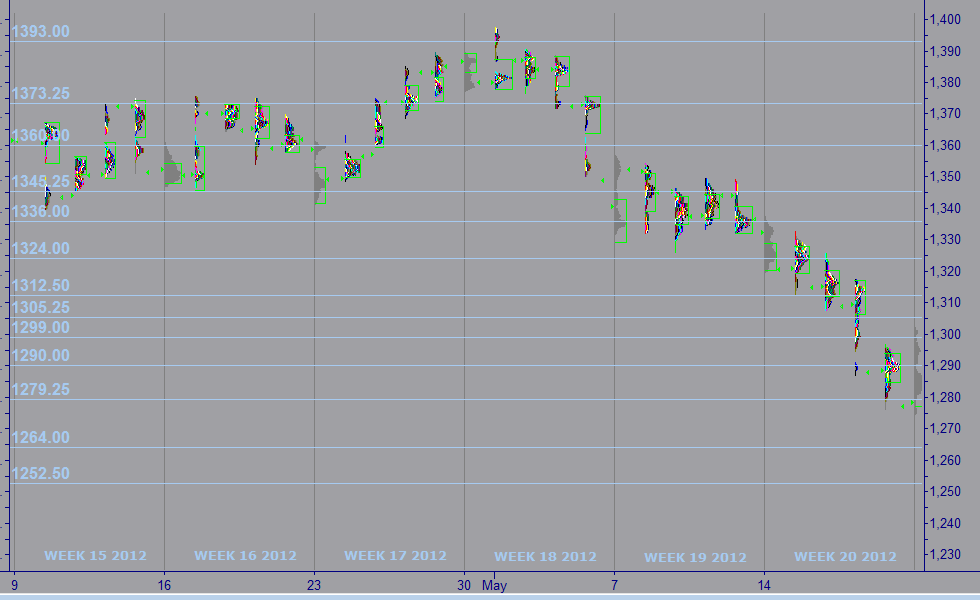
| MARKET PROFILE |
 |
WEEKS 2012 |
WEEK 21 |
% FROM CLOSE |
% FROM OPEN |
 |
RESISTANCE 1 |
1,330.25 |
1.39% |
1.35% |
|
RESISTANCE 2 |
1,326.25 |
1.08% |
1.04% |
 |
CLOSE MAR 02 |
1,350.00 |
|
|
|
OPEN MAR 04 |
1,255.00 |
0.04% |
|
 |
SUPPORT 1 |
1,289.00 |
0.66% |
0.62% |
|
SUPPORT 2 |
1,283.50 |
0.08% |
0.04% |
|
|
|
|
|
|
|
|
|
| |
|
|
|
|
|
| |
|
|
|
|
|
|
IMPORTANT NOTE: In an effort to comply with all applicable rules, regulations and disclosures please be so kind and read the "General Disclosure" below: |
| |
|
|
|
|
| GENERAL DISCLOSURE - TRADINGVESTING.COM |
- The material contained on our Website and Economic Calendar must be used at your own risk. Material is believed to be reliable, but we do not guarantee its accuracy or validity, nor is Tradingvesting.com responsible for any errors or omissions which may occur. The analysis and/or recommendations made by Tradingvesting.com do not provide, imply, or otherwise constitute a guarantee of performance. All contents and recommendations are based on data and sources believed to be reliable, but accuracy and completeness cannot be guaranteed. It should not be assumed that future results will be profitable or will equal past performance, real, indicated or implied.Tradingvesting.com website and material contained therein is not a solicitation to participate in the Futures/Stocks/Options Market. This Economic Calendar does not include Earning Releases, Announced Stock Splits, Upcoming Initial Public Offerings with Underwritings or Rating Changes. Tradingvesting.com has attempted to verify the information contained in this calendar. However, any aspect of such info may change without notice. Unless indicated otherwise: economic data is from the U.S and intraday data is at least 20 minutes delayed; all prices are in the local currency; Time is U.S. Eastern Time. Furthermore, there is a very high degree of risk involved in trading.Tradingvesting.com assumes no responsibilities for your trading and investment results, please red our Risk Disclosure.
- Tradingvesting.com does not provide investment advice, and does not represent that any of the information or related analysis is accurate or complete at any time. All information on this website are for educational purposes only and are not intended to provide financial advice. Any statements about profits or income, expressed or implied, do not represent a guarantee. Your actual trading may result in losses as no trading system is guaranteed. You accept full responsibilities for your actions, trades, profit or loss, and agree to hold Tradingvesting.com and any authorized distributors of this information harmless in any and all ways. We respect your right to privacy, please click here to view our privacy policy.
- U.S. Government Required Disclaimer - Commodity Futures Trading Commission.
Futures and options trading has large potential rewards, but also large potential risk. You must be aware of the risks and be willing to accept them in order to invest in the futures and options markets. Don't trade with money you can't afford to lose. This website is neither a solicitation nor an offer to Buy/Sell futures or options. No representation is being made that any account will or is likely to achieve profits or losses similar to those discussed on this website. The past performance of any trading system or methodology is not necessarily indicative of future results.
- CFTC rule 4.41:Hypothetical or simulated performance results have certain limitations. Unlike an actual performance record, simulated results do not represent actual trading. Also, since the trades have not been executed, the results may have under-or-over compensated for the impact, if any, of certain market factors, such as lack of liquidity. Simulated trading programs in general are also subject to the fact that they are designed with the benefit of hindsight. No representation is being made that any account will or is likely to achieve profit or losses similar to those shown.
- Risk Warning: Trading foreign exchange on margin carries a high level of risk, and may not be suitable for all investors. The high degree of leverage can work against you as well as for you. Before deciding to invest in foreign exchange you should carefully consider your investment objectives, level of experience, and risk appetite. The possibility exists that you could sustain a loss of some or all of your initial investment and therefore you should not invest money that you cannot afford to lose. You should be aware of all the risks associated with foreign exchange trading, and seek advice from an independent financial advisor if you have any doubts. Our linking to these sites does not constitute an endorsement of any products, services or the information found on them. Once you link to another site you are subject to the policies of the new site. By using this site, you agree to the Terms of Service, Privacy Policy and Risk Disclosure. Copyright � 2012 Tradingvesting, LLC. All rights reserved. If you have any questions regarding the Online Economic Calendar application, please contact us: click here.
THIS BRIEF STATEMENT CANNOT, OF COURSE, DISCLOSE ALL THE RISKS AND OTHER ASPECTS OF THE COMMODITY MARKETS AND EQUITY MARKETS. PLEASE READ MORE AT: TERMS OF SERVICE.
|
|
|
| |
|
|
|
|
|
| |
|
|
|
|
|