|
 |
|
|
|
Week 10 -2012 | From Mar 05 to Mar 09, 2012 |
|
 |
|
|
|
|
|
|
| |
|
|
|
|
|
|
|
|
|
|
| |
Economic Data for Week 10-2012 | Global View | Week Rating
| DATE |
DAY |
REPORT/CATEGORY |
HIGHLIGHTS ON WEEK 10-2012 |
Last |
|
Mon |
Factory Orders |
U.S. factory orders fell in January, 1%, by the most in 15 months after businesses sharply reduced orders for machinery and equipment. |
-1.0% M/M |
|
 |
Manufacturing |
The decrease was largely expected after a tax cut expired at the end of last year. Even with the decline, orders have gradually been climbing back to near pre-recession levels |
|
|
Mon |
ISM Non-Mfg Index |
The February 2012 ISM Non-manufacturing report shows the overall index increased +0.5 to 57.3%. The NMI is also referred to as the services index, or service sector index. |
57.3
Level |
|
|
Business Actvity |
The Institute for Supply Management�s non-manufacturing index climbed to 57.3 from 56.8 in January. The ISM non-manufacturing survey�s measure of new orders increased to 61.2, a one-year high. |
|
|
Tue |
ICSC Goldman Sachs Index |
Weekly same-store sales rose 1.3% in the March 3 week though the year-on-year rate slid sharply to plus 1.7%: reflecting a modest pickup in discount store business. |
1.3% W/W |
|
|
Sales and Inventories |
ICSC-Goldman points to cross currents affecting the consumer with the improving economy a plus but high gas prices a negative. |
|
|
Tue |
Johnson Redbook |
The Johnson Redbook Index also showed seasonally adjusted sales for the period were up 3% from last year, compared with a 3.3% targeted gain. |
3.0% Y/Y |
|
|
Sales and Inventories |
Redbook: US Retail Sales Up 0.1% In First Week Of March Vs Feb. Redbook said several tornados across the central and southern U.S. hurt retailers� buisiness this weekend. |
|
|
Wed |
MBA purchase Applications |
Mortgage applications decreased 1.2% from one week earlier for the week ending March 2, 2012. The seasonally adjusted Purchase Index increased 2.1% from one week earlier. |
-1.2% |
|
|
Real Estate |
The Market Composite Index, a measure of mortgage loan application volume, decreased 1.2% on a seasonally adjusted basis from one week earlier.� |
|
|
Wed |
ADP Employment Report |
The ADP National Employment Report showed an increase of 216,000 in the workforce. February�s report showed that employment has continued to grow in the US economy. |
216,000 Jobs |
|
|
Employment |
Analysts had expected an increase of between 215,000 in employment in February. The results Followed January�s numbers which showed an increase of around 170,000 in employment. |
|
|
Wed |
Productivity and Costs |
Nonfarm business sector labor productivity increased at a 0.9% annual rate during the fourth quarter of 2011, the U.S. Bureau of Labor Statistics reported today. |
2.8% ULC |
|
|
Business Actvity |
The gain in productivity reflects increases of 3.7% in output and 2.7% in hours worked. Productivity gains continue but at a modest pace. |
|
|
Wed |
EIA Crude Oil Report |
US commercial crude inventories rose by 800,000 barrels last week, bringing the total US commercial crude inventory to 345.7 million barrels. |
0.8M Barrels |
|
|
Commodity |
Higher inventories and the decline in gasoline supplied indicate demand continues to fall in the US. The price of fuel is climbing and demand for fuel is falling. |
|
|
Wed |
Consumer Credit |
Consumer credit expanded sharply in January in a generally positive sign for the economy as people borrowed money to buy cars and go to school. |
$17.8B |
|
|
Consumer |
Total consumer credit grew by $17.776 billion in January, which was above the $10.0 billion increase that was expected by analysts. |
|
|
Thu |
Jobless/Initial Claims |
Applications for unemployment insurance payments increased by 8,000 in the week ended March 3. After three months of improvement from the 400,000 area to the 350,000 area. |
362,000 claims |
|
|
Employment |
The rate of firings indicates companies have grown more comfortable with headcounts and could take on additional employees when demand picks up. |
|
|
Thu |
EIA Natural Gas Report |
Natural gas in storage fell 80 billion cubic feet in the March 2 week to 2,433 billion cubic feet . A withdrawal of 85 bcf was expected. |
-80bcf |
|
|
Commodity |
The amount of natural gas in storage in the U.S. fell 80 bcf to 2.433 trillion cubic feet last week: demand will remain weak. At the same time, supplies have stayed well above year-ago levels. |
|
|
Thu |
Fed Balance Sheet |
The Fed's balance sheet shrank sharply in the latest week but it was mostly due to improved financial conditions in Europe. |
$-41.0B |
|
|
Government |
For the March 7 week, the Fed's balance sheet shrank $41.0 billion after dropping $7.1 billion the week before. The decline was led by a $36.4 billion decrease in central bank liquidity swaps. |
|
|
Thu |
M2 Money Supply |
|
$-3.7B |
|
|
Money Supply |
|
|
|
Fri |
Fixed Mortgage Rates |
The mortgage giant said that 30-year fixed-rate mortgage (FRM) was 3.88% for the week ending March 8, down from last week' s 3.90%. Last year at this time, the 30-year FRM averaged 4.88%. |
3.88%
APR |
|
|
Interest Rates |
The 15-year FRM dropped to a new record low of 3.13%. A year ago at this time, the 15-year FRM averaged 4.15%. |
|
|
Fri |
Employment Situation |
Nonfarm payroll employment rose by 227,000 in February, and the unemployment rate was unchanged at 8.3%. Payroll jobs in February grew 227,000 after gaining 284,000 in January. |
8.3% Rate |
|
|
Employment |
Employment rose in professional and businesses services, health care and social assistance, leisure and hospitality, manufacturing, and mining. |
|
|
Fri |
U.S. Trade Balance |
The U.S. trade deficit surged to the widest imbalance in more than three years in January as imports hit an all-time high, reflecting big demand for foreign-made cars, computers and food products. |
$-52.6B |
|
|
Balance of Payments |
The January trade deficit widened to $52.6 billion, the biggest gap since October 2008. Imports rose 2.1% to a record $233.4 billion. Exports were up a smaller 1.4% to $180.8 billion. |
|
|
Fri |
Wholesale Trade |
The stock-to-sales ratio is unchanged at a very efficient 1.15 and the wholesale inventories continue to trend lower relative to sales, a trend that's more positively pronounced in the factory sector. |
0.4% |
|
|
Sales and Inventories |
January was a soft month for the wholesale sector where inventories were at 0.4%. Remember that Wholesale inventories rose 1.0% in December. |
|
|
|
|
|
|
|
|
|
|
|
|
|
|
|
|
|
|
|
|
|
|
|
|
|
|
| |
|
|
|
|
|
| |
|
|
|
|
|
| |
|
|
|
|
|
|
|
|
|
|
| |
|
| WEEK 10-2012 ENDING MAR. 09 |
Reports Commentary
Factory orders fell in January in the typical pattern of declines in the first month of the quarter. Nevertheless, new orders have been on a rising trend since March 2009 although they remain below their pre-recession peak..
|
|
| |
|
|
|
|
|
|
|
|
|
|
|
|
|
|
|
|
|
|
|
|
|
|
|
|
|
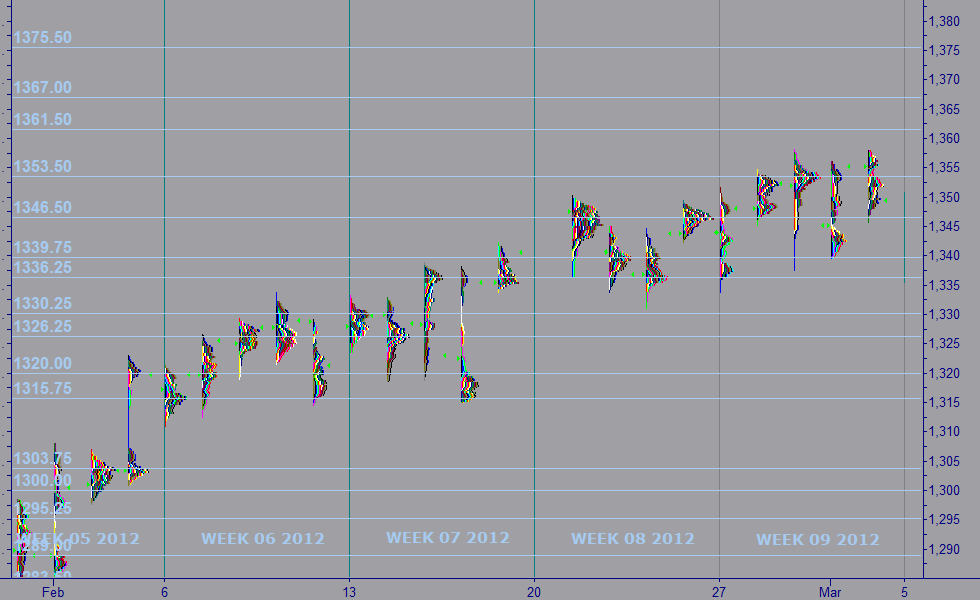
| MARKET PROFILE |
 |
WEEKS 2012 |
WEEK 10 |
% FROM CLOSE |
% FROM OPEN |
 |
RESISTANCE 1 |
1,367.00 |
1.33% |
1.59% |
|
RESISTANCE 2 |
1,361.50 |
0.93% |
1.15% |
 |
CLOSE MAR 02 |
1,349.00 |
|
|
|
OPEN MAR 04 |
1,347.00 |
-0.15% |
|
 |
SUPPORT 1 |
1,336.25 |
-0.95% |
-0.86% |
|
SUPPORT 2 |
1,320.00 |
-2.15% |
-2.15% |
|
|
|
|
|
|
|
|
|
| |
|
|
|
|
|
| |
|
|
|
|
|
|
IMPORTANT NOTE: In an effort to comply with all applicable rules, regulations and disclosures please be so kind and read the "General Disclosure" below: |
| |
|
|
|
|
| GENERAL DISCLOSURE - TRADINGVESTING.COM |
- The material contained on our Website and Economic Calendar must be used at your own risk. Material is believed to be reliable, but we do not guarantee its accuracy or validity, nor is Tradingvesting.com responsible for any errors or omissions which may occur. The analysis and/or recommendations made by Tradingvesting.com do not provide, imply, or otherwise constitute a guarantee of performance. All contents and recommendations are based on data and sources believed to be reliable, but accuracy and completeness cannot be guaranteed. It should not be assumed that future results will be profitable or will equal past performance, real, indicated or implied.Tradingvesting.com website and material contained therein is not a solicitation to participate in the Futures/Stocks/Options Market. This Economic Calendar does not include Earning Releases, Announced Stock Splits, Upcoming Initial Public Offerings with Underwritings or Rating Changes. Tradingvesting.com has attempted to verify the information contained in this calendar. However, any aspect of such info may change without notice. Unless indicated otherwise: economic data is from the U.S and intraday data is at least 20 minutes delayed; all prices are in the local currency; Time is U.S. Eastern Time. Furthermore, there is a very high degree of risk involved in trading.Tradingvesting.com assumes no responsibilities for your trading and investment results, please red our Risk Disclosure.
- Tradingvesting.com does not provide investment advice, and does not represent that any of the information or related analysis is accurate or complete at any time. All information on this website are for educational purposes only and are not intended to provide financial advice. Any statements about profits or income, expressed or implied, do not represent a guarantee. Your actual trading may result in losses as no trading system is guaranteed. You accept full responsibilities for your actions, trades, profit or loss, and agree to hold Tradingvesting.com and any authorized distributors of this information harmless in any and all ways. We respect your right to privacy, please click here to view our privacy policy.
- U.S. Government Required Disclaimer - Commodity Futures Trading Commission.
Futures and options trading has large potential rewards, but also large potential risk. You must be aware of the risks and be willing to accept them in order to invest in the futures and options markets. Don't trade with money you can't afford to lose. This website is neither a solicitation nor an offer to Buy/Sell futures or options. No representation is being made that any account will or is likely to achieve profits or losses similar to those discussed on this website. The past performance of any trading system or methodology is not necessarily indicative of future results.
- CFTC rule 4.41:Hypothetical or simulated performance results have certain limitations. Unlike an actual performance record, simulated results do not represent actual trading. Also, since the trades have not been executed, the results may have under-or-over compensated for the impact, if any, of certain market factors, such as lack of liquidity. Simulated trading programs in general are also subject to the fact that they are designed with the benefit of hindsight. No representation is being made that any account will or is likely to achieve profit or losses similar to those shown.
- Risk Warning: Trading foreign exchange on margin carries a high level of risk, and may not be suitable for all investors. The high degree of leverage can work against you as well as for you. Before deciding to invest in foreign exchange you should carefully consider your investment objectives, level of experience, and risk appetite. The possibility exists that you could sustain a loss of some or all of your initial investment and therefore you should not invest money that you cannot afford to lose. You should be aware of all the risks associated with foreign exchange trading, and seek advice from an independent financial advisor if you have any doubts. Our linking to these sites does not constitute an endorsement of any products, services or the information found on them. Once you link to another site you are subject to the policies of the new site. By using this site, you agree to the Terms of Service, Privacy Policy and Risk Disclosure. Copyright � 2012 Tradingvesting, LLC. All rights reserved. If you have any questions regarding the Online Economic Calendar application, please contact us: click here.
THIS BRIEF STATEMENT CANNOT, OF COURSE, DISCLOSE ALL THE RISKS AND OTHER ASPECTS OF THE COMMODITY MARKETS AND EQUITY MARKETS. PLEASE READ MORE AT: TERMS OF SERVICE.
|
|
|
| |
|
|
|
|
|
| |
|
|
|
|
|