 |
 |
|
|
|
Week 40 -2012 | From Oct 01 to Oct 05, 2012 |
|
 |
|
|
|
|
|
|
| |
|
|
|
|
|
|
|
|
|
|
| |
Economic Data for Week 40-2012 | Global View | Week Rating
| DATE |
DAY |
REPORT/CATEGORY |
HIGHLIGHTS ON WEEK 40-2012 |
LAST |
|
Mon |
ISM Manufacturing Index |
The manufacturing sector expanded for the first time since May, with the ISM index rising to 51.5 in September from 49.6 in August. Economists had expected a reading of 49.7. |
51.5 |
|
 |
Manufacturing |
Green Flag for manufacturing. The U.S. manufacturing sector expands in September for the first time in four months. Keep in mind that a reading above 50 indicates an expansion. |
|
|
Mon |
Construction Spending |
Construction Spending slumped by the most in a year, falling 0.6% in August to an annual rate of $837.1 billion. Construction spending fell well below analysts' expectations of a 0.5% gain. |
-0.6% |
|
|
Growth |
Outlays for U.S. construction projects fell for the second month in August, the Commerce Department reported Monday. One bright spot was a 0.9% gain in private homebuilding in the month.� |
|
|
Tue |
ICSC Goldman Index |
ICSC-Goldman reports a 0.3% same-store sales decline in the September 29 week for a year-on-year rate that is down five tenths to plus 2.4%. |
0.3%
W/W
|
|
|
Sales and Inventories |
ICSC-Goldman store sales are now up 2.4% year over year, lower than the 2.9% Y/Y gains a week ago. |
|
|
Tue |
Johnson Redbook |
Redbook said the cooler weather in much of the country helped to drive demand for fall apparel and bolstered foot traffic in malls. |
|
|
|
Sales and Inventories |
Redbook store sales are now up 2.3% Y/Y, higher than the 2.0% Y/Y increase last week. Redbook: U.S. retail sales up 1.6% in Sept. period |
|
|
Thu |
Motor Vehicle Sales |
Auto sales are reported Tuesday. Truecar.com expects car sales rose 11% from last year to 1.2 million, for a seasonally adjust selling rate of 14.6 million compared to 14.5 million in August. |
|
|
|
Sales and Inventories |
U.S. total vehicle sales rose more-than-expected last month. In a report, Autodata Corp. said that U.S. Total Vehicle Sales rose to a seasonally adjusted 15.00M, from 14.50M in the preceding month whose figure was revised down from 14.52M. |
|
|
Wed |
MBA purchase Applications |
Applications for U.S. home mortgages surged last week as demand for refinancing rose to the highest level in more than three years, driven by a drop in interest rates to yet another record low, data from an industry group showed on Wednesday. |
16.6%
W/W
|
|
|
Real Estate |
The MBA said its seasonally adjusted index of mortgage application activity, which includes both refinancing and home purchase demand, jumped 16.6% in the week ended Sept 28. The index of refinancing applications surged 19.6%, hitting the highest level since April 2009. |
|
|
Wed |
ADP Employment Report |
Private Sector Jobs Beat Estimates; Service Sector Jumps. The private sector created 162,000 jobs in September, a bit better than expected, as the service sector continued to be the economy's main employment driver, according to the latest ADP numbers. |
162,000
Jobs
|
|
|
Employment |
Small businesses added 81,000 while medium-sized firms added 64,000, with large companies adding just 17,000 for the the month, the report from ADP and Macroeconomic Advisors said. |
|
|
Wed |
ISM Non-Mfg Index |
ISM Non-Manufacturing Rises To 55.1, Highest Since March. The ISM's nonmanufacturing purchasing managers' index came in at 55.1 last month, up from 53.7 in August. The September index was the highest PMI since March 2012. |
55.1 |
|
|
Business Actvity |
The ISM reports that the ISM non-manufacturing, or services, index rose to 55.1 in September, better than the 53.7 reading in August and the highest the index has been since March. |
|
|
Wed |
EIA Crude Oil Report |
Energy commodities, excluding natural gas, dropped on Tuesday amid renewed eurozone woes. Market participants were confused as Spain may delay applying for the next bailout. However, broadly weaker US Dollar as well as slightly improved manufacturing activity limited the downswing. |
N/A |
|
|
Commodity |
U.S. crude oil stocks declined unexpectedly lastweek and distillate inventories fell more steeply than forecast, government datashowed on Wednesday. |
|
|
Thu |
Jobless/Initial Claims |
The number of Americans filing new claims for unemployment benefits rose less than expected last week, according government data on Thursday that suggested a mild improvement in the labor market. |
367K |
|
|
Employment |
Initial claims for state unemployment benefits climbed 4,000 to a seasonally adjusted 367,000, the Labor Department said.The prior week's figure was revised up to show 4,000 more applications than previously reported. |
|
|
Thu |
Factory Orders |
Factory orders in August decreased $24.9 billion, a 5.2% reduction bringing total orders to $452.8 billion. This followed a 2.6% July increase, and is the largest monthly loss since January of 2009. Factory orders are now up 3.7% year over year, well under the 4.7% they were up Y/Y in July. |
-5.2% |
|
|
Manufacturing |
U.S. Factory Orders Drop 5.2% In August, Largest Drop Since January 2009, but the second straight month of gains in orders outside transportation hinted at a less rapid loss of momentum in manufacturing activity. |
|
|
Thu |
EIA Natural Gas Report |
U.S. natural gas futures tradedslightly lower on Thursday, pressured by milder mid-monthweather forecasts and a government report showing a weeklyinventory uild well above market exectations. |
N/A |
|
|
Commodity |
The U.S. Energy Information Administration said domestic gasinventories rose last week by 77 billion cubic feet to 3.653trillion cubic feet. |
|
|
Thu |
FOMC Minutes #6 |
Job-market weakness and global uncertainty built case for 'QE3': Fed minutes. The minutes of the Sept. 12-13 FOMC meeting indicated the central bank will talk more about the idea of conditioning future action on numerical targets instead of a calendar data, and the Fed also is weighing adopting a consensus forecast. |
N/A |
|
|
Interest Rates |
The sluggish job market and worries about Europe's debt crisis, Chinese growth and the so-called fiscal cliff closer to home pressed the Federal Reserve into launching its third round of large-scale bond buys, according to minutes released Thursday. The minutes also showed "some participants" were less confident the new bond buys would work as well as past programs. |
|
|
Thu |
Fed Balance Sheet |
The U.S. Federal Reserve's balance sheet grew in the latest week with expanded holdings of U.S. Treasury debt, Fed data released on Thursday showed. |
N/A |
|
|
Government |
The Fed's balance sheet - a broad gauge of its lending to the financial system - stood at $2.791 trillion on October 3, up from $2.787 trillion on September 26.illion on October 3, up from $2.787 trillion on September 26. |
|
|
Thu |
M2 Money Supply |
|
N/A |
|
|
Money Supply |
|
|
|
Fri |
Fixed Mortgage Rates |
Fixed mortgage rates fell to new lows for the second straight week thanks to a Federal Reserve stimulus program, with the interest rate for a 30-year mortgage averaging 3.36%, down from 3.4% a week ago, according to the latest Freddie Mac survey of lenders. |
3.36% |
|
|
Interest Rates |
The Fed’s purchases of long-term fixed-rate mortgage securities pushed the average interest rate for a 15-year fixed mortgage down to 2.69% from 2.73% a week ago. � |
|
|
Fri |
Employment Situation |
Job growth remained tame in September, with the economy creating just 114,000 net new positions though the unemployment rate fell to 7.8%, the first time it has been below 8% in 43 months. The labor force participation rate edged higher to 63.6 but remained around 30-year lows. |
7.8%
Rate
|
|
|
Employment |
Employers added 114,000 jobs in September. The economy also created 86,000 more jobs in July and August than first estimated. Wages rose in September and more people started looking for work. |
|
|
Fri |
Consumer Credit |
U.S. Consumer Credit Comes Roaring Back, Up $18.1 Billion In AugustThe Federal Reserve says that total consumer borrowing increased $18.1 billion in August compared to July |
$18.1B |
|
|
Consumer |
US consumer credit up $18.1 billion in August. Americans boosted their borrowing in August by the largest amount in three months with strong gains in the category that covers auto and student loans and in credit card debt. |
|
|
|
|
|
|
|
|
|
|
|
|
|
|
|
|
|
|
|
|
|
|
|
|
|
|
| |
|
|
|
|
|
| |
|
|
|
|
|
| |
|
|
|
|
|
|
|
|
|
|
| |
|
| WEEK 40-2012 OCT. 05 |
Reports Commentary
Fiscal cliff is used to describe the double whammy to the economy that could come from the dual expiration of Bush-era tax cuts and automatic spending cuts Jan. 1, if the lame duck Congress does not act. The outcome on taxes and spending is expected to be different, depending on who wins the White House and Senate in November.
U.S. auto sales last month posted their best showing in 4-1/2 years, helped by cheap financing, rising consumer confidence and a major rebound by Toyota Motor. 1.3% GDP Means Retailers Are Going to Have a Poor Christmas.
The September sales pace was 14.94 million vehicles as calculated on an annualized basis, exceeding analyst estimates of 14.5 million, according to Autodata Corp. This was the highest rate since March 2008, about four months after the start of the 2007-2009 U.S. recession.
U.S. auto sales last month rose 13% to 1,188,865 new vehicles. Analysts, on average, had expected an increase of less than 9 percent. The money is so cheap now," said Jesse Toprak, TrueCar.com analyst. "Higher resale values and cheap money has been enabling automakers to offer some of the most attractive leasing programs we've seen in years."
US Mortgage Applications Jump as Low Rates Spur Refi Demand. Financial markets continue to adjust to QE3, as the ongoing presence of the Federal Reserve as a significant buyer of mortgage-backed securities applies downward pressure on rates.
Jobs growth of 130,000 a month or so would keep the unemployment rate constant. Plus or minus 30 or 40,000 above or below that is essentially noise," Joel Prakken, chairman of Macroeconomic Advisors, told CNBC. "In order to push the unemployment rate down convincingly, we've got to have faster growth than we've been seeing and we just haven't seen that for the better part of this recovery."
ADP's count can be volatile and dramatically off the government's official total, which will be released Friday.
In September, ADP raised hopes that the jobs engine was humming along, with the private sector creating 201,000 positions in August. However, when the government released its own count it found that the actual overall total for the economy was just 96,000 new jobs.
The trend is still looking fairly stable. The labor market is improving but it is not really gathering direction for better or worse, it is still just plodding along. Manufacturing has carried the economic recovery and while activity has cooled significantly in recent months, there are so far little signs of a hard landing.
U.S. Factory Orders Drop 5.2% In August, Largest Drop Since January 2009. New orders for manufactured goods tumbled 5.2% � the biggest drop since the recession � dragged down by a slump in demand for transportation equipment that was telegraphed in last week's report on orders for long-lasting manufactured goodsFactory orders had risen 2.8 % in July and economists had expected them to drop 5.8% in August.
The U.S. Federal Reserve may adopt numerical thresholds for inflation and joblessness that would serve as guideposts for policy, according to minutes from a September meeting that revealed some reticence about the central bank's latest stimulus. Minutes of the Sept. 12-13 meeting released on Thursday showed the Fed was broadly in agreement that more policy stimulus was needed given a meager economic recovery, which registered a paltry 1.3 percent annual rate of growth in the second quarter.
The Institute for Supply Management on Wednesday said its services index rose to 55.1 in September from 53.7 in August
The total holding of mortgage-backed securities on Federal Reserve�s balance sheet is now even smaller than before QE-Infinity was announced. Similarly, the total size of Federal Reserve balance sheet (as per factors affecting reserve balances account) is also no greater than before the announcement of QE-Infinity.
Fed�s QE-Infinity, announced about 3 weeks ago, is meant for the Fed to purchase US$40 billion of mortgage-backed securities per month.
With a gain of 114,000 jobs in September and an upward revision for August, this economy remains on a slow but not slowing growth path. The labor force participation rate, which reflects those working as well as looking for work, edged higher to 63.6 percent but remained around 30-year lows. The total labor force grew by 418,000, possibly accounting for the relatively modest net level of job growth.
The report presented a slew of contradictory data points, with the total employment level soaring despite the low net number.
The falling jobless rate had been a function as much of the continued shrinking in the labor force as it was an increase in new positions.
The yield on the 10-year U.S. Treasury note climbed to 1.73 percent from 1.68 percent just before the report, a sign that investors were more willing to embrace risk and moving money from bonds into stocks.
|
|
| |
|
|
|
|
|
|
|
|
|
|
|
|
|
|
|
|
|
|
|
|
|
|
|
|
|
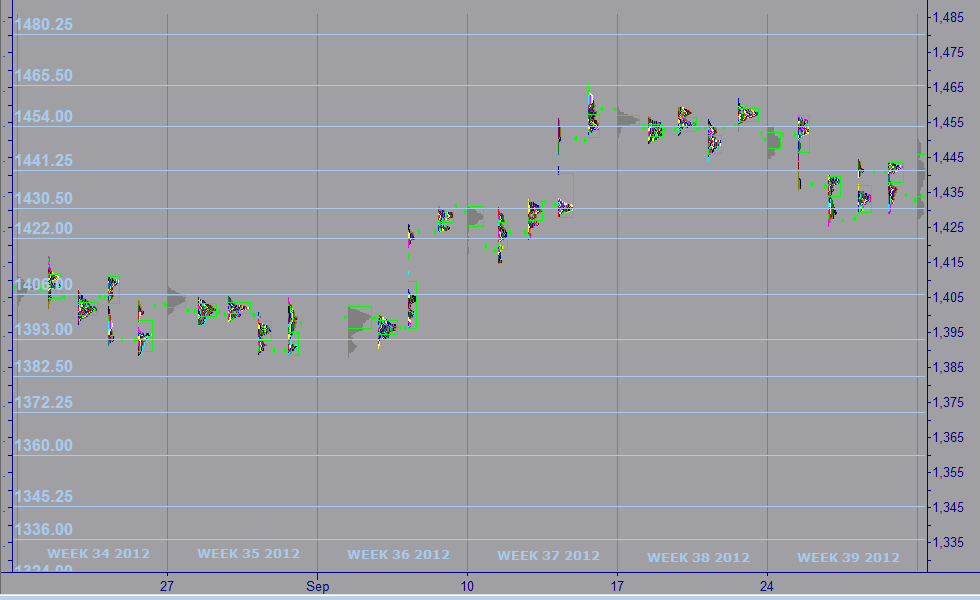
| MARKET PROFILE |
 |
WEEKS 2012 |
WEEK 40 |
% FROM CLOSE |
% FROM OPEN |
 |
RESISTANCE 1 |
1,330.25 |
1.39% |
1.35% |
|
RESISTANCE 2 |
1,326.25 |
1.08% |
1.04% |
 |
CLOSE MAR 02 |
1,350.00 |
|
|
|
OPEN MAR 04 |
1,255.00 |
0.04% |
|
 |
SUPPORT 1 |
1,289.00 |
0.66% |
0.62% |
|
SUPPORT 2 |
1,283.50 |
0.08% |
0.04% |
|
|
|
|
|
|
|
|
|
| |
|
|
|
|
|
| |
|
|
|
|
|
|
IMPORTANT NOTE: In an effort to comply with all applicable rules, regulations and disclosures please be so kind and read the "General Disclosure" below: |
| |
|
|
|
|
| GENERAL DISCLOSURE - TRADINGVESTING.COM |
- The material contained on our Website and Economic Calendar must be used at your own risk. Material is believed to be reliable, but we do not guarantee its accuracy or validity, nor is Tradingvesting.com responsible for any errors or omissions which may occur. The analysis and/or recommendations made by Tradingvesting.com do not provide, imply, or otherwise constitute a guarantee of performance. All contents and recommendations are based on data and sources believed to be reliable, but accuracy and completeness cannot be guaranteed. It should not be assumed that future results will be profitable or will equal past performance, real, indicated or implied.Tradingvesting.com website and material contained therein is not a solicitation to participate in the Futures/Stocks/Options Market. This Economic Calendar does not include Earning Releases, Announced Stock Splits, Upcoming Initial Public Offerings with Underwritings or Rating Changes. Tradingvesting.com has attempted to verify the information contained in this calendar. However, any aspect of such info may change without notice. Unless indicated otherwise: economic data is from the U.S and intraday data is at least 20 minutes delayed; all prices are in the local currency; Time is U.S. Eastern Time. Furthermore, there is a very high degree of risk involved in trading.Tradingvesting.com assumes no responsibilities for your trading and investment results, please red our Risk Disclosure.
- Tradingvesting.com does not provide investment advice, and does not represent that any of the information or related analysis is accurate or complete at any time. All information on this website are for educational purposes only and are not intended to provide financial advice. Any statements about profits or income, expressed or implied, do not represent a guarantee. Your actual trading may result in losses as no trading system is guaranteed. You accept full responsibilities for your actions, trades, profit or loss, and agree to hold Tradingvesting.com and any authorized distributors of this information harmless in any and all ways. We respect your right to privacy, please click here to view our privacy policy.
- U.S. Government Required Disclaimer - Commodity Futures Trading Commission.
Futures and options trading has large potential rewards, but also large potential risk. You must be aware of the risks and be willing to accept them in order to invest in the futures and options markets. Don't trade with money you can't afford to lose. This website is neither a solicitation nor an offer to Buy/Sell futures or options. No representation is being made that any account will or is likely to achieve profits or losses similar to those discussed on this website. The past performance of any trading system or methodology is not necessarily indicative of future results.
- CFTC rule 4.41:Hypothetical or simulated performance results have certain limitations. Unlike an actual performance record, simulated results do not represent actual trading. Also, since the trades have not been executed, the results may have under-or-over compensated for the impact, if any, of certain market factors, such as lack of liquidity. Simulated trading programs in general are also subject to the fact that they are designed with the benefit of hindsight. No representation is being made that any account will or is likely to achieve profit or losses similar to those shown.
- Risk Warning: Trading foreign exchange on margin carries a high level of risk, and may not be suitable for all investors. The high degree of leverage can work against you as well as for you. Before deciding to invest in foreign exchange you should carefully consider your investment objectives, level of experience, and risk appetite. The possibility exists that you could sustain a loss of some or all of your initial investment and therefore you should not invest money that you cannot afford to lose. You should be aware of all the risks associated with foreign exchange trading, and seek advice from an independent financial advisor if you have any doubts. Our linking to these sites does not constitute an endorsement of any products, services or the information found on them. Once you link to another site you are subject to the policies of the new site. By using this site, you agree to the Terms of Service, Privacy Policy and Risk Disclosure. Copyright � 2012 Tradingvesting, LLC. All rights reserved. If you have any questions regarding the Online Economic Calendar application, please contact us: click here.
THIS BRIEF STATEMENT CANNOT, OF COURSE, DISCLOSE ALL THE RISKS AND OTHER ASPECTS OF THE COMMODITY MARKETS AND EQUITY MARKETS. PLEASE READ MORE AT: TERMS OF SERVICE.
|
|
|
| |
|
|
|
|
|
| |
|
|
|
|
|