 |
 |
|
|
|
Week 15 -2012 | From Apr 09 to Apr 13, 2012 |
|
 |
|
|
|
|
|
|
| |
|
|
|
|
|
|
|
|
|
|
| |
Economic Data for Week 15-2012 | Global View | Week Rating
| DATE |
DAY |
REPORT/CATEGORY |
HIGHLIGHTS ON WEEK 15-2012 |
Last |
|
Mon |
Non Reports for Our Global Vision |
There will be no Economic Reports released on Monday 9, april 2012. |
N/A |
|
|
No Reports |
|
|
|
Tue |
ICSC Goldman Sachs Index |
The ICSC Index rose 0.5% in the week ended Saturday from the week before as retailers benefited from the leadup to the Easter holiday.
|
0.5% W/W |
|
 |
Sales and Inventories |
ICSC expects industry sales will increase 3% to 4% for the month of April. On a year-on-year basis, the reading rose 4.5%.
|
|
|
Tue |
Johnson Redbook |
Redbook's year-on-year same-store sales rate came in at plus 4.1% in the April 7 week vs an outsized rate of plus 4.6% in the prior week. |
4.1% Y/Y |
|
|
Sales and Inventories |
This year's early Easter gave a boost to retail sales in late March and early April. Aside from the prior week, the latest week's rate is the highest so far this year. |
|
|
Tue |
Wholesale Trade |
The rate of inventory build at the wholesale level, plus 0.9% in February, is high but so is the sales rate, at plus 1.2% . |
0.9% |
|
|
Sales and Inventories |
Given that inventory levels are a bit larger than sales levels, the mix of monthly rates keeps the stock-to-sales ratio unchanged for a third straight month at 1.17. |
|
|
Wed |
MBA purchase Applications |
The Mortgage Bankers Association said its seasonally adjusted index of mortgage application activity, which includes both refinancing and home purchase demand, fell 2.4% in the week ended April 6. |
-2.4% W/W |
|
|
Real Estate |
The MBA's seasonally adjusted index of refinancing applications slid 3.1%. The gauge of loan requests for home purchases fared better, edging down only 0.5%. |
|
|
Wed |
Import and Export Prices |
U.S. import prices rose in March by the most in nearly a year on sharply higher petroleum costs, but prices outside food and energy climbed more modestly. |
3.4%
Y/Y |
|
|
Inflation |
Overall import prices rose 1.3% , the Labor Department said on Wednesday. That was the biggest gain since April 2011. export prices rose 0.8% last month, increased 0.4% in February. |
|
|
Wed |
EIA Crude Oil Report |
Oil prices fell to near $103 a barrel Friday in Asia after economic growth slowed in China, the world's second-largest crude consumer. |
56.0 |
|
|
Commodity |
Higher costs for energy have fueled inflation in recent months but a still-weak jobs market has made it harder for businesses to raise other prices. |
|
|
Wed |
Treasury Budget |
The U.S. government ran a budget deficit of $198 billion in March. The March figure pushed the deficit up to $779 billion for the first six months of fiscal 2012. |
$-198.2 Billions |
|
|
Government |
The deficit for the first half of fiscal 2012 is lower than the one recorded in the same period in 2011, but the government remains on track to post another deficit of more than $1 trillion for the entire 2012 fiscal year. |
|
|
Wed |
Beige Book 3 |
The Federal Reserve's Beige Book, released on Wednesday, showed that all 12 Fed districts reported economic progress ranging from "steady" to "strong"; Yet volatility remains high. |
N/A |
|
|
Interest Rates |
Business conditions have improved in the Fifth District economy. Manufacturing activity continued to advance, although somewhat more slowly than at the beginning of the year. While trade activity increased, imports improved somewhat more slowly than exports. |
|
|
Thu |
Jobless/Initial Claims |
Jobless claims rose by 13,000 last week to 380,000, the highest since late January. The four-week average climbed by 4,250 to 368,500, the highest in a month. |
380,000 |
|
|
Employment |
These results do not point to improvement in the jobs market. Weekly jobless claims are no longer the best news on the economic calendar. |
|
|
Thu |
U.S. Trade Balance |
February exports of $181.2 billion and imports of $227.2billion resulted in a goods and services deficit of $46.0 billion, down from $52.5 billion in January, revised. |
$-46.0 Billions |
|
|
Balance of Payments |
The U.S. trade deficit shrank 12.4% to $46 billion in February, the biggest month-to-month decline since May 2009. |
|
|
Thu |
Producer Price Index |
U.S. producer prices were unchanged last month after advancing 0.4% in February. Economists polled had expected prices at farms, factories and refineries to rise 0.3%. |
0.0% |
|
|
Inflation |
Wholesale prices excluding volatile food and energy costs, core PPI, rose 0.3% after February's 0.2% gain. PPI inflation in March was unexpectedly soft at the headline level. |
|
|
Thu |
EIA Natural Gas Report |
Working natural gas in storage as of March 30 totaled 2,479, which is 816 billion cubic feet (Bcf) greater than the 5-year (2007-2011) maximum for that date. |
8 bcf |
|
|
Commodity |
Inventories for each week ending in March have been greater than 2,300 Bcf; the next highest March inventory level of any year for the 18 years for which EIA has data is 1,887 Bcf. |
|
|
|
China GDP |
February exports of $181.2 billion and imports of $227.2billion resulted in a goods and services deficit of $46.0 billion, down from $52.5 billion in January, revised. |
$-46.0 Billions |
|
|
|
February exports were $0.2 billion more than January exports of $180.9 billion.February imports were $6.3 billion less than January imports of $233.4 billion. |
|
|
Thu |
Fed Balance Sheet |
The Fed's balance sheet - a broad gauge of its lending to the financial system - stood at $2.85 trillion on April 11, up from $2.848 trillion on April 4. |
$1.7B |
|
|
Government |
The U.S. Balance Sheet: Households See Net Worth Down by $12 Trillion Since Peak and Total Debt Floating in the Market of $33 Trillion. |
|
|
Thu |
M2 Money Supply |
|
$ 21.9B |
|
|
Money Supply |
|
|
|
Fri |
Fixed Mortgage Rates |
30-year fixed-rate mortgage (FRM) averaged 3.90% with an average 0.7 point for the week ending April 5, 2012, down from last week when it averaged 3.99%. |
3.90% |
|
|
Interest Rates |
15-year FRM this week averaged 3.31% with an average 0.7 point, down from last week when it averaged 3.21%. A year ago at this time, the 15-year FRM averaged 4.10%. |
|
|
Fri |
Consumer Price Index |
U.S. consumer prices rose 0.3% in March as the cost of most goods increased. So-called core prices rose a seasonally adjusted 0.2%. CPI inflation eased slightly in March but remained on the warm side due to higher energy. |
0.2% |
|
|
Inflation |
While higher stock prices and employment gains have cheered consumers this year, gas prices are up and conditions in Europe remain a concern. |
|
|
Fri |
Consumer Sentiment |
The preliminary reading for consumer sentiment in April declined to 75.7 from a final March level of 76.2. Economists watch sentiment data to get a feel for the direction of consumer spending |
75.7 |
|
|
Consumer |
The sentiment gauge, which covers how consumers view their personal finances as well as business and buying conditions, averaged about 87 in the year before the most recent recession. |
|
|
|
|
|
|
|
|
|
|
|
|
|
|
|
|
|
|
|
|
|
|
|
|
|
|
| |
|
|
|
|
|
| |
|
|
|
|
|
| |
|
|
|
|
|
|
|
|
|
|
| |
|
| WEEK 15-2012 ENDING APR. 13 |
Reports Commentary
Factory orders fell in January in the typical pattern of declines in the first month of the quarter. Nevertheless, new orders have been on a rising trend since March 2009 although they remain below their pre-recession peak..
|
|
| |
|
|
|
|
|
|
|
|
|
|
|
|
|
|
|
|
| |
|
|
|
|
|
|
|
|
|
|
|
|
|
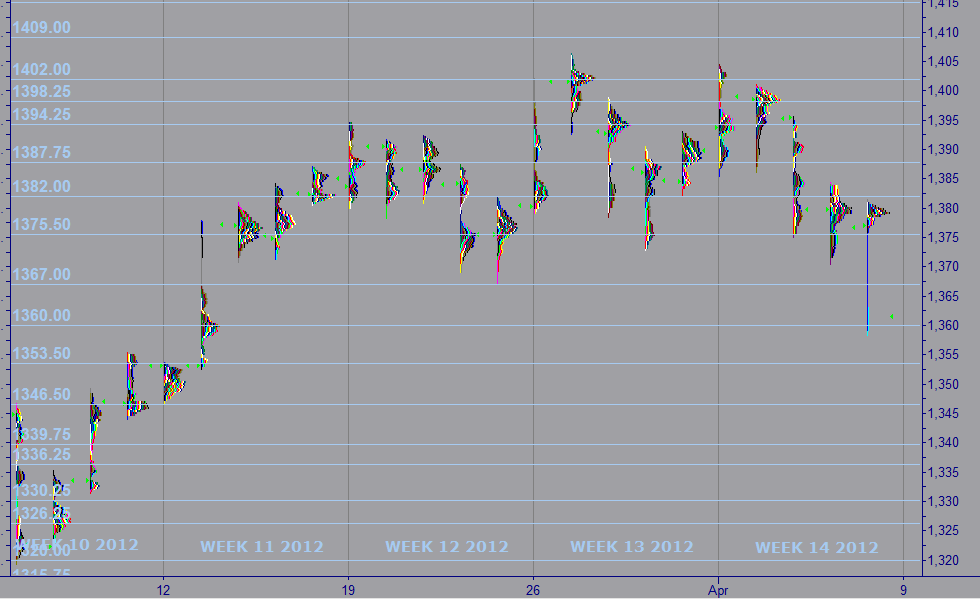
| MARKET PROFILE |
 |
WEEKS 2012 |
WEEK 15 |
% FROM CLOSE |
% FROM OPEN |
 |
RESISTANCE 1 |
1,375.50 |
1.07% |
1.15% |
|
RESISTANCE 2 |
1,367.00 |
0.44% |
0.48% |
 |
CLOSE APR 06 |
1,361.00 |
|
|
|
OPEN APR 08 |
1,361.00 |
0.00% |
|
 |
SUPPORT 1 |
1,346.50 |
-1.07% |
-1.15% |
|
SUPPORT 2 |
1,339.75 |
-1.56% |
-1.69% |
|
|
|
|
|
|
|
|
|
| |
|
|
|
|
|
| |
|
|
|
|
|
|
IMPORTANT NOTE: In an effort to comply with all applicable rules, regulations and disclosures please be so kind and read the "General Disclosure" below: |
| |
|
|
|
|
| GENERAL DISCLOSURE - TRADINGVESTING.COM |
- The material contained on our Website and Economic Calendar must be used at your own risk. Material is believed to be reliable, but we do not guarantee its accuracy or validity, nor is Tradingvesting.com responsible for any errors or omissions which may occur. The analysis and/or recommendations made by Tradingvesting.com do not provide, imply, or otherwise constitute a guarantee of performance. All contents and recommendations are based on data and sources believed to be reliable, but accuracy and completeness cannot be guaranteed. It should not be assumed that future results will be profitable or will equal past performance, real, indicated or implied.Tradingvesting.com website and material contained therein is not a solicitation to participate in the Futures/Stocks/Options Market. This Economic Calendar does not include Earning Releases, Announced Stock Splits, Upcoming Initial Public Offerings with Underwritings or Rating Changes. Tradingvesting.com has attempted to verify the information contained in this calendar. However, any aspect of such info may change without notice. Unless indicated otherwise: economic data is from the U.S and intraday data is at least 20 minutes delayed; all prices are in the local currency; Time is U.S. Eastern Time. Furthermore, there is a very high degree of risk involved in trading.Tradingvesting.com assumes no responsibilities for your trading and investment results, please red our Risk Disclosure.
- Tradingvesting.com does not provide investment advice, and does not represent that any of the information or related analysis is accurate or complete at any time. All information on this website are for educational purposes only and are not intended to provide financial advice. Any statements about profits or income, expressed or implied, do not represent a guarantee. Your actual trading may result in losses as no trading system is guaranteed. You accept full responsibilities for your actions, trades, profit or loss, and agree to hold Tradingvesting.com and any authorized distributors of this information harmless in any and all ways. We respect your right to privacy, please click here to view our privacy policy.
- U.S. Government Required Disclaimer - Commodity Futures Trading Commission.
Futures and options trading has large potential rewards, but also large potential risk. You must be aware of the risks and be willing to accept them in order to invest in the futures and options markets. Don't trade with money you can't afford to lose. This website is neither a solicitation nor an offer to Buy/Sell futures or options. No representation is being made that any account will or is likely to achieve profits or losses similar to those discussed on this website. The past performance of any trading system or methodology is not necessarily indicative of future results.
- CFTC rule 4.41:Hypothetical or simulated performance results have certain limitations. Unlike an actual performance record, simulated results do not represent actual trading. Also, since the trades have not been executed, the results may have under-or-over compensated for the impact, if any, of certain market factors, such as lack of liquidity. Simulated trading programs in general are also subject to the fact that they are designed with the benefit of hindsight. No representation is being made that any account will or is likely to achieve profit or losses similar to those shown.
- Risk Warning: Trading foreign exchange on margin carries a high level of risk, and may not be suitable for all investors. The high degree of leverage can work against you as well as for you. Before deciding to invest in foreign exchange you should carefully consider your investment objectives, level of experience, and risk appetite. The possibility exists that you could sustain a loss of some or all of your initial investment and therefore you should not invest money that you cannot afford to lose. You should be aware of all the risks associated with foreign exchange trading, and seek advice from an independent financial advisor if you have any doubts. Our linking to these sites does not constitute an endorsement of any products, services or the information found on them. Once you link to another site you are subject to the policies of the new site. By using this site, you agree to the Terms of Service, Privacy Policy and Risk Disclosure. Copyright � 2012 Tradingvesting, LLC. All rights reserved. If you have any questions regarding the Online Economic Calendar application, please contact us: click here.
THIS BRIEF STATEMENT CANNOT, OF COURSE, DISCLOSE ALL THE RISKS AND OTHER ASPECTS OF THE COMMODITY MARKETS AND EQUITY MARKETS. PLEASE READ MORE AT: TERMS OF SERVICE.
|
|
|
| |
|
|
|
|
|
| |
|
|
|
|
|