|
 |
|
|
|
Week 19 -2012 | From May 07 to May 11, 2012 |
|
 |
|
|
|
|
|
|
| |
|
|
|
|
|
|
|
|
|
|
| |
Economic Data for Week 19-2012 | Global View | Week Rating
| DATE |
DAY |
REPORT/CATEGORY |
HIGHLIGHTS ON WEEK 19-2012 |
LAST |
|
Mon |
Consumer Credit |
Consumers over the last half year are borrowing more but not so much for consumer goods. Consumer credit outstanding jumped $21.4 billion to $2.54 trillion in March. |
$21.4B |
|
 |
Consumer |
The gain is being led, not by revolving credit (which isn't good news for chain stores), but by non-revolving credit where the gain is concentrated in student loans. But revolving credit did rise, up $5.2 billion in the month following two prior months of declines. |
|
|
Tue |
ICSC Goldman Sachs Index |
The International Council of Shopping Centers and Goldman Sachs Retail Chain Store Sales Index slid 0.8% in the week ended Saturday from the week before. |
-0.8% W/W |
|
|
Sales and Inventories |
The fiscal month of May got off to soft start as consumers were focused on non-retail activities this past week. On a year-on-year basis, the reading rose 3.3%. |
|
|
Tue |
Johnson Redbook |
|
N/A |
|
|
Sales and Inventories |
|
|
|
Wed |
MBA purchase Applications |
|
N/A |
|
|
Real Estate |
|
|
|
Wed |
Wholesale Trade |
Inventories at the wholesale level are rising incrementally and in line with sales at the wholesale level. Inventories rose 0.3 percent in March with sales up 0.5 percent. |
0.3% |
|
|
Sales and Inventories |
The total picture for first-quarter inventories, which also includes inventories in the factory and retail sectors, is nearly complete and keeps the sector's stock-to-sales ratio unchanged for a fourth month in a row at a lean and healthy 1.17. |
|
|
Wed |
EIA Crude Oil Report |
|
N/A |
|
|
Commodity |
|
|
|
Thu |
Jobless/Initial Claims |
Initial claims edged lower to 367,000 following the prior week's slightly revised 368,000. These mark a return to the 360,000 levels in March and hopefully will make April's 390,000 levels a bad memory. |
367,000 |
|
|
Employment |
The four-week average illustrates the improvement, down for the first time in five weeks to show a sizable 5,250 decrease to 379,000. |
|
|
Thu |
U.S. Trade Balance |
The trade balance worsened in the latest numbers but the details are encouraging as both exports and non-petroleum imports gained. In March, the U.S. trade gap expanded to $51.8 billion from $45.4 billion in February. That was originally $46.0 billion. |
$-51.8B |
|
|
Balance of Payments |
Analysts forecast a deficit of $49.5 billion. Exports rose 2.9 percent after a 0.3 percent increase in February. Imports rebounded a sharp 5.2 percent, following a 2.8 percent drop the month before. |
|
|
Thu |
Import and Export Prices |
There's no sign of inflation in the Y/Y readings. . The price of imported crude fell 3.2%. Import prices show no pressure, unchanged in the month following muted readings through the first quarter. |
0.5%
Y/Y
|
|
|
Inflation |
The export side of the report also shows a jump for autos, at plus 0.5%. Excluding agricultural prices, the export price reading is unchanged in April. |
|
|
Thu |
ISM Non-Mfg Index |
|
N/A |
|
|
Sales and Inventories |
|
|
|
Thu |
EIA Natural Gas Report |
|
N/A |
|
|
Commodity |
|
|
|
Thu |
Treasury Budget |
The U.S. Treasury monthly budget report showed a surplus of $59.1 billion in April, marking the first monthly surplus in more than 3-1/2 years. |
$59.1B |
|
|
Government |
The government's year-to-date deficit stands at half way through the government's fiscal year, down to $719.9 billion which was sizably below the year-ago period deficit of $869.8 billion. |
|
|
Thu |
Fed Balance Sheet |
|
N/A |
|
|
Government |
|
|
|
Thu |
M2 Money Supply |
|
N/A |
|
|
Money Supply |
|
|
|
Fri |
Fixed Mortgage Rates |
The 30-year, the most popular mortgage product, fell by 0.01 percentage points to 3.83%. Last year at this time, it stood at 4.63%. The new lows can save borrowers $46 a month for every $100,000 borrowed. Over a 30-year term that comes to more than $16,000. |
3.83%
APR
|
|
|
Interest Rates |
The 15-year fixed dropped by 0.02 percentage points to 3.03%, lowering borrowing costs to $692 a month for every $100,000 borrowed, a $38 savings compared with a year earlier. Borrowers would pay out only $24,565 in interest over the life of the loan. |
|
|
Fri |
Producer Price Index |
Weaker energy cost pulled down the headline PPI in the latest report. Today's numbers are seen by some as giving the Fed more room for additional monetary easing. |
-0.2% M/M |
|
|
Inflation |
The PPI in April fell 0.2% after a flat reading in March. Market expectations were for no change for April's headline number. |
|
|
Fri |
Consumer Sentiment |
Today's Consumer Sentiment point to ongoing acceleration for the economy. The index is up a solid 1.4 points at mid-month to a preliminary 77.8 vs April's 76.4. |
77.8 |
|
|
Consumer |
Today's reading edges out February last year for the best reading so far of the recovery. Twice before, early 2010 and early last year, the index tested the 75 area and each time the index quickly fizzled. |
|
|
|
|
|
|
|
|
|
|
|
|
|
|
|
|
|
|
|
|
|
|
|
|
|
|
| |
|
|
|
|
|
| |
|
|
|
|
|
| |
|
|
|
|
|
|
|
|
|
|
| |
|
| WEEK 19-2012 ENDING MAY. 11 |
Reports Commentary
Factory orders fell in January in the typical pattern of declines in the first month of the quarter. Nevertheless, new orders have been on a rising trend since March 2009 although they remain below their pre-recession peak..
|
|
| |
|
|
|
|
|
|
|
|
|
|
|
|
|
|
|
|
| |
|
|
|
|
|
|
|
|
|
|
|
|
|
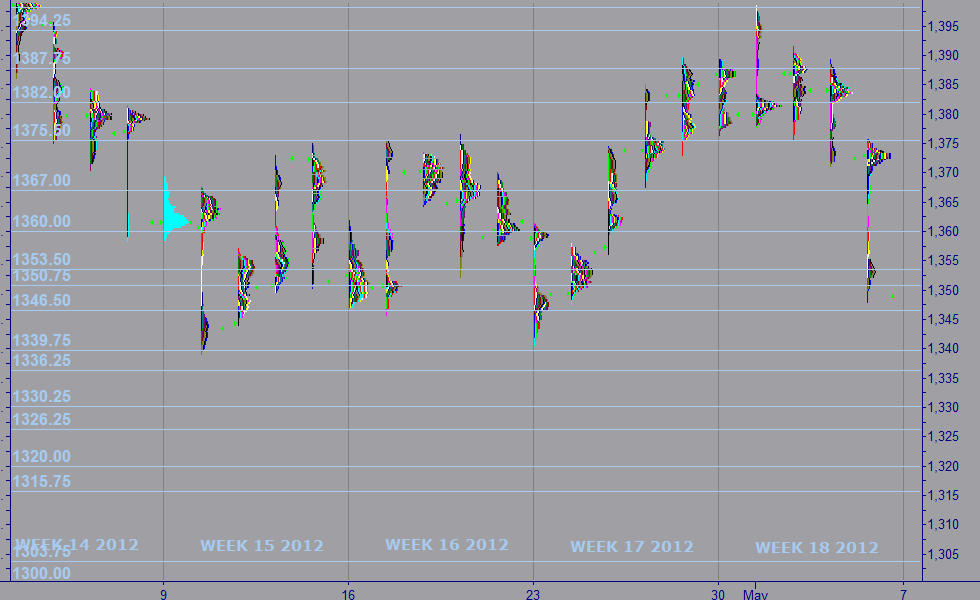
| MARKET PROFILE |
 |
WEEKS 2012 |
WEEK 19 |
% FROM CLOSE |
% FROM OPEN |
 |
RESISTANCE 1 |
1,375.50 |
1.93% |
2.85% |
|
RESISTANCE 2 |
1,367.00 |
1.30% |
2.17% |
 |
CLOSE MAY 04 |
1,349.50 |
|
|
|
OPEN MAY 06 |
1,339.75 |
-0.72% |
|
 |
SUPPORT 1 |
1,346.50 |
-0.22% |
0.54% |
|
SUPPORT 2 |
1,326.25 |
-1.72% |
-1.08% |
|
|
|
|
|
|
|
|
|
| |
|
|
|
|
|
| |
|
|
|
|
|
|
IMPORTANT NOTE: In an effort to comply with all applicable rules, regulations and disclosures please be so kind and read the "General Disclosure" below: |
| |
|
|
|
|
| GENERAL DISCLOSURE - TRADINGVESTING.COM |
- The material contained on our Website and Economic Calendar must be used at your own risk. Material is believed to be reliable, but we do not guarantee its accuracy or validity, nor is Tradingvesting.com responsible for any errors or omissions which may occur. The analysis and/or recommendations made by Tradingvesting.com do not provide, imply, or otherwise constitute a guarantee of performance. All contents and recommendations are based on data and sources believed to be reliable, but accuracy and completeness cannot be guaranteed. It should not be assumed that future results will be profitable or will equal past performance, real, indicated or implied.Tradingvesting.com website and material contained therein is not a solicitation to participate in the Futures/Stocks/Options Market. This Economic Calendar does not include Earning Releases, Announced Stock Splits, Upcoming Initial Public Offerings with Underwritings or Rating Changes. Tradingvesting.com has attempted to verify the information contained in this calendar. However, any aspect of such info may change without notice. Unless indicated otherwise: economic data is from the U.S and intraday data is at least 20 minutes delayed; all prices are in the local currency; Time is U.S. Eastern Time. Furthermore, there is a very high degree of risk involved in trading.Tradingvesting.com assumes no responsibilities for your trading and investment results, please red our Risk Disclosure.
- Tradingvesting.com does not provide investment advice, and does not represent that any of the information or related analysis is accurate or complete at any time. All information on this website are for educational purposes only and are not intended to provide financial advice. Any statements about profits or income, expressed or implied, do not represent a guarantee. Your actual trading may result in losses as no trading system is guaranteed. You accept full responsibilities for your actions, trades, profit or loss, and agree to hold Tradingvesting.com and any authorized distributors of this information harmless in any and all ways. We respect your right to privacy, please click here to view our privacy policy.
- U.S. Government Required Disclaimer - Commodity Futures Trading Commission.
Futures and options trading has large potential rewards, but also large potential risk. You must be aware of the risks and be willing to accept them in order to invest in the futures and options markets. Don't trade with money you can't afford to lose. This website is neither a solicitation nor an offer to Buy/Sell futures or options. No representation is being made that any account will or is likely to achieve profits or losses similar to those discussed on this website. The past performance of any trading system or methodology is not necessarily indicative of future results.
- CFTC rule 4.41:Hypothetical or simulated performance results have certain limitations. Unlike an actual performance record, simulated results do not represent actual trading. Also, since the trades have not been executed, the results may have under-or-over compensated for the impact, if any, of certain market factors, such as lack of liquidity. Simulated trading programs in general are also subject to the fact that they are designed with the benefit of hindsight. No representation is being made that any account will or is likely to achieve profit or losses similar to those shown.
- Risk Warning: Trading foreign exchange on margin carries a high level of risk, and may not be suitable for all investors. The high degree of leverage can work against you as well as for you. Before deciding to invest in foreign exchange you should carefully consider your investment objectives, level of experience, and risk appetite. The possibility exists that you could sustain a loss of some or all of your initial investment and therefore you should not invest money that you cannot afford to lose. You should be aware of all the risks associated with foreign exchange trading, and seek advice from an independent financial advisor if you have any doubts. Our linking to these sites does not constitute an endorsement of any products, services or the information found on them. Once you link to another site you are subject to the policies of the new site. By using this site, you agree to the Terms of Service, Privacy Policy and Risk Disclosure. Copyright � 2012 Tradingvesting, LLC. All rights reserved. If you have any questions regarding the Online Economic Calendar application, please contact us: click here.
THIS BRIEF STATEMENT CANNOT, OF COURSE, DISCLOSE ALL THE RISKS AND OTHER ASPECTS OF THE COMMODITY MARKETS AND EQUITY MARKETS. PLEASE READ MORE AT: TERMS OF SERVICE.
|
|
|
| |
|
|
|
|
|
| |
|
|
|
|
|