 |
 |
|
|
|
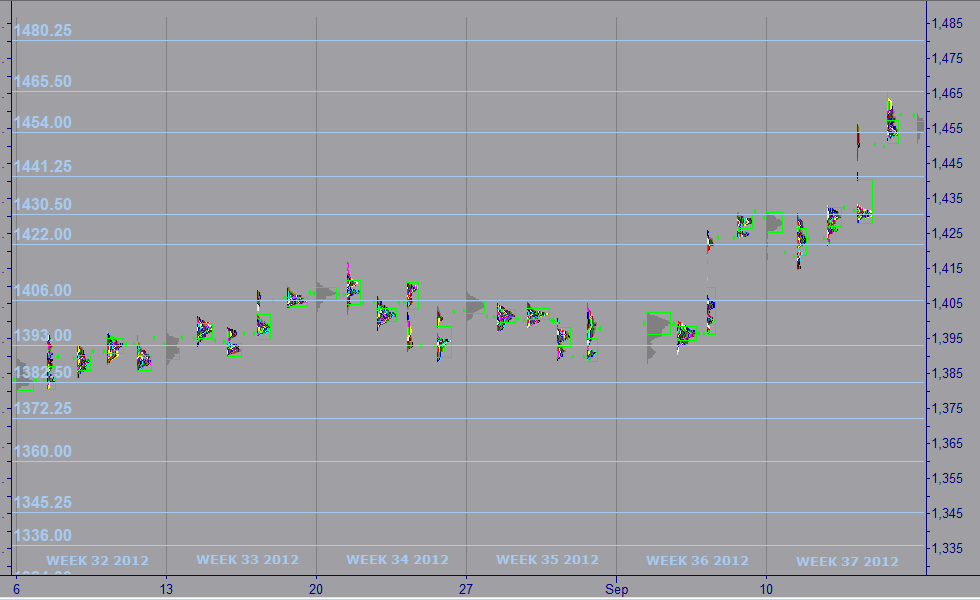
Week 38 -2012 | From Sep 17 to Sep 21, 2012 |
|
 |
|
|
|
|
|
|
| |
|
|
|
|
|
|
|
|
|
|
| |
Economic Data for Week 38-2012 | Global View | Week Rating
| DATE |
DAY |
REPORT/CATEGORY |
HIGHLIGHTS ON WEEK 38-2012 |
LAST |
|
Mon |
Empire Estate Mfg Index |
The New York Fed's Empire State general business conditions index dropped to -10.41, from -5.85 in August. It was the lowest level since April 2009. |
-10.41
Level
|
|
 |
Manufacturing |
Manufacturing activity in the New York region weakened again in September. The Manufacturing sector contracted in August for the first time in 10 months. |
|
|
Tue |
ICSC Goldman Sachs Index |
The ICSC-Goldman store sales index is now up 2.1% year over year, down from 3.4% Y/Y last week. This is a negative signal for the Retail Sector. |
-2.5%
W/W
|
|
|
Sales and Inventories |
The ICSC-Goldman's same-store sales index during the September 15 week fell a sharp 2.5% due to weather conditions. |
|
|
Tue |
Current Account |
The deficit on the current account narrowed to $117.4 billion in Q2-2012 from $133.6 Q1-2012 revised. Most of the narrowing came from a drop in the U.S. deficit on goods and an increase in the surplus on income, in other words, the decline in U.S. Imports helps cut Current Account Deficit. |
$-117.4
Billions
|
|
|
Balance of Payments |
The U.S. current account deficit shrank more than expected in Q2-2012 as the U.S. imported fewer goods while income earned on U.S. assets abroad increased. The current account as a percentage of GDP is 3.0%, the narrowest since Q3-2011, down 4/10 from Q1-2012 and down 1/10 from Q4-2011. |
|
|
Tue |
Johnson Redbook |
The Redbook declined from 2.7% Y/Y gains last week to 2.4% this week. U.S. Retail Sales Up 1.8% in 1st Three Weeks of September |
2.4%
Y/Y
|
|
|
Sales and Inventories |
Redbook said apparel sales in general didn't perform well as back-to-school categories were winding down. The shift hurt department stores, but discount stores' sales were supported by consumer basics, such as food and household supplies. |
|
|
Tue |
Treasury Intal Capital |
Foreign investment inflow picked back up in July, to $67.0 billion for the highest reading since January. In the key Treasury sector, overseas investors were net buyers of $50 billion in July, up from $32.5 billion in June. |
$67.0
Billions
|
|
|
Balance of Payments |
Taking into account purchases by U.S. residents and overseas investors, the net foreign purchases of long-term securities was $67.0 billion in July, up sharply from $9.3 billion in June. According to the data, China-based investors slightly increased their holdings of U.S. Treasurys in July. |
|
|
Tue |
Housing Market Index |
The National Association of Home Builders/Wells Fargo housing market index gained 3 points to a seasonally adjusted reading of 40, the highest the index has been since June 2006. |
40 |
|
|
Real Estate |
Optimism among the nation�s home builders climbed in September for the fifth straight month to reach the highest level in more than six years. |
|
|
Wed |
MBA purchase Applications |
The MBA said its seasonally adjusted index of mortgage application activity, which includes both refinancing and home purchase demand, edged down 0.2% in the week ended Sept 14, week 37. |
-0.2%
W/W
|
|
|
Real Estate |
The seasonally adjusted index of refinancing applications gained 0.8%. Applications for U.S. home mortgages dipped last week, though demand for refinancings rose as mortgage rates fell to a record low. |
|
|
Wed |
Housing Starts |
Housing starts increased 2.3% to a seasonally adjusted annual rate of 750,000 units. July's starts were revised to show a 733,000-unit pace instead of the previously reported 746,000. |
750K |
|
|
Real Estate |
Housing Starts Weaker Than Expected but Still Growing. Housing starts are now a third of their 2.27 million-unit peak in January 2006. |
|
|
Wed |
Building Permits |
Building permits slipped 1.0% to a 803,000-unit pace in August after surging the prior month to the highest in four years. July's permits were unrevised at 811,000 units. |
803K |
|
|
Real Estate |
Economists had expected permits to fall to a 796,000-unit pace. Permits to build single-family homes rose 0.2% last month to a 512,000-unit pace. Permits for multi-family homes fell 3.0% to a 291,000-unit rate. |
|
|
Wed |
Existing Home Sales Index |
The NAR said sales rose 7.8% to a seasonally adjusted annual rate of 4.82 million. That's the most since May 2010, when sales were fueled by a federal home-buying tax credit. |
4.82M |
|
|
Real Estate |
US Existing Home Sales Jump to 2-Year High. Sales of existing homes surged 7.8% in August to the best level in more than a year as low interest rates and a slowly improving jobs market help fuel a rebound in activity.� |
|
|
Wed |
EIA Crude Oil Report |
Crude oil futures skidded to a six-week low on Wednesday after a weekly report showed a sharp rise in US supplies.�Oil prices are now at their lowest level since August 3rd 2012.� |
8.5M
Barrels
|
|
|
Commodity |
The EIA said US crude oil stockpiles rose by 8.5m barrels last week, significantly more than the 500,000 barrels analysts had predicted. Some of that increase was due to imports, which were up by 1.3m barrels a day in the week ended September 14th to nearly 10m barrels a day. |
|
|
|
|
Wed 10pm: The flash HSBC China manufacturing purchasing managers' index (PMI) edged up to 47.8, from 47.6 in August, a nine-month low, suggesting that manufacturing activity in the world�s second-biggest economy may be picking up. China’s manufacturing activity contracted in September for the 11th straight month, though at a slightly milder pace than in August, preliminary data showed Thursday, with one economist saying the result suggested some stabilization for the critical sector. |
N/A |
|
|
|
China’s manufacturing activity rose marginally in September, a survey by HSBC showed, raising hopes that a slowing Chinese economy is finally stabilizing, but economists say a turnaround may still be a long way off. HSBC’s “flash” Purchasing Mangers’ Index (PMI) printed at 47.8 on a 100-point scale, up slightly from its final reading of 47.6 the previous month, but still below July’s level. |
|
|
Thu |
Jobless/Initial Claims |
Applications for U.S. jobless benefits fell by 3,000 to a seasonally adjusted 382,000 in the week ended Sept. 15. In short, U.S. jobless claims little changed at 382,000 from last week revised 385K. |
382K |
|
|
Employment |
U.S. Weekly jobless claims fall slightly last week but come in at above-consensus 382,000. However, the jobless data was revised higher than originally reported which was actually 18,000 claims worse than the� (BLS) initially claimed. From 373,000 claims to 382,000 claims. |
|
|
Thu |
Philadelphia Fed Survey |
September Philly Fed index rises to -1.9 from -7. Business among manufacturers in the Philadelphia region improved modestly in September and Philly Fed report was better than expected but had a negative print, a -1.9, which is bearish. This was the fifth consecutive negative print. |
-1.9 |
|
|
Business Activity |
A Philly Fed index showed that factory activity in the U.S. mid-Atlantic region shrank for the fifth month in a row in September, though the rate of contraction continued to ease as new orders picked up. |
|
|
Thu |
Leading Indicators |
A measure of U.S. economic activity declined in August for the second time in three months, suggesting the economy remains weak. |
-0.1% |
|
|
Business Activity |
The Conference Board said its index of leading indicators, designed to forecast future economic activity, dipped 0.1% in August after rising 0.5% in July and dropping 0.5% in June. |
|
|
Thu |
EIA Natural Gas Report |
Working gas in storage was 3,496 Bcf as of Friday, September 14, 2012, according to EIA estimates. This represents a net increase of 67 Bcf from the previous week. |
67 bcf |
|
|
Commodity |
Working gas in storage was 3,496 Bcf as of Friday, September 14, 2012, according to EIA estimates. This represents a net increase of 67 Bcf from the previous week. |
|
|
Thu |
Fed Balance Sheet |
Natural Gas Inventories were 320 Bcf higher than last year at this time and 278 Bcf above the 5-year average of 3,218 Bcf. |
$-1.9
Billions
|
|
|
Government |
The Fed's asset holdings in the week ended Sept. 19 were $2.823 trillion, down from $2.825 trillion a week earlier. Total assets decreased $1.9 billion after advancing $1.2 billion the week before. |
|
|
Thu |
M2 Money Supply |
|
$34.6
Billlions
|
|
|
Money Supply |
|
|
|
Fri |
Fixed Mortgage Rates |
US Mortgage Rates hit fresh lows this week after the Federal Reserve started its bond-buying program. The mortgage giant said that 30-year fixed-rate mortgage (FRM) was 3.49% in the week ending Sep 20, down from last week's 3.55%. Last year at this time, the 30-year FRM was 4.09%. |
3.49%
APR
|
|
|
Interest Rates |
The 15-year FRM, a popular choice for those looking to refinance, declined to 2.77% from 2.85% in the previous week. A year ago at this time, the 15-year FRM averaged 3.29%. |
|
|
|
|
|
|
|
|
| |
|
|
|
|
|
|
|
|
|
|
|
|
| |
|
|
|
|
| |
|
|
|
|
|
| |
|
|
|
|
|
| |
|
|
|
|
| |
|
| WEEK 38-2012 ENDING SEP. 21 |
Reports Commentary
Foreign investors bought a net $60.2 billion of long-term U.S. securities in July, up sharply from the $5.5 billion purchased in the prior month.. This is the largest amount of purchases in a month since January.
Global demand for U.S. securities is still strong, with China remaining the largest foreign holder of U.S. debt, according to the Treasury Department's latest report on foreign holdings.
With choppy financial markets and volatility in Europe, which were both widespread in July, private investors abroad purchased more Treasuries than any other asset class in July
Store sales in the U.S. took a downturn this week, as back-to-school and seasonal sales have run their course. Poor weather compounded this by keeping many shoppers indoors.
U.S. housing starts rose less than expected in August as groundbreaking on multifamily home projects fell, but the trend continued to point to a turnaround in the housing market. Housing starts are 29% higher compared to one year ago.�
Construction on new U.S. homes rose 2.3% in August to an annual rate of 750,000, while permits fell slightly from a multi-year high. Still, the recovery is from a depressed level. Sales of previously occupied homes remain below the more than 5.5 million that economists consider consistent with a healthy market. And the number of first-time homebuyers, who are critical to a housing rebound, slipped to 31 % from 34 %.
China’s economy, which expanded 7.6 % in the third quarter, its slowest pace in three years. China’s official PMI in August dipped below 50 � a line that demarcates expansion from contraction � for the first time since November 2011. The government’s latest stimulus measures could help China’s economy grow an annual 7.9 % in the third quarter, according to a poll of economists by Reuters at the end of August.
Last week, the Fed announced plans to buy $40 billion per month of agency mortgage-backed securities on an open-ended basis in an effort to push down interest rates and stimulate the economy. Known as QE3, this will be the third time the Fed has pursued the stimulus measure known as quantitative easing.
Commodities: Crude tumbles below $92 after EIA report
|
|
| |
|
|
|
|
|
|
|
|
|
|
|
|
|
|
|
|
|
|
|
|
|
|
|
|
|
| MARKET PROFILE |
 |
WEEKS 2012 |
WEEK 38 |
% FROM CLOSE |
% FROM OPEN |
 |
RESISTANCE 1 |
1,330.25 |
1.39% |
1.35% |
|
RESISTANCE 2 |
1,326.25 |
1.08% |
1.04% |
 |
CLOSE MAR 02 |
1,350.00 |
|
|
|
OPEN MAR 04 |
1,255.00 |
0.04% |
|
 |
SUPPORT 1 |
1,289.00 |
0.66% |
0.62% |
|
SUPPORT 2 |
1,283.50 |
0.08% |
0.04% |
|
|
|
|
|
|
|
|
|
| |
|
|
|
|
|
| |
|
|
|
|
|
|
IMPORTANT NOTE: In an effort to comply with all applicable rules, regulations and disclosures please be so kind and read the "General Disclosure" below: |
| |
|
|
|
|
| GENERAL DISCLOSURE - TRADINGVESTING.COM |
- The material contained on our Website and Economic Calendar must be used at your own risk. Material is believed to be reliable, but we do not guarantee its accuracy or validity, nor is Tradingvesting.com responsible for any errors or omissions which may occur. The analysis and/or recommendations made by Tradingvesting.com do not provide, imply, or otherwise constitute a guarantee of performance. All contents and recommendations are based on data and sources believed to be reliable, but accuracy and completeness cannot be guaranteed. It should not be assumed that future results will be profitable or will equal past performance, real, indicated or implied.Tradingvesting.com website and material contained therein is not a solicitation to participate in the Futures/Stocks/Options Market. This Economic Calendar does not include Earning Releases, Announced Stock Splits, Upcoming Initial Public Offerings with Underwritings or Rating Changes. Tradingvesting.com has attempted to verify the information contained in this calendar. However, any aspect of such info may change without notice. Unless indicated otherwise: economic data is from the U.S and intraday data is at least 20 minutes delayed; all prices are in the local currency; Time is U.S. Eastern Time. Furthermore, there is a very high degree of risk involved in trading.Tradingvesting.com assumes no responsibilities for your trading and investment results, please red our Risk Disclosure.
- Tradingvesting.com does not provide investment advice, and does not represent that any of the information or related analysis is accurate or complete at any time. All information on this website are for educational purposes only and are not intended to provide financial advice. Any statements about profits or income, expressed or implied, do not represent a guarantee. Your actual trading may result in losses as no trading system is guaranteed. You accept full responsibilities for your actions, trades, profit or loss, and agree to hold Tradingvesting.com and any authorized distributors of this information harmless in any and all ways. We respect your right to privacy, please click here to view our privacy policy.
- U.S. Government Required Disclaimer - Commodity Futures Trading Commission.
Futures and options trading has large potential rewards, but also large potential risk. You must be aware of the risks and be willing to accept them in order to invest in the futures and options markets. Don't trade with money you can't afford to lose. This website is neither a solicitation nor an offer to Buy/Sell futures or options. No representation is being made that any account will or is likely to achieve profits or losses similar to those discussed on this website. The past performance of any trading system or methodology is not necessarily indicative of future results.
- CFTC rule 4.41:Hypothetical or simulated performance results have certain limitations. Unlike an actual performance record, simulated results do not represent actual trading. Also, since the trades have not been executed, the results may have under-or-over compensated for the impact, if any, of certain market factors, such as lack of liquidity. Simulated trading programs in general are also subject to the fact that they are designed with the benefit of hindsight. No representation is being made that any account will or is likely to achieve profit or losses similar to those shown.
- Risk Warning: Trading foreign exchange on margin carries a high level of risk, and may not be suitable for all investors. The high degree of leverage can work against you as well as for you. Before deciding to invest in foreign exchange you should carefully consider your investment objectives, level of experience, and risk appetite. The possibility exists that you could sustain a loss of some or all of your initial investment and therefore you should not invest money that you cannot afford to lose. You should be aware of all the risks associated with foreign exchange trading, and seek advice from an independent financial advisor if you have any doubts. Our linking to these sites does not constitute an endorsement of any products, services or the information found on them. Once you link to another site you are subject to the policies of the new site. By using this site, you agree to the Terms of Service, Privacy Policy and Risk Disclosure. Copyright � 2012 Tradingvesting, LLC. All rights reserved. If you have any questions regarding the Online Economic Calendar application, please contact us: click here.
THIS BRIEF STATEMENT CANNOT, OF COURSE, DISCLOSE ALL THE RISKS AND OTHER ASPECTS OF THE COMMODITY MARKETS AND EQUITY MARKETS. PLEASE READ MORE AT: TERMS OF SERVICE.
|
|
|
| |
|
|
|
|
|
| |
|
|
|
|
|