 |
 |
|
|
|
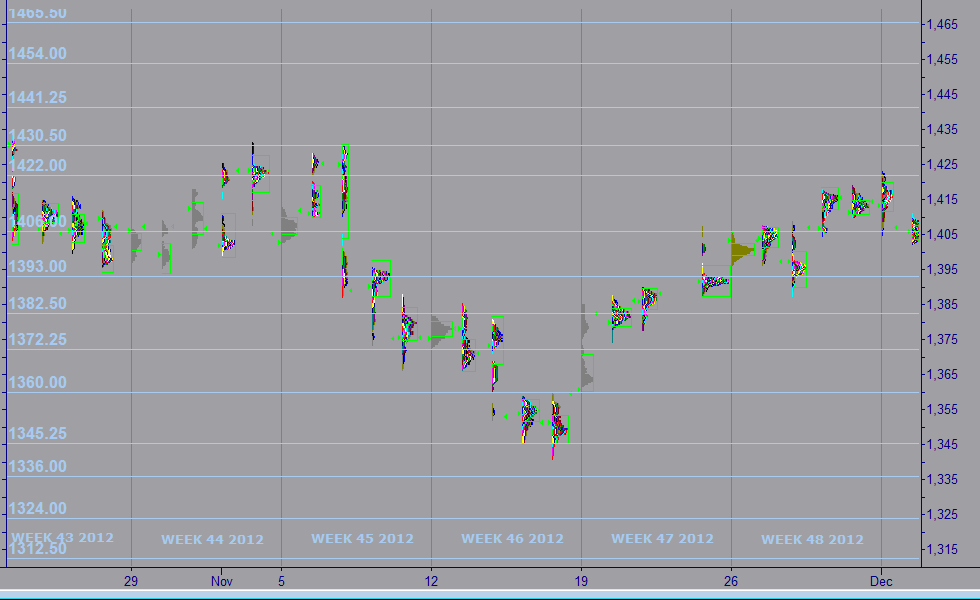
Week 49 -2012 | From Dec 03 to Dec 07, 2012 |
|
 |
|
|
|
|
|
|
| |
|
|
|
|
|
|
|
|
|
|
| |
Economic Data for Week 49-2012 | Global View | Week Rating
| DATE |
DAY |
REPORT/CATEGORY |
HIGHLIGHTS ON WEEK 49-2012 |
LAST |
|
Mon |
Motor Vehicle Sales |
Vehicle sales are very strong, surging a monthly 8.7% in November to a 15.5 million annual rate. Replacement demand tied to Hurricane Sandy boosted sales as did incentives during the month. |
N/A |
|
 |
Sales and Inventories |
The Big Three U.S. automakers, Ford, Chrysler and GM, reported a mixed bag of sales in September on Tuesday, with car sales revving up, but truck sales moving into lower gear. |
|
|
Mon |
PMI Manufacturing |
|
N/A |
|
|
Manufacturing |
|
|
|
Mon |
ISM Manufacturing Index |
U.S. manufacturers slow down in November to 49.5 level. ISM index of business conditions falls to lowest level since July 2009 into contraction territory. The decline in the overall ISM index largely reflected a steep drop in new orders, whose gauge fell 3.9 points to 50.3%. That’s the lowest level since August. |
49.5
Level
|
|
|
Manufacturing |
Are Business among manufacturers contracted in November and fell to the lowest level in more than three years, likely a sign the �fiscal cliff� is taking a bite out of the U.S. economy. |
|
|
Mon |
Construction Spending |
U.S.construction spending jumps 1.4% in October. Outlays for U.S. construction projects surged the Commerce Department reported. Spending on private homebuilding surged 3.0% in the month |
1.4% |
|
|
Growth |
Construction spending rose 1.4% in October, well above analysts' expectations of a 0.5% gain. In October, spending on private construction rose 1.6% while spending on public projects rose 0.8%. |
|
|
Tue |
ICSC Goldman Index |
Same store sales in the U.S. slowed this week following last week’s Black Friday surge. The�ICSC-Goldman�store sales index is now up 3.2% year over year, compared to 4.0% Y/Y a week ago. |
-3.1%
W/W
|
|
|
Sales and Inventories |
Chain-store sales slowed abruptly in the December 1 week compared to the surge of Black Friday week. ICSC-Goldman's same-store sales index fell 3.1% week-to-week and slowed to plus 3.2% from plus 4.0% year-on-year. |
|
|
Tue |
Johnson Redbook |
The�Redbook store sales index is now up�2.1% Y/Y, compared to 4.5% Y/Y last week. Chain store sales slowed sharply in the December 1 week, to a year-on-year same-store rate of plus 2.1% vs 4.5% in the Black Friday surge of the prior week. |
2.1%
Y/Y
|
|
|
Sales and Inventories |
Redbook says the slowing is a little more abrupt than retailers expected. But the report notes that sales are typically lumpy in the first part of December. It also notes that this year's earlier Hanukkah, which at December 8 falls 10 days earlier than last year, is likely to establish an early base of momentum for the month's sales. |
|
|
Wed |
MBA purchase Applications |
The Mortgage Bankers Associations today released their weekly mortgage survey results. Mortgage purchase applications rose 0.10% on a seasonally adjusted basis from the previous week. |
4.5%
W/W
|
|
|
Real Estate |
The MBA said its seasonally adjusted index of mortgage application activity, which includes both refinancing and home purchase demand, rose 4.5% in the week ended November 30. |
|
|
Wed |
ADP Employment Report |
Payroll processor Automatic Data Processing (ADP) and forecasting firm Moody's Analytics reported that employers added 118,000 new private-sector jobs last month compared to 157,000 jobs in October. Economists were expecting a gain of 125,000. |
118,000
Jobs
|
|
|
Employment |
ADP said Sandy’s wrath cost the U.S. 86,000 jobs, mostly in the manufacturing, retailing, leisure and hospitality, and temporary help industries. |
|
|
Wed |
Productivity and Costs |
The Bureau of Labor Statistics reports in its productivity and costs release that productivity rose while labor costs fell in the third quarter of 2012. |
49.5 |
|
|
Business Actvity |
Productivity increased at a seasonally adjusted annual rate of 2.9% in Q3. This compares to a 1.9% SAAR in Q2. Productivity is now up 1.7% from a year ago |
|
|
Wed |
Factory Orders |
Factory orders up 0.8% in October. �Factory orders rose 0.8% in October, much stronger than expected, the Commerce Department reported Wednesday. |
1.4% |
|
|
Manufacturing |
Orders for durable goods in October were revised higher to a 0.5% gain from the prior estimate that they were flat. New orders for nondurable goods increased 1.1%. Shipments and inventories both gained 0.4%. Orders for nondefense capital goods increased 1.8% in the month. |
|
|
Wed |
ISM Non-Mfg Index |
The Institute for Supply Management on Wednesday said its services index edged up to 54.7% last month from 54.2% in October. A number over 50 means more companies are expanding instead of shrinking. |
49.5 |
|
|
Business Actvity |
U.S. service sector accelerates in NovemberBusiness climbs to fastest level since late winter, but hiring softer. U.S. service companies such as insurers and health-care providers grew at a somewhat faster pace in November, marking the 35th straight month of expansion. |
|
|
Wed |
EIA Crude Oil Report |
U.S. shale production to push oil, gas output higher: EIA. The growth results largely from a significant increase in onshore crude oil production, particularly from shale and other tight formations, |
1.4% |
|
|
Commodity |
For crude oil specifically imports were forecast at 34% of U.S. liquid fuels consumption by 2019 from 45% in 2011. The agency said that U.S. crude oil production would hit a peak of 7.5 million barrels per day in 2019 before falling to 6.1 million bpd in 2040. |
|
|
Thu |
Jobless/Initial Claims |
Jobless Claims Fall as Sandy Storm Effects Fade. Initial claims for state unemployment benefits dropped 25,000 to a seasonally adjusted 370,000, the Labor Department said on Thursday. The prior week's figure was revised to show 2,000 more applications than previously reported. |
370,000 |
|
|
Employment |
The number of Americans filing new claims for unemployment benefits fell for a third straight week last week, but still remain too volatile to offer a clear signal on labor market conditions. |
|
|
Thu |
EIA Natural Gas Report |
U.S. oil and gas production over the next two decades will be higher than previously expected, the government said on Wednesday, underscoring the push toward greater energy self-sufficiency and more exports of natural gas. |
-76 bcf |
|
|
Commodity |
Natural gas in storage fell 73 billion cubic feet in the November 30 week to 3,804 bcf. A withdrawal of 66 bcf was expected. |
|
|
Thu |
Fed Balance Sheet |
The Fed’s asset holdings in the week ended 5 December increased to $2.861-T, up from $2.853-T a week earlier, it said in a weekly report released Thursday. |
-8.4B |
|
|
Government |
The US Federal Reserve’s balance sheet grew over the past week, as the central bank continued with its easy-money policy. |
|
|
Thu |
M2 Money Supply |
|
$-1.9B |
|
|
Money Supply |
|
|
|
Fri |
Fixed Mortgage Rates |
Average fixed mortgage rates in the U.S. edged up over the past week, though they remained near historic lows, a trend that has been supporting a slow recovery in the housing market, according to mortgage-finance company Freddie Mac (FMCC). |
3.91% |
|
|
Interest Rates |
For the week ended Thursday, the 30-year fixed-rate mortgage averaged 3.34%, compared with 3.32% the previous week and 3.99% a year earlier. Rates on 15-year fixed-rate mortgages averaged 2.67%, versus 2.64% a week earlier and 3.27% a year ago. |
|
|
Fri |
Employment Situation |
The U.S. economy added a solid 146,000 jobs in November and the unemployment rate fell to 7.7%, the lowest since December 2008. |
7.7% |
|
|
Employment |
The U.S. added 146,000 jobs in November and the unemployment rate fell to 7.7%, the lowest level since December 2008, the Labor Department said Friday. Hurricane Sandy appeared to have little effect on hiring and employment last month, the government said. |
|
|
Fri |
Consumer Sentiment |
Americans' outlook on the economy and their finances took a turn for the worse in early December, likely due to anxiety about the potential for higher taxes resulting from contentious discussions in Washington over fiscal issues, a survey released on Friday showed. |
7.7% |
|
|
Consumer |
The Thomson Reuters/University of Michigan's preliminary reading of its index of consumer sentiment plunged to 74.5 in early December, the lowest level since August. |
|
|
Fri |
Consumer Credit |
U.S. consumer credit rose more than expected in October, increasing for a third month in a hopeful sign for consumer spending. |
7.7% |
|
|
Consumer |
The Federal Reserve said on Friday consumer credit increased $14.2 billion in October after rising by an upwardly revised $12.2 billion in September. |
|
|
|
|
|
|
|
|
|
|
|
|
|
|
|
| |
|
|
|
|
|
|
|
|
|
|
|
|
|
|
|
| |
|
|
|
|
|
| |
|
|
|
|
|
| |
|
|
|
|
|
|
|
|
|
|
| |
|
| WEEK 49-2012 ENDING DEC. 07 |
Reports Commentary
The Institute for Supply Management’s index of purchasing managers dropped to 49.5% from 51.7% in October, the group said Monday. Purchasing managers are the executives who buy raw materials and other supplies for their companies, an activity that tracks closely with how fast the U.S. economy is growing. The fiscal cliff is the big worry right now. We will not look toward any type of expansion until this is addressed.
November US Manufacturing Data a Big Disappointment. The ISM number for November--traditionally the first read we get on the economy at the start of each month--was not good. The headline number, at 49.5, was the lowest since July 2009 and well below expectations. Below 50 is contraction; it has now contracted for the fourth time in six months.
The Census Bureau reports that new factory orders for all manufacturing industries rose 0.8% in October. This follows a 4.5% increase in September and a 5.1% decline in August.
In other news, AAPL was hammered. �It suffered its biggest one-day drop (7%) since September 2008, which was a staggering market cap loss of $35 billion! �Even the fiscal cliff-rumor couldn’t get AAPL off its low.
Last week's claims data has no bearing on Friday's employment report. Economists estimate the monster storm, which slammed into the densely populated East Coast, could subtract between 25,000 and 75,000 jobs from November's nonfarm payrolls.
Europe: The ECB downgraded its 2012 GDP forecast to a range of -0.6% to -0.4% from -0.6% to -0.2% previously, its 2013 GDP forecast to a range of -0.9% to 0.3% from -0.4% to 1.4% previously, and said its 2014 GDP forecast was for a range of 0.2% to 2.2% growth in the euro area.
The U.S. economy added 146,000 jobs in November and the unemployment rate fell to 7.7%, the lowest since December 2008. The government said Superstorm Sandy had only a minimal effect on the figures.
As money moved into stocks, it moved out of safer bonds. The yield on the benchmark 10-year U.S. Treasury note, which moves opposite the price, rose to 1.63% from 1.58% just before the report.
The increase suggests employers are not yet delaying hiring decisions because of the "fiscal cliff." That's the combination of sharp tax increases and spending cuts that are set to take effect next year without a budget deal.
The U.S. grew at a solid 2.7% annual rate in the July-September quarter. But many economists say growth is slowing to a 1.5% rate in the October-December quarter, largely because of the storm and threat of the fiscal cliff. That's not enough growth to lower the unemployment rate. |
|
| |
|
|
|
|
|
|
|
|
|
|
|
|
|
|
|
|
|
|
|
|
|
|
|
|
|
| MARKET PROFILE |
 |
WEEKS 2012 |
WEEK 31 |
% FROM CLOSE |
% FROM OPEN |
 |
RESISTANCE 1 |
1,330.25 |
1.39% |
1.35% |
|
RESISTANCE 2 |
1,326.25 |
1.08% |
1.04% |
 |
CLOSE MAR 02 |
1,350.00 |
|
|
|
OPEN MAR 04 |
1,255.00 |
0.04% |
|
 |
SUPPORT 1 |
1,289.00 |
0.66% |
0.62% |
|
SUPPORT 2 |
1,283.50 |
0.08% |
0.04% |
|
|
|
|
|
|
|
|
|
| |
|
|
|
|
|
| |
|
|
|
|
|
|
IMPORTANT NOTE: In an effort to comply with all applicable rules, regulations and disclosures please be so kind and read the "General Disclosure" below: |
| |
|
|
|
|
| GENERAL DISCLOSURE - TRADINGVESTING.COM |
- The material contained on our Website and Economic Calendar must be used at your own risk. Material is believed to be reliable, but we do not guarantee its accuracy or validity, nor is Tradingvesting.com responsible for any errors or omissions which may occur. The analysis and/or recommendations made by Tradingvesting.com do not provide, imply, or otherwise constitute a guarantee of performance. All contents and recommendations are based on data and sources believed to be reliable, but accuracy and completeness cannot be guaranteed. It should not be assumed that future results will be profitable or will equal past performance, real, indicated or implied.Tradingvesting.com website and material contained therein is not a solicitation to participate in the Futures/Stocks/Options Market. This Economic Calendar does not include Earning Releases, Announced Stock Splits, Upcoming Initial Public Offerings with Underwritings or Rating Changes. Tradingvesting.com has attempted to verify the information contained in this calendar. However, any aspect of such info may change without notice. Unless indicated otherwise: economic data is from the U.S and intraday data is at least 20 minutes delayed; all prices are in the local currency; Time is U.S. Eastern Time. Furthermore, there is a very high degree of risk involved in trading.Tradingvesting.com assumes no responsibilities for your trading and investment results, please red our Risk Disclosure.
- Tradingvesting.com does not provide investment advice, and does not represent that any of the information or related analysis is accurate or complete at any time. All information on this website are for educational purposes only and are not intended to provide financial advice. Any statements about profits or income, expressed or implied, do not represent a guarantee. Your actual trading may result in losses as no trading system is guaranteed. You accept full responsibilities for your actions, trades, profit or loss, and agree to hold Tradingvesting.com and any authorized distributors of this information harmless in any and all ways. We respect your right to privacy, please click here to view our privacy policy.
- U.S. Government Required Disclaimer - Commodity Futures Trading Commission.
Futures and options trading has large potential rewards, but also large potential risk. You must be aware of the risks and be willing to accept them in order to invest in the futures and options markets. Don't trade with money you can't afford to lose. This website is neither a solicitation nor an offer to Buy/Sell futures or options. No representation is being made that any account will or is likely to achieve profits or losses similar to those discussed on this website. The past performance of any trading system or methodology is not necessarily indicative of future results.
- CFTC rule 4.41:Hypothetical or simulated performance results have certain limitations. Unlike an actual performance record, simulated results do not represent actual trading. Also, since the trades have not been executed, the results may have under-or-over compensated for the impact, if any, of certain market factors, such as lack of liquidity. Simulated trading programs in general are also subject to the fact that they are designed with the benefit of hindsight. No representation is being made that any account will or is likely to achieve profit or losses similar to those shown.
- Risk Warning: Trading foreign exchange on margin carries a high level of risk, and may not be suitable for all investors. The high degree of leverage can work against you as well as for you. Before deciding to invest in foreign exchange you should carefully consider your investment objectives, level of experience, and risk appetite. The possibility exists that you could sustain a loss of some or all of your initial investment and therefore you should not invest money that you cannot afford to lose. You should be aware of all the risks associated with foreign exchange trading, and seek advice from an independent financial advisor if you have any doubts. Our linking to these sites does not constitute an endorsement of any products, services or the information found on them. Once you link to another site you are subject to the policies of the new site. By using this site, you agree to the Terms of Service, Privacy Policy and Risk Disclosure. Copyright � 2012 Tradingvesting, LLC. All rights reserved. If you have any questions regarding the Online Economic Calendar application, please contact us: click here.
THIS BRIEF STATEMENT CANNOT, OF COURSE, DISCLOSE ALL THE RISKS AND OTHER ASPECTS OF THE COMMODITY MARKETS AND EQUITY MARKETS. PLEASE READ MORE AT: TERMS OF SERVICE.
|
|
|
| |
|
|
|
|
| |
|
|
|
|
|
| |
|
|
|
|
|