|
 |
|
 |
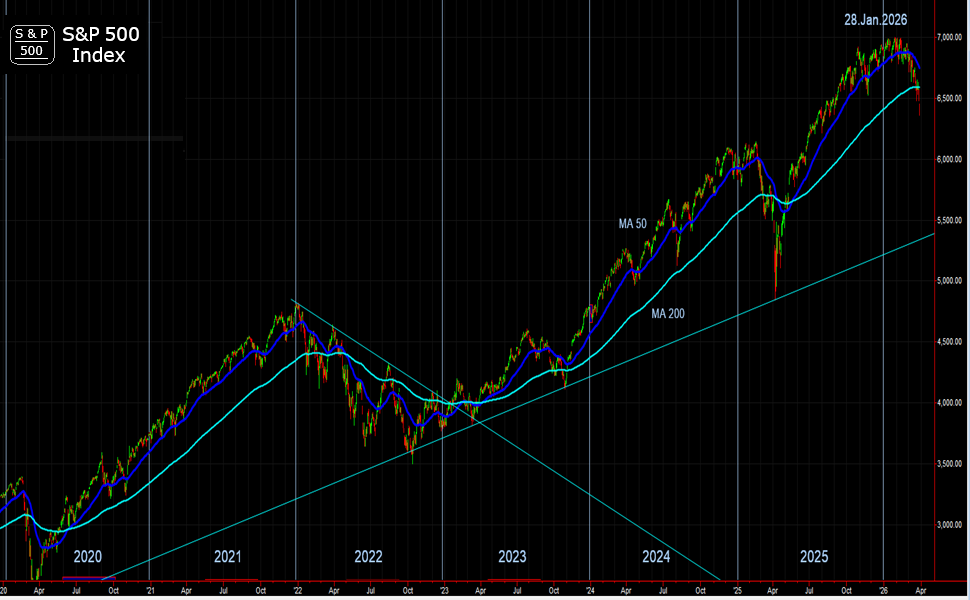
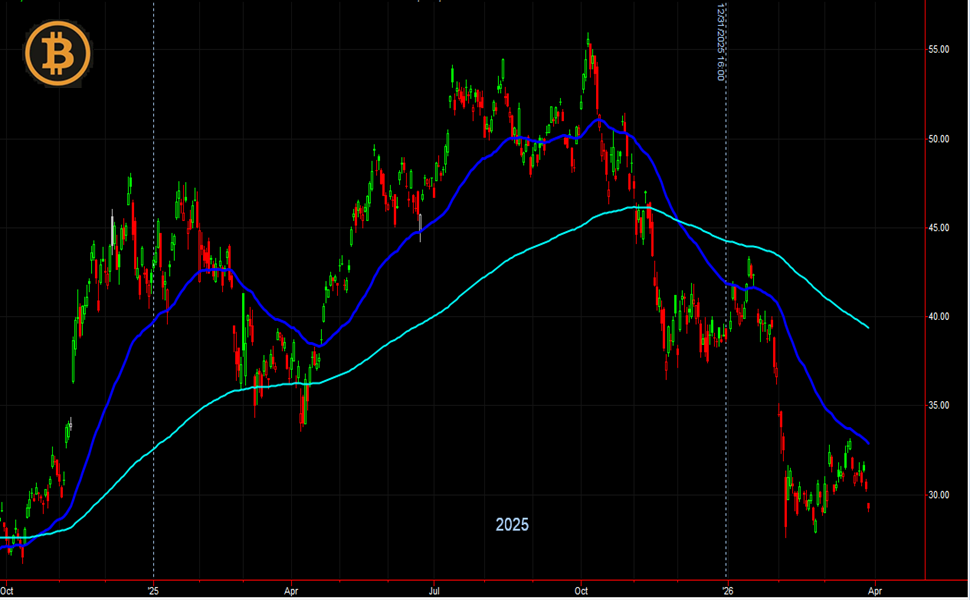
Stock Market | S&P 500 Index |
|
 |
|
|
|
|
|
|
|
|
| |
|
| |
 3. Stock Market| S&P 500 (3 of 5) 3. Stock Market| S&P 500 (3 of 5)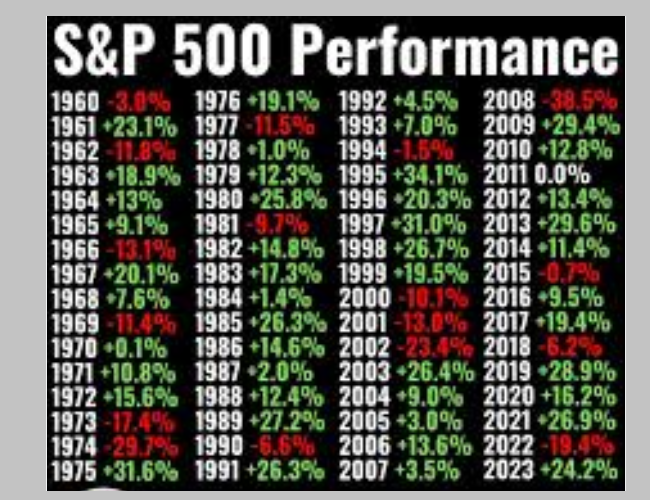 4. Currencies | US Dollar (4 of 5) 4. Currencies | US Dollar (4 of 5) 5. Hedging | Gold (5 of 5) 5. Hedging | Gold (5 of 5) 1. Commodities | Oil (1 of 5) 1. Commodities | Oil (1 of 5) 2. Bond Market | 10 Year (2 of 5) 2. Bond Market | 10 Year (2 of 5)
|
 |
|
|
|
|
| |
|
→ Big Chart |
|
→ Release |
|
| |
|
|
|
|
|
| |
|
|
|
|
| |
|
|
| |
|
|
|
|
|
|
|
|
|
|
|
|
|
|
|
|
|
|
|
 |
|
Big Chart | Large Data |
 |
|
S&P 500 | Market Correlation |
|
Today's Week |
 |
|
|
|
|
|
|
|
|
|
|
|
|
|
| |
|
|
|
|
|
|
|
|
|
|
|
|
|
| |
|
|
|
|
|
|
|
|
|
|
|
|
|
|
|
|
|
|
|
|
|
Historical Data | Annual |
|
|
S&P 500 | Market Correlation |
|
Today's Week |
|
|
|
|
|
|
|
|
|
|
|
|
|
| No |
Year |
Open |
High |
Low |
YearClose |
Points |
Annual% |
W/B |
U/D |
| 2 |
2025 |
5,903.26 |
6,750.87 |
4,835.04 |
6,699.62 |
796.36 |
13.49% |
|
 |
| 3 |
2024 |
4,745.20 |
6,099.97 |
4,682.11 |
5,881.63 |
1,136.43 |
23.95% |
|
 |
| 2 |
2023 |
3,853.29 |
4,793.30 |
3,794.33 |
4,769.83 |
916.54 |
23.79% |
|
|
| 3 |
2022 |
4,778.14 |
4,796.56 |
3,577.03 |
3,839.50 |
-938.64 |
-19.64% |
|
|
| 4 |
2021 |
3,764.61 |
4,793.06 |
3,700.65 |
4,766.18 |
1,001.57 |
26.60% |
Good |
|
| 5 |
2020 |
3,244.67 |
3,756.07 |
2,237.40 |
3,756.07 |
511.40 |
15.76% |
|
|
| 6 |
2019 |
2,476.96 |
3,240.02 |
2,447.89 |
3,230.78 |
753.82 |
30.43% |
Good |
|
| 7 |
2018 |
2,683.73 |
2,930.75 |
2,351.10 |
2,506.85 |
-176.88 |
-6.59% |
|
|
| 8 |
2017 |
2,251.57 |
2,690.16 |
2,257.83 |
2,673.61 |
422.04 |
18.74% |
|
|
| 9 |
2016 |
2,038.20 |
2,271.72 |
1,829.08 |
2,238.83 |
200.63 |
9.84% |
|
|
| 10 |
2015 |
2,058.90 |
2,130.82 |
1,867.61 |
2,043.94 |
-14.96 |
-0.73% |
|
|
| 11 |
2014 |
1,845.86 |
2,090.57 |
1,741.89 |
2,058.90 |
213.04 |
11.54% |
|
|
| 12 |
2013 |
1,426.19 |
1,848.36 |
1,457.15 |
1,848.36 |
422.17 |
29.60% |
Good |
|
| 13 |
2012 |
1,258.86 |
1,465.77 |
1,277.06 |
1,426.19 |
167.33 |
13.29% |
|
|
| 14 |
2011 |
1,257.62 |
1,363.61 |
1,099.23 |
1,257.60 |
-0.02 |
0.00% |
Zero |
 |
| 15 |
2010 |
1,116.56 |
1,259.78 |
1,022.58 |
1,257.64 |
141.08 |
12.64% |
|
|
| 16 |
2009 |
902.99 |
1,127.78 |
676.53 |
1,115.10 |
212.11 |
23.49% |
|
|
| 17 |
2008 |
1,467.97 |
1,447.16 |
752.44 |
903.25 |
-564.72 |
-38.47% |
Worst |
|
| 18 |
2007 |
1,418.03 |
1,565.15 |
1,374.12 |
1,468.36 |
50.33 |
3.55% |
|
|
| 19 |
2006 |
1,248.29 |
1,427.09 |
1,223.69 |
1,418.30 |
170.01 |
13.62% |
|
|
| 20 |
2005 |
1,211.92 |
1,272.74 |
1,137.50 |
1,248.29 |
36.37 |
3.00% |
|
|
| 21 |
2004 |
1,111.92 |
1,213.55 |
1,063.23 |
1,211.92 |
100.00 |
8.99% |
|
|
| 22 |
2003 |
879.82 |
1,111.92 |
800.73 |
1,111.92 |
232.10 |
26.38% |
|
|
| 23 |
2002 |
1,148.08 |
1,172.51 |
776.76 |
879.82 |
-268.26 |
-23.37% |
Bad |
|
| 24 |
2001 |
1,320.28 |
1,373.73 |
965.8 |
1,148.08 |
-172.20 |
-13.04% |
|
|
| 25 |
2000 |
1,469.25 |
1,527.46 |
1,264.74 |
1,320.28 |
-148.97 |
-10.14% |
|
|
| 26 |
1999 |
1,229.23 |
1,469.25 |
1,212.19 |
1,469.25 |
240.02 |
19.53% |
|
|
| 27 |
1998 |
970.43 |
1,241.81 |
927.69 |
1,229.23 |
258.80 |
26.67% |
Good |
|
| 28 |
1997 |
740.74 |
983.79 |
737.01 |
970.43 |
229.69 |
31.01% |
|
|
| 29 |
1996 |
615.93 |
757.03 |
598.48 |
740.74 |
124.81 |
20.26% |
|
|
| 30 |
1995 |
459.21 |
621.69 |
459.11 |
615.93 |
156.72 |
34.13% |
Good |
|
| 31 |
1994 |
466.51 |
482.00 |
438.92 |
459.27 |
-7.24 |
-1.55% |
|
|
| 32 |
1993 |
435.70 |
470.94 |
429.05 |
466.45 |
30.75 |
7.06% |
|
|
| 33 |
1992 |
417.03 |
441.28 |
394.5 |
435.71 |
18.68 |
4.48% |
|
|
| 34 |
1991 |
330.20 |
417.09 |
311.49 |
417.09 |
86.89 |
26.31% |
Good |
|
| 35 |
1990 |
353.40 |
368.95 |
295.46 |
330.22 |
-23.18 |
-6.56% |
|
|
| 36 |
1989 |
277.72 |
359.8 |
275.31 |
353.40 |
75.68 |
27.25% |
Good |
|
| 37 |
1988 |
247.10 |
283.66 |
242.63 |
277.72 |
30.62 |
12.39% |
|
|
| 38 |
1987 |
242.17 |
336.77 |
223.92 |
247.08 |
4.91 |
2.03% |
|
|
| 39 |
1986 |
211.28 |
254.20 |
203.49 |
242.17 |
30.89 |
14.62% |
|
|
| 40 |
1985 |
167.20 |
212.02 |
163.68 |
211.28 |
44.08 |
26.36% |
Good |
|
| 41 |
1984 |
164.93 |
170.41 |
147.82 |
167.24 |
2.31 |
1.40% |
|
|
| 42 |
1983 |
140.65 |
172.65 |
138.34 |
164.90 |
24.25 |
17.24% |
|
|
| 43 |
1982 |
122.55 |
143.02 |
102.42 |
140.64 |
18.09 |
14.76% |
|
|
| 44 |
1981 |
135.76 |
138.12 |
112.77 |
122.55 |
-13.21 |
-9.73% |
|
|
| 45 |
1980 |
107.94 |
140.52 |
98.22 |
135.76 |
27.82 |
25.77% |
Good |
|
| 46 |
1979 |
96.11 |
111.27 |
96.13 |
107.94 |
11.83 |
12.31% |
|
|
| 47 |
1978 |
95.10 |
106.99 |
86.90 |
96.11 |
1.01 |
1.06% |
|
|
| 48 |
1977 |
107.46 |
107.00 |
90.71 |
95.10 |
-12.36 |
-11.50% |
|
|
| 49 |
1976 |
90.19 |
107.83 |
90.90 |
107.46 |
17.27 |
19.15% |
|
|
| 50 |
1975 |
68.65 |
95.61 |
70.04 |
90.19 |
21.54 |
31.38% |
Good |
|
| 51 |
1974 |
97.55 |
99.80 |
62.28 |
68.56 |
-28.99 |
-29.72% |
Bad |
|
| 52 |
1973 |
118.06 |
120.24 |
92.16 |
97.55 |
-20.51 |
-17.37% |
|
|
| 53 |
1972 |
102.09 |
119.12 |
101.67 |
118.05 |
15.96 |
15.63% |
|
|
| 54 |
1971 |
92.15 |
104.77 |
90.16 |
102.09 |
9.94 |
10.79% |
|
|
| 55 |
1970 |
92.06 |
93.46 |
69.29 |
92.15 |
0.09 |
0.10% |
|
|
| 56 |
1969 |
103.86 |
106.16 |
89.20 |
92.06 |
-11.80 |
-11.80% |
|
|
| 57 |
1968 |
96.47 |
108.37 |
87.72 |
103.86 |
7.39 |
7.66% |
|
|
| 58 |
1967 |
80.33 |
97.59 |
80.38 |
96.47 |
16.14 |
20.09% |
|
|
| 59 |
1966 |
92.43 |
94.06 |
73.20 |
80.33 |
-11.85 |
-12.86% |
|
|
| 60 |
1965 |
84.75 |
92.63 |
81.60 |
92.43 |
8.20 |
9.74% |
|
|
| 61 |
1964 |
75.43 |
86.28 |
75.43 |
84.75 |
9.32 |
12.36% |
|
|
| 62 |
1963 |
62.69 |
75.02 |
62.69 |
75.02 |
12.33 |
19.67% |
|
|
| 63 |
1962 |
70.96 |
71.13 |
52.32 |
63.10 |
-7.86 |
-11.08% |
|
|
| 64 |
1961 |
57.57 |
72.64 |
57.57 |
71.55 |
13.98 |
24.28% |
Good |
|
| 65 |
1960 |
59.91 |
60.39 |
52.20 |
58.11 |
-1.80 |
-3.00% |
|
|
| 66 |
1959 |
55.44 |
60.71 |
53.58 |
59.89 |
4.45 |
8.03% |
|
|
| 67 |
1958 |
40.33 |
55.21 |
40.33 |
55.21 |
14.88 |
36.90% |
Good |
|
| 68 |
1957 |
46.20 |
49.13 |
38.98 |
39.99 |
-6.21 |
-13.44% |
|
|
| 69 |
1956 |
45.16 |
49.64 |
43.11 |
46.67 |
1.51 |
3.34% |
|
|
| 70 |
1955 |
36.75 |
46.41 |
34.58 |
45.48 |
8.73 |
23.76% |
|
|
| 71 |
1954 |
24.95 |
35.98 |
24.80 |
35.98 |
11.03 |
44.21% |
best |
|
| 72 |
1953 |
26.54 |
26.66 |
22.71 |
24.81 |
-1.73 |
-6.52% |
|
|
| 73 |
1952 |
23.80 |
26.59 |
23.09 |
26.57 |
2.77 |
11.64% |
|
|
| 74 |
1951 |
20.77 |
23.85 |
20.69 |
23.77 |
3.00 |
14.44% |
|
|
| 75 |
1950 |
16.66 |
20.43 |
16.65 |
20.43 |
3.75 |
22.51% |
|
|
| 76 |
1949 |
14.95 |
16.79 |
13.55 |
16.76 |
1.81 |
12.11% |
|
|
| 77 |
1948 |
15.34 |
17.06 |
13.84 |
15.20 |
-0.14 |
-0.91% |
|
|
| 20 |
1947 |
15.20 |
16.20 |
13.71 |
15.30 |
0.10 |
0.66% |
|
|
| 19 |
1946 |
17.25 |
19.25 |
14.12 |
15.30 |
-1.95 |
-11.30% |
|
|
| 18 |
1945 |
13.33 |
17.68 |
13.21 |
17.36 |
4.03 |
30.23% |
Good |
|
| 17 |
1944 |
11.66 |
13.29 |
11.56 |
13.28 |
1.62 |
13.89% |
|
|
| 16 |
1943 |
9.84 |
12.64 |
9.84 |
11.67 |
1.83 |
18.60% |
|
|
| 15 |
1942 |
8.89 |
9.77 |
7.47 |
9.77 |
0.88 |
9.90% |
|
|
| 14 |
1941 |
10.48 |
10.86 |
8.37 |
8.69 |
-1.79 |
-17.08% |
|
|
| 13 |
1940 |
12.63 |
12.77 |
8.99 |
10.58 |
-2.05 |
-16.23% |
|
|
| 12 |
1939 |
13.08 |
13.23 |
10.18 |
12.49 |
-0.59 |
-4.51% |
|
|
| 11 |
1938 |
10.52 |
13.91 |
8.50 |
13.21 |
2.69 |
25.57% |
|
|
| 10 |
1937 |
17.02 |
18.68 |
10.17 |
10.55 |
-6.47 |
-38.01% |
Bad |
|
| 9 |
1936 |
13.40 |
17.69 |
13.4 |
17.18 |
3.78 |
28.21% |
|
|
| 8 |
1935 |
9.51 |
13.46 |
8.06 |
13.43 |
3.92 |
41.22% |
Good |
|
| 7 |
1934 |
10.11 |
11.82 |
8.36 |
9.50 |
-0.61 |
-6.03% |
|
|
| 6 |
1933 |
6.83 |
12.20 |
5.53 |
10.10 |
3.27 |
47.88% |
Good |
|
| 5 |
1932 |
7.82 |
9.31 |
4.40 |
6.89 |
-0.93 |
-11.89% |
|
|
| 4 |
1931 |
15.85 |
18.17 |
7.72 |
8.12 |
-7.73 |
-48.77% |
Bad |
|
| 3 |
1930 |
21.18 |
25.92 |
14.44 |
15.34 |
-5.84 |
-27.57% |
Bad |
|
| 2 |
1929 |
24.81 |
31.86 |
17.66 |
21.45 |
-3.36 |
-13.54% |
|
|
| 1 |
1928 |
17.76 |
24.35 |
16.95 |
24.35 |
6.59 |
37.11% |
Good |
|
| No |
Year |
Open |
High |
Low |
YearClose |
Points |
Annual% |
W/B |
U/D |
| ... |
... |
... |
... |
... |
... |
... |
... |
... |
... |
|
|
|
|
|
|
|
|
|
|
|
|
|
|
|
|
|
|
|
|
|
|
|
|
| |
|
|
|
|
|
|
|
|
|
|
|
|
|
|
|
|
|
|
|
|
|
Monthly | Last 10 Years |
|
|
S&P 500 | Market Correlation |
|
Today's Week |
|
|
|
|
|
|
|
|
|
|
|
|
|
| No |
Date |
2017 |
2018 |
2019 |
2020 |
2021 |
2022 |
2023 |
2024 |
2025 |
2026 |
Avg |
| |
Years |
1 |
2 |
3 |
4 |
5 |
6 |
7 |
8 |
9 |
10 |
|
| 1 |
January |
1.21% |
5.22% |
9.17% |
-0.59% |
-1.34% |
-5.50% |
5.80% |
-2.62% |
0.71% |
... |
1.42% |
| 2 |
February |
3.41% |
-3.64% |
3.04% |
-8.70% |
2.14% |
-3.22% |
-2.45% |
5.40% |
4.48% |
... |
-0.50% |
| 3 |
March |
-0.73% |
-2.74% |
1.29% |
-13.10% |
3.39% |
3.83% |
3.68% |
-0.91% |
2.75% |
... |
-0.66% |
| 4 |
April |
0.93% |
0.55% |
3.41% |
16.59% |
4.72% |
-8.99% |
1.64% |
2.46% |
2.46% |
... |
2.66% |
| 5 |
May |
0.98% |
2.36% |
-6.78% |
6.11% |
0.29% |
0.04% |
0.31% |
2.00% |
5.23% |
... |
0.66% |
| 6 |
June |
0.32% |
-0.01% |
6.91% |
2.02% |
1.92% |
-8.78% |
2.37% |
0.94% |
5.09% |
... |
0.71% |
| 7 |
July |
1.60% |
4.12% |
0.30% |
5.32% |
2.20% |
9.24% |
3.11% |
3.08% |
-0.51% |
... |
3.62% |
| 8 |
August |
-0.22% |
2.85% |
-1.81% |
6.45% |
2.63% |
-3.83% |
-1.55% |
4.94% |
-5.97% |
... |
1.18% |
| 9 |
September |
1.82% |
0.59% |
2.33% |
-4.12% |
-4.89% |
-8.92% |
-5.35% |
-4.23% |
0.25% |
... |
-2.85% |
| 10 |
October |
2.14% |
-7.33% |
1.81% |
-3.42% |
6.68% |
7.26% |
-2.12% |
3.06% |
... |
... |
1.01% |
| 11 |
November |
2.49% |
1.57% |
2.96% |
9.87% |
-0.95% |
4.57% |
8.72% |
4.84% |
... |
... |
4.26% |
| 12 |
December |
1.08% |
-10.16% |
2.77% |
3.02% |
3.55% |
-6.06% |
4.61% |
2.12% |
... |
... |
0.12% |
| |
Annual |
18.74% |
-6.59% |
30.43% |
15.76% |
26.61% |
-19.64% |
23.79% |
23.95% |
13.89% |
|
14.10% |
|
|
|
|
|
|
|
|
|
|
|
|
|
| Mo |
Average |
1.25% |
-0.55% |
2.12% |
1.62% |
1.70% |
-1.70% |
1.56% |
1.76% |
1.61% |
... |
1.04% |
| Mo |
High |
3.41% |
5.22% |
9.17% |
16.59% |
6.68% |
9.24% |
8.72% |
5.40% |
5.23% |
... |
16.59% |
| Mo |
Low |
-0.73% |
-10.16% |
-6.78% |
-13.10% |
-4.89% |
-8.78% |
-2.45% |
-4.23% |
-5.97% |
... |
-13.10% |
|
|
|
|
| |
|
View Monthly |
|
|
 |
| |
|
|
|
|
|
|
|
|
|
|
|
|
|
|
|
|
|
|
|
|
|
Definitions | Explain |
|
|
S&P 500 | Market Correlation |
|
Today's Week |
|
|
|
|
|
|
|
|
|
|
|
|
| |
|
|
|
|
| |
|
| MARKET CORRELATION |
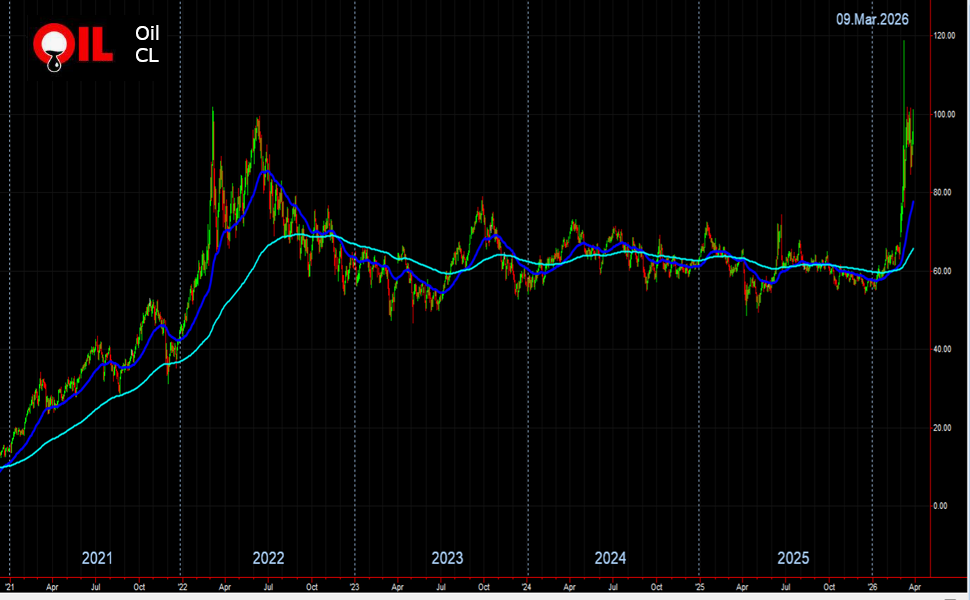
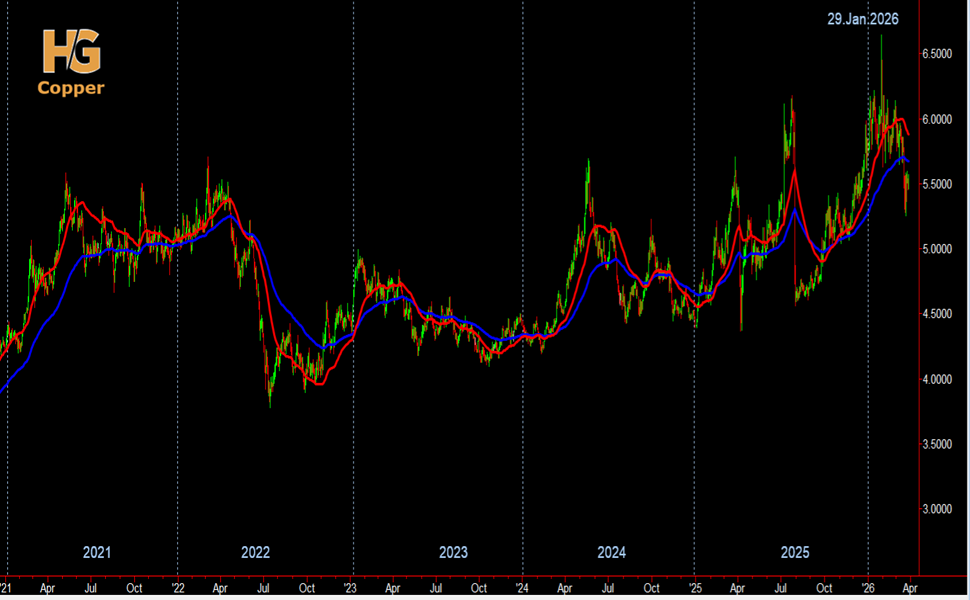
| Commodities Move First
The reason Commodity prices are so important to the Market Correlation picture is that they play a major role as a leading indicator of Inflation. And inflation is the general increase in prices over a 12 month period.
If Commodities start to rise, that means economic strength and that will push Bond prices lower and Interest Rates higher. On the other hand, falling Commodity prices means economic weakness.
A period of rising Commodity prices arouses fears of Inflation which prompts monetary authorities to raise Interest Rates to combat that inflation. Eventually, the rise in Interest Rates chokes off the economic expansion which leads to the inevitable economic slowdown and recession.
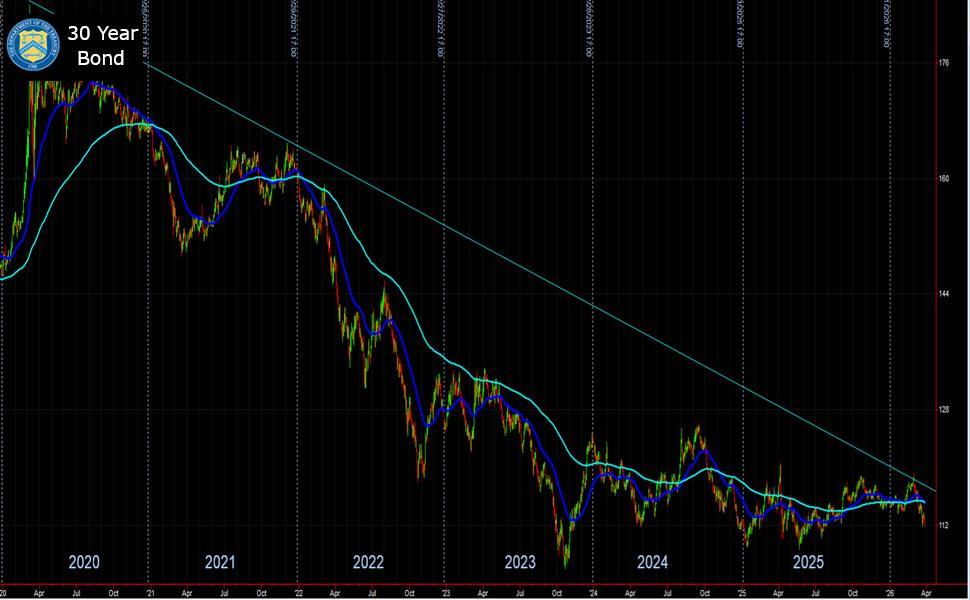
Bonds Move Second
If Interest Rates rise to fight Inflation, Bonds will go down. People will take money from the Bond Market and place into the Stock Market for better profits. That creates and inverse correlatio between Stocks and Bonds.
The relationship between bond price and interest rate can be seen in the following example:
If you have a bond paying 5% and inflation is 3% your "real return" is 2%. But if inflation goes to 4% that return is only 1%. Therefore the bond is worth less. The longer you have it the worse off you are. Furthermore you can expect the government to raise the price they will be paying on new bonds to compensate for the rise in inflation. Which means your bond will likely be worth even less.
Stocks Move Third
During boom times, most eyes will be on inflation as people watch for signs that the economy is overheating. For example, during peak periods of the business cycle when the economy is experiencing rapid growth in real GDP, employment will increase, and unemployment decrease, as businesses seek workers to produce a higher output. But economists will be worried about inflation, the higher cost of living that diminishes growth.
The more the entrepreneur extends the employment opportunity the more he has to pay to that particular factor of production and the more payment to factor of production the increase in the cost of producing a unit will be observed and in order to maintain the profitability of the product the entrepreneur will inflate the price of that product.
There has been an inverse relation between rate of inflation and the rate of unemployment in an economy.
During tough times, the employment numbers are center stage as economists look for a rebound in job losses. During the recession demand for raw materials and money decreases, resulting in lower commodity prices and interest rates. A similar process will be observed through out the economy when the government intends to create job.
The price of products or services, where the workforce is installed, will increase hence an increase in the rate of inflation will be visible through out the economy. It can be concluded from the aforesaid explanation that when a government intend to lower down the rate of unemployment it had to bear the increase rate of inflation in the national economy.
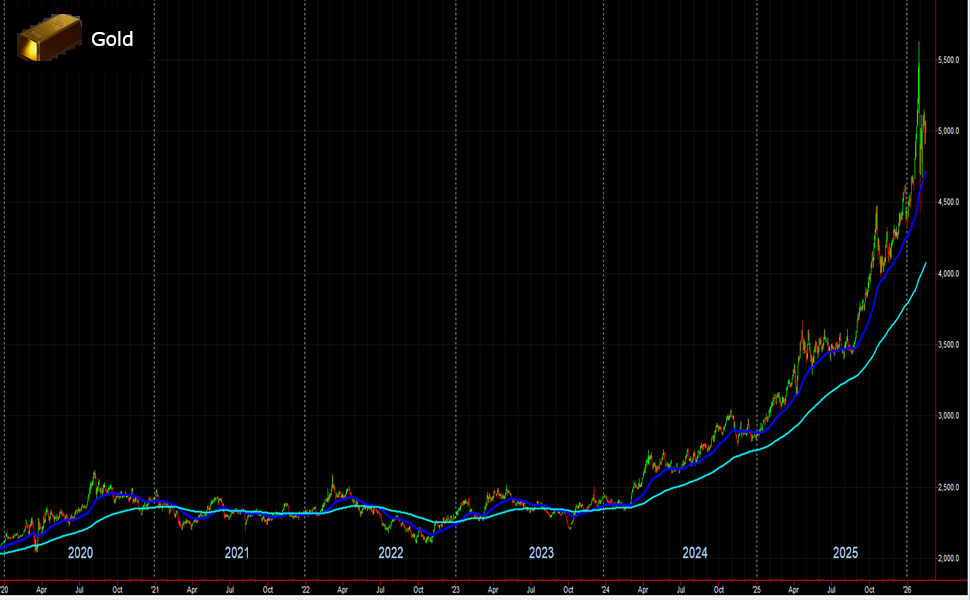
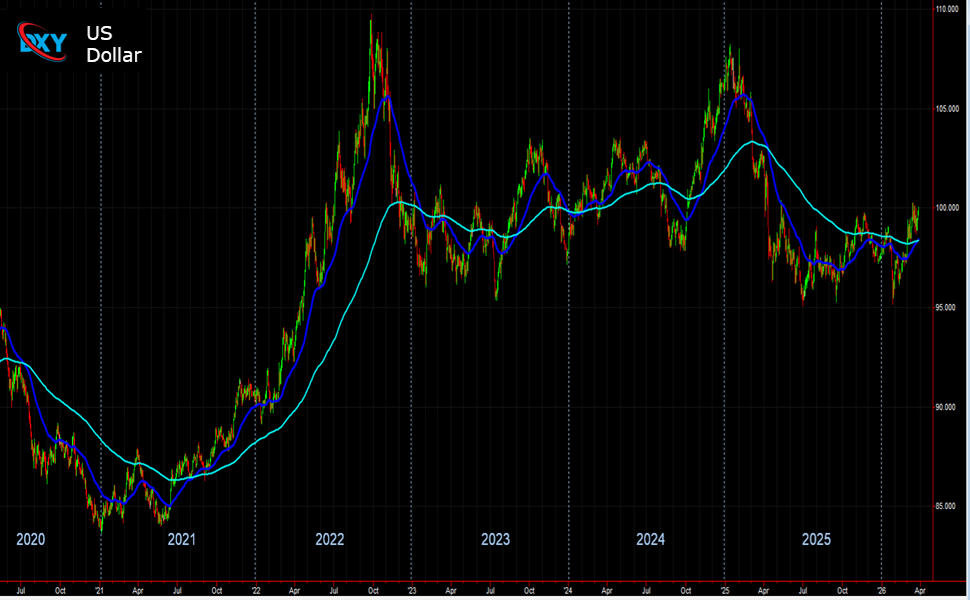
Currencies and Major Economies influenced all
Gold is seen as a hedge against inflation. As the dollar weakens, gold becomes more expensive. Gold becomes more valuable in times of crisis.
When the economy starts to improve, the dollar will strengthen and gold will become less expensive.
China...
What is the relationship between unemployment and GDP?
if you have a 1 % increase in unemployment then you have a 2% lose in GDP
What is the relationship of unemployment and GDP?
The relationship between unemployment and GDP is called Okun's law. It is the association of a higher national economic output with the decrease in national unemployment. This is because in order to...
Interest rates are low now. But when they rise -- and some day they will -- home prices may suffer
For now, mortgage rates are still near historically low levels. But more and more, economists are beginning to worry about a resurgence in inflation and thus rates. That, of course, would remove one of the key underpinnings of the recent boom in real estate.
Other economists say the relationship between home prices and interest rates isn't quite as direct. For one, when rising rates go hand-in-hand with an economic recovery, as they often do, better job prospects partially offset the effects of higher rates.
If rates rise it's because the economy is getting better,"
What isVOO and SPY?
Vanguard S&P 500 ETF (VOO) carries an expense ratio of 0.03% compared to SPY’s 0.09%, making it the superior choice for a long-term core portfolio position that returned 237% over ten years and 37% over the past year. The SPDR S&P 500 ETF Trust (NYSEARCA:SPY) and its Vanguard counterpart, VOO, both track the S&P 500 Index, which holds roughly 500 of the largest U.S. companies across all eleven sectors. The structural difference is cost. SPY carries an expense ratio of about 0.09%, while VOO's expense ratio sits at 0.03%. Over a 30-year holding period, that gap compounds into meaningful drag on SPY relative to VOO — which is why Orman names VOO specifically. The performance record for this index is hard to argue with. Over the past ten years, SPY has returned 237%, and over the past year alone it has returned 37%. The S&P 500 recently crossed 7,000 for the first time, a milestone that generated sentiment scores of 80 (very bullish) across retail investing communities. The long-term compounding case for holding a broad index fund is one of the most thoroughly documented arguments in personal finance.
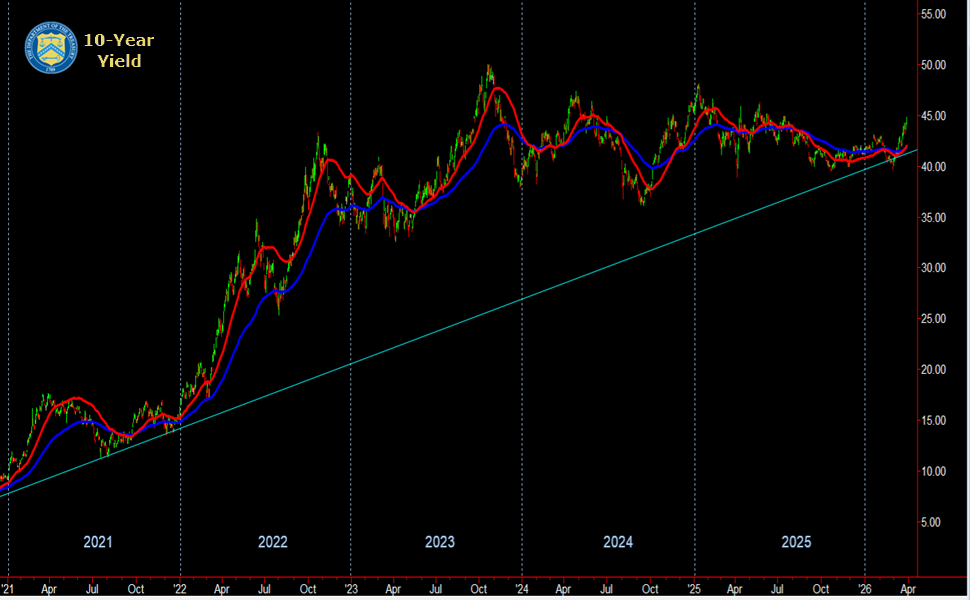
How to Play Rising Interest Rates
The riskiest and most profitable way to play rising yields and a decline in bond prices is to buy call options on the ProShares UltraShort 20+ Year Treasury ETF (NYSE: TBT).
This exchange-traded fund is a double inverse ETF on the value of 20-year-plus Treasuries. When their daily value falls 1%, this ETF theoretically rises 2%. Because it tracks daily movements in bonds, it is more volatile than the long-term movement of the underlying bond.
If you like the idea underpinning the trade interest rates will rise and the market will price this in six months or more before it happens look at TBT January 2012 calls.
|
|
|
| |
|
|
|
|
|
|
|
|
|
|
|
| |
|
|
|
|
|
|
| DATA INFORMATION |
SP 500 |
| SOURCE |
Bureau of Labor Statistics (BLS), U.S. Department of Labor
|
| WEB |
www.bls.gov |
| FREQUENCY |
Monthly |
| AVAILABILITY |
Mid-month |
| COVERAGE |
Data are for the previous month. Data for June are released in July. |
| REVISIONS |
No |
| IMPORTANCE |
Inflation - Very Important |
|
| |
|
|
|
|
|
|
|
|
|
|
|
|