 |
 |
|
|
|
Week 47 -2012 | From Nov 19 to Nov 23, 2012 |
|
 |
|
|
|
|
|
|
| |
|
|
|
|
|
|
|
|
|
|
| |
Economic Data for Week 47-2012 | Global View | Week Rating
| DATE |
DAY |
REPORT/CATEGORY |
HIGHLIGHTS ON WEEK 47-2012 |
LAST |
|
Mon |
Existing Home Sales Index |
Existing-home sales rose 2.1% in October to a seasonally adjusted annual rate of 4.79 million from a downwardly revised rate of 4.69 million in September. A prior September estimate pegged the level at a 4.75 million rate. |
4.79M |
|
 |
Real Estate |
Sales of existing homes rose in October, with gains in three of four regions as activity continues to bounce off post-recession lows, the National Association of Realtors reported Monday. |
|
|
Mon |
Housing Market Index |
The National Association of Home Builders/Wells Fargo housing market index rose 5 points to a seasonally adjusted level of 46, the highest point since May 2006. |
46
Level
|
|
|
Real Estate |
Home-builder sentiment climbed in November for the seventh straight month to the highest level in more than six years, according to data released Monday that shows the continued improvement in the housing market. |
|
|
Tue |
ICSC Goldman Index |
Store sales improved this week despite growing�pessimistic�sentiment surrounding the shopping season. |
2.5% |
|
|
Sales and Inventories |
ICSC-Goldman store sales increased to 2.5% year over year this week, compared to 1.8% Y/Y last week. |
|
|
Tue |
Housing Starts |
Housing starts rose 3.6% last month to a seasonally adjusted annual rate of 894,000, the highest rate since July 2008, the U.S. Department of Commerce reported. Starts are up 42% from last year, though the rate remains far below a bubble peak of almost 2.3 million in 2006. |
894K |
|
|
Real Estate |
The pace of home building rose to its highest level in more than four years in October, according to a government reading issued Tuesday. Housing starts highest in more than four years. |
|
|
Tue |
Building Permits |
Applications for building permits slipped 2.7% to an annual pace of 866,000. Despite that decline, the October reading was stronger than any other month other than September over the course of the last four years. |
866K |
|
|
Real Estate |
October building permits for single-family homes up 2.2%. �Building permits, a sign of future demand, hit a rate of 866,000 in October, down 2.7% from September, but up 30% from the prior year. Permits for single-family homes rose 2.2% in October to an annual rate of 562,000, while permits for structures with at least two units fell 10.6%. |
|
|
Tue |
Johnson Redbook |
Store sales are trendless leading up to the big last week of the month, according to Redbook whose same-store index remains flat at a year-on-year plus 1.8 percent.� |
1.8%
Y/Y
|
|
|
Sales and Inventories |
Redbook store sales increased to 1.8% Y/Y this week, compared to 1.6% Y/Y last week. |
|
|
Wed |
MBA purchase Applications |
Applications for U.S. home mortgages eased last week as interest rates edged up, though demand for new loans improved. |
-2.2% |
|
|
Real Estate |
The MBA said its seasonally adjusted index of mortgage application activity, which includes both refinancing and home purchase demand, fell 2.2% in the week ended Nov 16. |
|
|
Wed |
Jobless/Initial Claims |
First-time applications for unemployment benefits declined sharply last week but the number of new claims filed remains at high levels due to the aftereffects of Hurricane Sandy. However, the impact of the storm is likely to be temporary. |
410K |
|
|
Employment |
Initial jobless claims dropped by 41,000 to a seasonally adjusted 410,000 in the week ended Nov. 17. A less volatile measure of claims, the four-week moving average, rose by 9,500 to 396,250. |
|
|
Wed |
Consumer Sentiment |
Consumer sentiment in November gained slightly to a reading of 82.7 but wasn't as strong as initially estimated. Initially, they had reported a reading of 84.9 in November from a final October reading of 82.6. |
82.7 |
|
|
Consumer |
US consumer sentiment stalled at the end of November as uncertainty grew over federal tax and spending programs next year. |
|
|
Wed |
Leading Indicators |
Leading economic index rises 0.2% in October. Positive: Four of the 10 indicators made positive contributions in October, led by the interest-rate spread |
0.2% |
|
|
Business Actvity |
The LEI is a weighted gauge of 10 indicators that are designed to signal business cycle peaks and troughs. . Negatvie: four indicators made negative contributions, led by building permits. There were neutral readings on two manufacturing-related indicators. |
|
|
Wed |
EIA Crude Oil Report |
We're going to see some crazy volatility in the market with rising geopolitics and rising economic uncertainty. The Middle East tensions could continue to give prices some life in the near term but we suspect that the bearish economic factors will be dominant |
-1.5M
Barrels
|
|
|
Commodity |
Brent crude rose above $110 per barrel on Wednesday on fears of supply disruption from the Middle East as clashes raged between Palestinians and Israelis despite overnight truce talks. |
|
|
Wed |
EIA Natural Gas Report |
Natural gas in storage fell 38 billion cubic feet in the November 16 week to 3,873 bcf. In the East Region, stocks were 2 Bcf below the 5-year average following net withdrawals of 19 Bcf. |
-38 bcf |
|
|
Commodity |
Working gas in storage was 3,873 Bcf as of Friday, November 16, 2012, according to EIA estimates. This represents a net decline of 38 Bcf from the previous week. Stocks were 24 Bcf higher than last year at this time and 168 Bcf above the 5-year average of 3,705 Bcf. |
|
|
Thu |
China PMI |
The China HSBC Flash Manufacturing Purchasing Managers Index (PMI) rose to a 13-month high of 50.4 in November, the latest indicator of recovery in the real economy after data showing solid credit growth, firmer exports and rising industrial output in the previous month |
|
|
|
U.S. Market Holidays |
This month's PMI reading above 50 is likely to be seen as a turning point by the market, particularly if it is born out by the final reading due on December 1 and by official indicators. |
|
|
Thu |
Thanksgiving |
There will be no U.S. Market Activity Today |
|
|
|
U.S. Market Holidays |
|
|
|
Fri |
Fixed Mortgage Rates |
Average fixed mortgage rates in the U.S. declined over the past week, reaching fresh lows for a second straight week, according to mortgage-finance company Freddie Mac (FMCC). |
3.91% |
|
|
Interest Rates |
For the week ended Thursday, the 30-year fixed-rate mortgage averaged 3.31%, compared with 3.34% the previous week and 3.98% a year earlier. Rates on 15-year fixed-rate mortgages averaged 2.63%, versus 2.65% a week earlier and 3.3% a year earlier. |
|
|
Fri |
Fed Balance Sheet |
The Federal Reserve's balance sheet shrank in the latest week with a lower holdings of federal government and agency securities, Fed data released on Friday showed. |
|
|
|
Government |
The Fed's balance sheet stood at $2.853 trillion on November 21, down from $2.859 trillion on November 14. Fed balance sheet contracts in latest week |
|
|
Fri |
M2 Money Supply |
|
|
|
|
Money Supply |
|
|
|
|
|
|
|
|
|
|
|
|
|
|
|
|
| |
|
|
|
|
|
|
|
|
|
|
|
|
|
|
|
| |
|
|
|
|
|
| |
|
|
|
|
|
| |
|
|
|
|
|
|
|
|
|
|
| |
|
| WEEK 47-2012 ENDING NOV. 23 |
Reports Commentary
While still far from 2005 levels above 7 million, home sales have recovered from a July 2010 low of 3.3 million. Other housing-market indicators have shown signs of improvement, with gains in prices, sales and homebuilder sentiment.
Record-low interest rates for mortgages are feeding demand.The low inventory number is a sign that housing markets are tightening, and that builders will continue ramping up on new construction to fill demand.
This Week Potential Shocks to Investors:
1. China Hard Landing: China is an Export Driven Economy
2. European Bank Crisis
3. Fiscal Cliff Falloff
4. Oil Surge
5. Earning Disappointments
The housing market has been showing numerous signs of recovery in recent months. Demand for homes have been helped by mortgage rates at record lows.
The Federal Reserve's decision to buy $40 billion in mortgages every month is likely to keep rates low for the foreseeable future. The low mortgage rates, coupled with affordable housing prices and an improving jobs market have helped to restart home sales.
The upcoming Black Friday and following Cyber Monday have more anticipation and momentum than ever, so it is expected we see a strong final week of November.
Federal Reserve Chairman Ben Bernanke on Tuesday urged Congress and the Obama administration to strike a budget deal to avert tax increases and spending cuts that could trigger a recession next year
Before Sandy, jobless claims had fluctuated between 360,000 and 390,000 this year, underscoring sluggish hiring trends in the U.S. economy. Applications for jobless benefits soared in the prior week as the deadly late-season superstorm slammed into the Northeast. Claims rose a revised 90,000 to 451,000 in the prior week, up from the initial estimate of a 78,000 increase to 439,000. That was the biggest weekly rise in claims since Hurricane Katrina hit the Gulf Coast in the late summer of 2005.
There are some signs the job market is improving. Employers added 171,000 jobs in October and hiring in August and September was stronger than first estimated. The economy gained an average of 174,000 jobs a month in the July-September quarter. That's up from 67,000 a month in April through June.
China's vast manufacturing sector saw expansion accelerate in November for the first time in 13 months, preliminary results from a factory survey showed, a sign that the pace of economic growth has revived after seven consecutive quarters of slowdown. |
|
| |
|
|
|
|
|
|
|
|
|
|
|
|
|
|
|
|
|
|
|
|
|
|
|
|
|
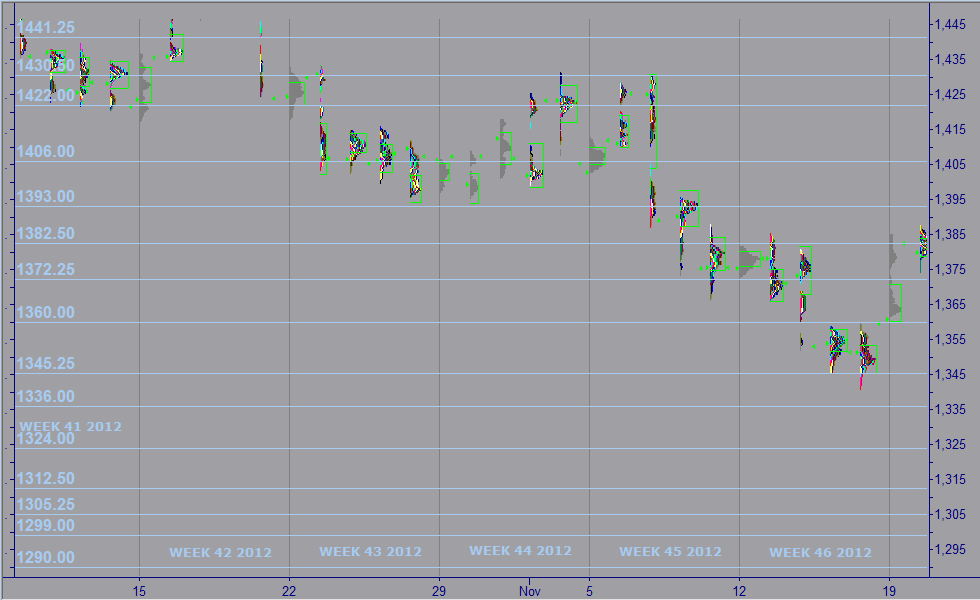
| MARKET PROFILE |
 |
WEEKS 2012 |
WEEK 47 |
% FROM CLOSE |
% FROM OPEN |
 |
RESISTANCE 1 |
1,330.25 |
1.39% |
1.35% |
|
RESISTANCE 2 |
1,326.25 |
1.08% |
1.04% |
 |
CLOSE MAR 02 |
1,350.00 |
|
|
|
OPEN MAR 04 |
1,255.00 |
0.04% |
|
 |
SUPPORT 1 |
1,289.00 |
0.66% |
0.62% |
|
SUPPORT 2 |
1,283.50 |
0.08% |
0.04% |
|
|
|
|
|
|
|
|
|
| |
|
|
|
|
|
| |
|
|
|
|
|
|
IMPORTANT NOTE: In an effort to comply with all applicable rules, regulations and disclosures please be so kind and read the "General Disclosure" below: |
| |
|
|
|
|
| GENERAL DISCLOSURE - TRADINGVESTING.COM |
- The material contained on our Website and Economic Calendar must be used at your own risk. Material is believed to be reliable, but we do not guarantee its accuracy or validity, nor is Tradingvesting.com responsible for any errors or omissions which may occur. The analysis and/or recommendations made by Tradingvesting.com do not provide, imply, or otherwise constitute a guarantee of performance. All contents and recommendations are based on data and sources believed to be reliable, but accuracy and completeness cannot be guaranteed. It should not be assumed that future results will be profitable or will equal past performance, real, indicated or implied.Tradingvesting.com website and material contained therein is not a solicitation to participate in the Futures/Stocks/Options Market. This Economic Calendar does not include Earning Releases, Announced Stock Splits, Upcoming Initial Public Offerings with Underwritings or Rating Changes. Tradingvesting.com has attempted to verify the information contained in this calendar. However, any aspect of such info may change without notice. Unless indicated otherwise: economic data is from the U.S and intraday data is at least 20 minutes delayed; all prices are in the local currency; Time is U.S. Eastern Time. Furthermore, there is a very high degree of risk involved in trading.Tradingvesting.com assumes no responsibilities for your trading and investment results, please red our Risk Disclosure.
- Tradingvesting.com does not provide investment advice, and does not represent that any of the information or related analysis is accurate or complete at any time. All information on this website are for educational purposes only and are not intended to provide financial advice. Any statements about profits or income, expressed or implied, do not represent a guarantee. Your actual trading may result in losses as no trading system is guaranteed. You accept full responsibilities for your actions, trades, profit or loss, and agree to hold Tradingvesting.com and any authorized distributors of this information harmless in any and all ways. We respect your right to privacy, please click here to view our privacy policy.
- U.S. Government Required Disclaimer - Commodity Futures Trading Commission.
Futures and options trading has large potential rewards, but also large potential risk. You must be aware of the risks and be willing to accept them in order to invest in the futures and options markets. Don't trade with money you can't afford to lose. This website is neither a solicitation nor an offer to Buy/Sell futures or options. No representation is being made that any account will or is likely to achieve profits or losses similar to those discussed on this website. The past performance of any trading system or methodology is not necessarily indicative of future results.
- CFTC rule 4.41:Hypothetical or simulated performance results have certain limitations. Unlike an actual performance record, simulated results do not represent actual trading. Also, since the trades have not been executed, the results may have under-or-over compensated for the impact, if any, of certain market factors, such as lack of liquidity. Simulated trading programs in general are also subject to the fact that they are designed with the benefit of hindsight. No representation is being made that any account will or is likely to achieve profit or losses similar to those shown.
- Risk Warning: Trading foreign exchange on margin carries a high level of risk, and may not be suitable for all investors. The high degree of leverage can work against you as well as for you. Before deciding to invest in foreign exchange you should carefully consider your investment objectives, level of experience, and risk appetite. The possibility exists that you could sustain a loss of some or all of your initial investment and therefore you should not invest money that you cannot afford to lose. You should be aware of all the risks associated with foreign exchange trading, and seek advice from an independent financial advisor if you have any doubts. Our linking to these sites does not constitute an endorsement of any products, services or the information found on them. Once you link to another site you are subject to the policies of the new site. By using this site, you agree to the Terms of Service, Privacy Policy and Risk Disclosure. Copyright � 2012 Tradingvesting, LLC. All rights reserved. If you have any questions regarding the Online Economic Calendar application, please contact us: click here.
THIS BRIEF STATEMENT CANNOT, OF COURSE, DISCLOSE ALL THE RISKS AND OTHER ASPECTS OF THE COMMODITY MARKETS AND EQUITY MARKETS. PLEASE READ MORE AT: TERMS OF SERVICE.
|
|
|
| |
|
|
|
|
| |
|
|
|
|
|
| |
|
|
|
|
|