 |
 |
|
 |
Factory Orders | Manufacturing |
|
 |
|
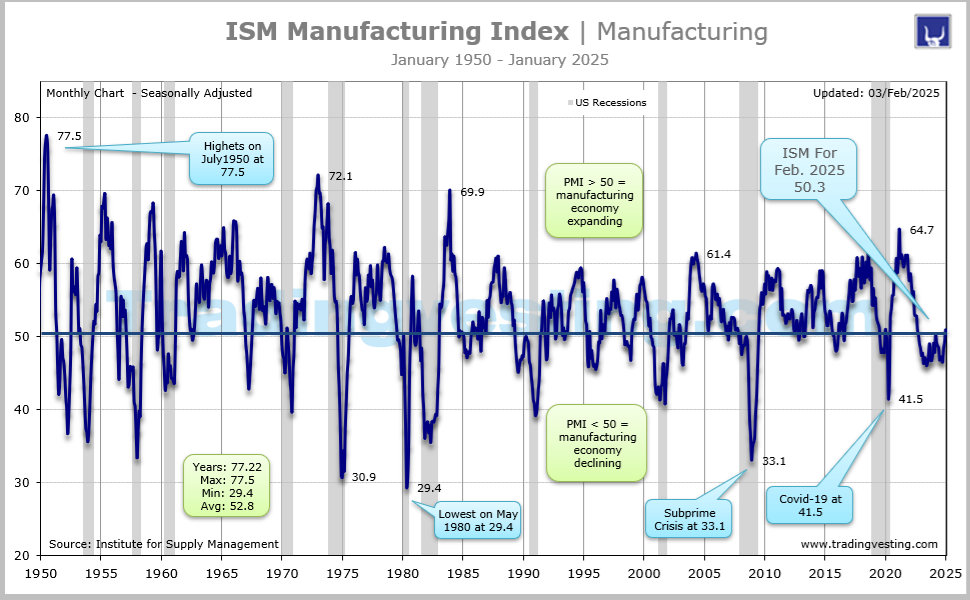
The Factory Orders measures dollar volume of new orders, shipments, unfilled orders, and inventories reported by domestic manufacturers. It measures the change in the total value of new purchase orders placed with manufacturers.. Read More...
|
|
|
|
|
|
|
| |
|
| |
 1. ISM Manufacturing Index (1 of 9) 1. ISM Manufacturing Index (1 of 9)2. Industrial Production (2 of 9)
 3. Durable Goods Orders (3 of 9) 3. Durable Goods Orders (3 of 9)4. Factory Orders (4 of 9)
 5. Empire State Mafg Index (5 of 9) 5. Empire State Mafg Index (5 of 9) 6. PMI Mfg Final (6 of 9) 6. PMI Mfg Final (6 of 9) 7. PMI Composite Flash (7 of 9) 7. PMI Composite Flash (7 of 9) 8. Chicago PMI (8 of 9) 8. Chicago PMI (8 of 9) 9. Philadelphia Mfg Index (9 of 9) 9. Philadelphia Mfg Index (9 of 9)
|
 |
|
|
|
|
| |
|
→ Big Chart |
|
→ Release |
|
| |
|
|
|
|
|
|
|
|
|
|
|
|
|
|
|
|
|
|
|
 |
|
Big Chart | Large Data |
 |
|
Factory Orders | Manufacturing |
|
Today's Week |
 |
|
|
|
|
|
|
|
|
|
|
|
|
|
| |
|
|
|
|
|
|
|
|
|
|
|
|
|
| |
|
|
|
|
|
|
|
|
|
|
|
|
|
|
|
|
|
|
|
|
|
Release Schedule | 2026 |
|
|
Factory Orders | Manufacturing |
|
Today's Week |
|
|
|
|
|
|
|
|
|
|
|
|
|
Factory Orders
(At 10:00 a.m ET)
| SCHEDULE 2026 |
No 1 |
No 2 |
No 3 |
No 4 |
No 5 |
No 6 |
No 7 |
No 8 |
No 9 |
No 10 |
No 11 |
No 12 |
| Release | Week |
|
|
|
|
|
|
|
|
|
|
|
|
| Release | Date |
|
|
|
|
|
|
|
|
|
|
|
|
| Release | Day |
|
|
|
|
|
|
|
|
|
|
|
|
 |
|
|
|
|
|
|
|
|
|
|
|
|
| Prior |
-1.3% |
2.7% |
-2.7% |
0.1% |
0.0% |
1.5% |
... |
... |
... |
... |
... |
... |
| Prior Revised |
-1.2% |
... |
-0.4% |
0.0% |
0.3% |
1.8% |
... |
... |
... |
... |
... |
... |
| CONSENSUS |
1.3% |
-0.7% |
0.1% |
0.4% |
0.5% |
4.3% |
... |
... |
... |
... |
... |
... |
| Consensus Low |
0.4% |
-1.5% |
-0.6% |
-0.2% |
-0.1% |
0.3% |
... |
... |
... |
... |
... |
... |
| Consensus High |
2.1% |
1.0% |
0.9% |
0.5% |
1.0% |
5.5% |
... |
... |
... |
... |
... |
... |
| FACTORY M/M |
2.7% |
-0.7% |
0.1% |
0.0% |
1.5% |
4.8% |
... |
... |
... |
... |
... |
... |
| RATING |
|
|
|
|
|
|
|
|
|
|
|
|
| Release For |
Nov-25 |
Dec-25 |
Jan-26 |
Feb-26 |
Mar-26 |
Apr-26 |
May-26 |
Jun-26 |
Jul-26 |
Aug-26 |
Sep-26 |
Oct-26 |
|
|
|
|
|
|
|
|
|
|
|
|
|
|
|
| |
|
| |
|
|
|
|
|
|
|
|
|
|
|
Release Schedule | 2025 |
|
|
Factory Orders | Manufacturing |
|
Today's Week |
|
|
|
|
|
|
|
|
|
|
|
|
|
Factory Orders
(At 10:00 a.m ET)
| SCHEDULE 2025 |
No 1 |
No 2 |
No 3 |
No 4 |
No 5 |
No 6 |
No 7 |
No 8 |
No 9 |
No 10 |
No 11 |
No 12 |
| Release | Week |
|
|
|
|
|
|
|
|
|
|
|
|
| Release | Date |
|
|
|
|
|
|
|
|
|
|
|
|
| Release | Day |
|
|
|
|
|
|
|
|
|
|
|
|
|
|
|
|
|
|
|
|
|
|
|
|
|
| Prior |
0.2% |
-0.4% |
-0.9% |
1.7% |
0.6% |
4.3% |
-3.7% |
8.2% |
-4.8% |
-1.3% |
-1.4% |
0.2% |
| Prior Revised |
0.5% |
-0.8% |
-0.6% |
1.8% |
0.5% |
3.4% |
-3.9% |
8.3% |
... |
... |
1.3% |
... |
| CONSENSUS |
-0.4% |
-0.6% |
1.4% |
0.5% |
4.5% |
-3.0% |
8.1% |
-5.0% |
-1.4% |
1.4% |
0.2% |
... |
| Consensus Low |
-0.7% |
-1.1% |
-0.2% |
0.1% |
0.5% |
-3.6% |
0.0% |
-6.0% |
-1.6% |
0.1% |
-1.0% |
... |
| Consensus High |
0.3% |
0.5% |
1.7% |
1.2% |
8.0% |
-2.2% |
9.5% |
-4.2% |
-1.1% |
2.5% |
1.4% |
... |
| FACTORY M/M |
-0.4% |
-0.9% |
1.7% |
0.6% |
4.3% |
-3.7% |
8.2% |
-4.8% |
-1.3% |
1.4% |
0.2% |
-1.3% |
| RATING |
|
|
|
|
|
|
|
|
|
|
|
|
| Release For |
Nov-24 |
Dec-24 |
Jan-25 |
Feb-25 |
Mar-25 |
Apr-25 |
May-25 |
Jun-25 |
Jul-25 |
Aug-25 |
Sep-25 |
Oct-25 |
|
|
|
|
|
|
|
|
|
|
|
|
|
|
|
| |
|
| |
|
|
|
|
|
|
|
|
|
|
|
Release Schedule | 2024 |
|
|
Factory Orders | Manufacturing |
|
Today's Week |
|
|
|
|
|
|
|
|
|
|
|
|
|
Factory Orders
(At 10:00 a.m ET)
| SCHEDULE 2024 |
No 1 |
No 2 |
No 3 |
No 4 |
No 5 |
No 6 |
No 7 |
No 8 |
No 9 |
No 10 |
No 11 |
No 12 |
| Release | Week |
|
|
|
|
|
|
|
|
|
|
|
|
| Release | Date |
|
|
|
|
|
|
|
|
|
|
|
|
| Release | Day |
|
|
|
|
|
|
|
|
|
|
|
|
|
|
|
|
|
|
|
|
|
|
|
|
|
| Prior |
-3.6% |
2.6% |
0.2% |
-3.6% |
1.4% |
1.6% |
0.7% |
-0.5% |
-3.3% |
5.0% |
-0.2% |
-0.5% |
| Prior Revised |
-3.4% |
No |
-0.3% |
-3.8% |
1.2% |
0.7% |
0.4% |
No |
No |
4.9% |
-0.8% |
-0.2% |
| CONSENSUS |
2.0% |
0.4% |
-3.0% |
1.0% |
1.6% |
0.7% |
0.2% |
3.0% |
4.6% |
0.2% |
-0.5% |
0.4% |
| Consensus Low |
1.1% |
-0.4% |
-4.9% |
0.7% |
1.1% |
0.3% |
-0.8% |
-3.6% |
-1.8% |
-3.2% |
-0.9% |
-0.2% |
| Consensus High |
5.3% |
0.6% |
-2.0% |
1.6% |
2.0% |
0.8% |
0.4% |
0.5% |
5.2% |
0.6% |
-0.3% |
1.3% |
| FACTORY M/M |
2.6% |
0.2% |
-3.6% |
1.4% |
1.6% |
0.7% |
-0.5% |
-3.3% |
5.0% |
-0.2% |
-0.5% |
0.2% |
| RATING |
|
|
|
|
|
|
|
|
|
|
|
|
| Release For |
Nov-23 |
Dec-23 |
Jan-24 |
Feb-24 |
Mar-24 |
Apr-24 |
May-24 |
Jun-24 |
Jul-24 |
Aug-24 |
Sep-24 |
Oct-24 |
|
|
|
|
|
|
|
|
|
|
|
|
|
|
|
| |
|
| |
|
|
|
|
|
|
|
|
|
|
|
Release Schedule | 2023 |
|
|
Factory Orders | Manufacturing |
|
Today's Week |
|
|
|
|
|
|
|
|
|
|
|
|
|
Factory Orders
(At 10:00 a.m ET)
| SCHEDULE 2023 |
No 1 |
No 2 |
No 3 |
No 4 |
No 5 |
No 6 |
No 7 |
No 8 |
No 9 |
No 10 |
No 11 |
No 12 |
| Released Week: |
|
|
|
|
|
|
|
|
|
|
|
|
| Released Date: |
|
|
|
|
|
|
|
|
|
|
|
|
| Released Day: |
|
|
|
|
|
|
|
|
|
|
|
|
|
|
|
|
|
|
|
|
|
|
|
|
|
| Prior |
1.0% |
-1.8% |
1.8% |
-1.6% |
-0.7% |
0.9% |
0.4% |
0.3% |
2.3% |
-2.1% |
1.2% |
2.8% |
| Prior Revised |
0.4% |
-1.9% |
1.7% |
-2.1% |
-1.1% |
0.6% |
0.3% |
0.4% |
No |
No |
1.0% |
2.3% |
| CONSENSUS |
-0.7% |
2.2% |
-1.8% |
-0.4% |
1.3% |
0.8% |
0.9% |
1.7% |
-2.6% |
0.2% |
1.6% |
-2.6% |
| Consensus Low |
-1.6% |
0.5% |
-3.7% |
-1.0% |
-0.3% |
0.5% |
-0.5% |
-0.5% |
-5.2% |
-0.5% |
0.8% |
-3.9% |
| Consensus High |
-0.3% |
4.9% |
-1.0% |
-0.3% |
2.0% |
1.2% |
1.5% |
2.6% |
-0.1% |
2.0% |
2.9% |
-2.4% |
| FACTORY M/M |
-1.8% |
1.8% |
-1.6% |
-0.7% |
0.9% |
0.4% |
0.3% |
2.3% |
-2.1% |
1.2% |
2.8% |
-3.6% |
| RATING |
|
|
|
|
|
|
|
|
|
|
|
|
| Release For |
Nov-22 |
Dec-22 |
Jan-23 |
Feb-23 |
Mar-23 |
Apr-23 |
May-23 |
Jun-23 |
Jul-23 |
Aug-23 |
Sep-23 |
Oct-23 |
|
|
|
|
|
|
|
|
|
|
|
|
|
|
|
| |
|
| |
|
|
|
|
|
|
|
|
|
|
|
Release Schedule | 2022 |
|
|
Factory Orders | Manufacturing |
|
Today's Week |
|
|
|
|
|
|
|
|
|
|
|
|
|
Factory Orders
(At 10:00 a.m ET)
| SCHEDULE 2022 |
No 1 |
No 2 |
No 3 |
No 4 |
No 5 |
No 6 |
No 7 |
No 8 |
No 9 |
No 10 |
No 11 |
No 12 |
| Released Week: |
|
|
|
|
|
|
|
|
|
|
|
|
| Released Date: |
|
|
|
|
|
|
|
|
|
|
|
|
| Released Day: |
|
|
|
|
|
|
|
|
|
|
|
|
|
|
|
|
|
|
|
|
|
|
|
|
|
| Prior |
1.0% |
1.6% |
-0.4% |
1.4% |
-0.5% |
2.2% |
0.3% |
1.6% |
2.0% |
-1.0% |
0.0% |
0.3% |
| Prior Revised |
1.2% |
1.8% |
0.7% |
1.5% |
0.1% |
1.8% |
0.7% |
1.8% |
1.8% |
No |
0.2% |
no |
| CONSENSUS |
1.3% |
-0.2% |
0.5% |
0.6% |
1.1% |
0.8% |
0.5% |
1.1% |
0.2% |
0.2% |
0.3% |
0.7% |
| Consensus Low |
0.4% |
-0.7% |
-0.3% |
-2.0% |
0.6% |
0.0% |
0.2% |
-0.4% |
-0.8% |
-0.6% |
-0.3% |
0.1% |
| Consensus High |
2.5% |
0.5% |
1.7% |
0.8% |
1.7% |
1.3% |
0.8% |
1.9% |
0.8% |
0.5% |
0.6% |
1.0% |
| FACTORY M/M |
1.6% |
-0.4% |
1.4% |
-0.5% |
2.2% |
0.3% |
1.6% |
2.0% |
-1.0% |
0.0% |
0.3% |
1.0% |
| RATING |
|
|
|
|
|
|
|
|
|
|
|
|
| Release For |
Nov-21 |
Dec-21 |
Jan-22 |
Feb-22 |
Mar-22 |
Apr-22 |
May-22 |
Jun-22 |
Jul-22 |
Aug-22 |
Sep-22 |
Oct-22 |
|
|
|
|
|
|
|
|
|
|
|
|
|
|
|
| |
|
| |
|
|
|
|
|
|
|
|
|
|
|
Release Schedule | 2021 |
|
|
Factory Orders | Manufacturing |
|
Today's Week |
|
|
|
|
|
|
|
|
|
|
|
|
|
Factory Orders
(At 10:00 a.m ET)
| SCHEDULE 2021 |
No 1 |
No 2 |
No 3 |
No 4 |
No 5 |
No 6 |
No 7 |
No 8 |
No 9 |
No 10 |
No 11 |
No 12 |
| Released Week: |
|
|
|
|
|
|
|
|
|
|
|
|
| Released Date: |
|
|
|
|
|
|
|
|
|
|
|
|
| Released Day: |
|
|
|
|
|
|
|
|
|
|
|
|
|
|
|
|
|
|
|
|
|
|
|
|
|
| Prior |
0.3% |
1.0% |
1.1% |
2.6% |
-0.8% |
1.1% |
-0.6% |
1.7% |
1.5% |
0.4% |
1.2% |
0.2% |
| Prior Revised |
No |
-0.3% |
1.6% |
2.7% |
-0.5% |
1.4% |
-0.1% |
2.3% |
No |
0.7% |
No |
No |
| CONSENSUS |
0.3% |
0.7% |
2.0% |
-0.5% |
1.3% |
0.1% |
1.5% |
0.8% |
0.3% |
1.0% |
0.1% |
0.6% |
| Consensus Low |
-1.4% |
0.1% |
0.4% |
-1.3% |
-0.7% |
-0.9% |
0.8% |
-0.6% |
-1.2% |
0.5% |
-0.4% |
-0.4% |
| Consensus High |
0.8% |
1.8% |
3.0% |
-0.5% |
3.2% |
1.3% |
2.4% |
1.7% |
0.8% |
1.2% |
0.7% |
0.9% |
| FACTORY M/M |
1.0% |
1.1% |
2.6% |
-0.8% |
1.1% |
-0.6% |
1.7% |
1.5% |
0.4% |
1.2% |
0.2% |
1.0% |
| RATING |
|
|
|
|
|
|
|
|
|
|
|
|
| Release For |
Nov-20 |
Dec-20 |
Jan-21 |
Feb-21 |
Mar-21 |
Apr-21 |
May-21 |
Jun-21 |
Jul-21 |
Aug-21 |
Sep-21 |
Oct-21 |
|
|
|
|
|
|
|
|
|
|
|
|
|
|
|
| |
|
| |
|
Legends: |
 |
Delayed |
 |
Positive View |
 |
Negative View |
 |
Neutral View |
 |
Non Available |
|
|
|
|
|
|
|
|
|
|
|
|
|
|
|
|
|
|
|
|
| |
|
|
|
|
|
|
|
|
|
|
|
|
|
|
|
|
|
|
|
|
|
Brief News | 2026 |
|
|
Factory Orders | Manufacturing |
|
Today's Week |
|
|
|
|
|
|
|
|
|
|
|
|
|
Factory Orders (10:00 a.m ET)
| DATE/WEEK |
HIGHLIGHTS |
FOR |
ACTUAL |
|
US factory orders |
No 12 |
... |
|
Oct-2026 |
|
| |
|
|
|
US factory orders |
No 11 |
... |
|
Sep-2026 |
|
| |
|
|
|
US factory orders |
No 10 |
... |
|
Aug-2026 |
|
| |
|
|
|
US factory orders |
No 9 |
... |
|
Jul-2026 |
|
| |
|
|
|
US factory orders |
No 8 |
... |
|
Jun-2026 |
|
| |
|
|
|
US factory orders |
No 7 |
... |
|
May-2026 |
|
| |
|
|
|
US factory orders |
No 6 |
... |
|
Apr-2026 |
|
| |
|
|
|
US factory orders |
No 5 |
... |
|
Mar-2026 |
|
| |
|
|
|
US factory orders |
No 4 |
... |
|
Feb-2026 |
|
| |
|
|
|
US factory orders |
No 3 |
... |
|
Jan-2026 |
|
| |
|
|
|
US factory orders |
No 2 |
... |
|
Dec-2025 |
|
| |
|
|
|
US factory orders fro Nov 2025 at 2.7%. |
No 1 |
2.7% |
|
Nov-2025 |
|
| |
|
|
|
S factory orders at -1.3% on 08 Jan 2026 for October 2025. |
No 1 |
-1.3% |
|
Oct-2025 |
|
| |
|
|
|
|
|
|
|
|
| |
|
|
|
|
|
| |
|
|
|
|
|
|
|
|
|
|
|
|
|
|
|
Brief News | 2025 |
|
|
Factory Orders | Manufacturing |
|
Today's Week |
|
|
|
|
|
|
|
|
|
|
|
|
|
Factory Orders (10:00 a.m ET)
| DATE/WEEK |
HIGHLIGHTS |
FOR |
ACTUAL |
|
US factory orders at 0.2% on 05 Dec 2025 for September 2025. Based on data from the U.S. Census Bureau and reports released around early December 2025, new orders for U.S. manufactured goods rose by 0.2% in September 2025. |
No 12 |
0.2% |
|
Sep-2025 |
|
| |
|
|
|
US factory orders at 1.4% on 18 Nov 2025 for August 2025. On November 18, 2025, the U.S. Census Bureau reported that new orders for manufactured goods rose by 1.4% in August 2025, reaching a total of $612.0 billion. This increase represented a rebound from a downwardly revised 1.3% decline in July. |
No 12 |
1.4% |
|
Aug-2025 |
|
| |
|
|
|
Factory Orders Sep. 2025: Delayed due to the government shut down, |
No 11 |
... |
|
Sep-2025 |
|
| |
|
|
|
Factory Orders Aug. 2025: Delayed due to the government shut down, |
No 10 |
... |
|
Aug-2025 |
|
| |
|
|
|
The U.S. economy continues to demonstrate resilience as the latest data on Factory Orders reveals a decline that is in line with expectations. The actual number came in at -1.3%. New orders for U.S.-manufactured goods fell in July, pulled down by weakness in commercial aircraft bookings, but businesses appeared to have maintained a strong pace of spending on equipment early in the third quarter. Factory orders decreased 1.3% after an unrevised 4.8% drop in June |
No 9 |
-1.3% |
|
Jul-2025 |
|
| |
|
|
|
Recent news on factory orders from August 4, 2025, shows that U.S. factory orders fell 4.8% in June 2025 after a surge in May, a drop largely driven by a steep decline in commercial aircraft orders. Excluding transportation, factory orders increased by 0.4% in June, and while overall durable goods orders dropped significantly, a 0.5% rise in non-durable goods orders and an increase in shipments and inventories showed some stability in the manufacturing sector. |
No 8 |
-4.8% |
|
Jun-2025 |
|
| |
|
|
|
New orders for U.S.-manufactured goods surged in May on strong demand for aircraft and business spending on equipment appeared to be strong halfway through the second quarter. Factory orders increased 8.2% after a downwardly revised 3.9% drop in April, the Commerce Department's Census Bureau said on Thursday. Economists polled by Reuters had forecast factory orders rebounding 8.2% after a previously reported 3.7% decline in April. They increased 3.2% on a year-on-year basis in May. |
No 7 |
8.2% |
|
May-2025 |
|
| |
|
|
|
New orders for U.S.-manufactured goods dropped sharply in April and business spending on equipment appeared to have lost momentum at the start of the second quarter as the boost from front-loading of purchases ahead of tariffs faded. Factory orders fell 3.7% after an unrevised 3.4% jump in March, the Commerce Department's Census Bureau said on Tuesday. Economists polled by Reuters had forecast factory orders declining 3.1%. They rose 2.0% on a year-on-year basis in April. |
No 6 |
-3.7% |
|
Apr-2025 |
|
| |
|
|
|
New orders for U.S.-manufactured goods surged in March, boosted by demand for commercial aircraft, but the momentum was expected to fizzle amid trade tensions. Factory orders increased 4.3% after a downwardly revised 0.5% rise in February, the Commerce Department's Census Bureau said on Friday. Economists polled by Reuters had forecast factory orders would surge 4.5% after a previously reported 0.6% gain in February. |
No 5 |
4.3% |
|
Mar-2025 |
|
| |
|
|
|
New orders for U.S.-manufactured goods increased solidly in February, likely as businesses front-loaded orders ahead of tariffs. Factory orders rose 0.6% after an upwardly revised 1.8% rebound in January, the Commerce Department's Census Bureau said on Wednesday. Economists polled by Reuters had forecast factory orders would climb 0.5% after a previously reported 1.7% advance in January. Factory orders gained 1.5% on a year-on-year basis in February. |
No 4 |
0.6% |
|
Feb-2025 |
|
| |
|
|
|
New orders for U.S.-manufactured goods rebounded in January amid a surge in commercial aircraft bookings, but the broader manufacturing sector's recovery is likely to be hampered by tariffs on imports. Factory orders increased 1.7% after a revised 0.6% decline in December, the Commerce Department's Census Bureau said on Wednesday. Economists polled by Reuters had forecast factory orders increasing 1.6% after a previously reported 0.9% drop in December. |
No 3 |
1.7% |
|
Jan-2025 |
|
| |
|
|
|
In December 2024, U.S. factory orders decreased by 0.9%, a decline of $5.2 billion, reaching $578.5 billion. This was the fourth decrease in the last five months. The decrease was partially attributed to a decline in civilian aircraft orders. However, other areas of manufacturing saw moderate increases, and the overall outlook for manufacturing suggests a potential for recovery. |
No 2 |
-0.9% |
|
Dec-2024 |
|
| |
|
|
|
Weak demand for aircraft weighs down US factory orders in November 2024. New orders for U.S.-manufactured goods fell in November amid weakness in demand for commercial aircraft while business spending on equipment appeared to have slowed in the fourth quarter, government data showed on Monday. Factory orders dropped 0.4% after an upwardly revised 0.5% gain in October, the Commerce Department's Census Bureau said. Economists polled by Reuters had forecast factory orders slipping 0.3% after a previously reported 0.2% rise in October. Factory orders edged up 0.1% year-on-year in November. Manufacturing accounts for 10.3% of the economy. |
No 1 |
-0.4% |
|
Nov-2024 |
|
| |
|
|
|
|
|
|
|
|
| |
|
|
|
|
|
| |
|
|
|
|
|
|
|
|
|
|
|
|
|
|
|
Brief News | 2024 |
|
|
Factory Orders | Manufacturing |
|
Today's Week |
|
|
|
|
|
|
|
|
|
|
|
|
|
Factory Orders (10:00 a.m ET)
| DATE/WEEK |
HIGHLIGHTS |
FOR |
ACTUAL |
|
New orders for U.S.-manufactured goods rebounded marginally in October while business spending on equipment appeared to have softened early in the fourth quarter. Factory orders increased 0.2% after a revised 0.2% fall in September, the Commerce Department's Census Bureau said on Wednesday. Economists polled by Reuters had forecast factory orders would rebound 0.2% after a previously reported 0.5% decline in September. Factory orders rose 0.4% on a year-on-year basis in October. The government also reported that orders for non-defense capital goods excluding aircraft, which are seen as a measure of business spending plans on equipment, fell 0.2% in October, as initially reported. Shipments of core capital goods increased 0.3% instead of rising 0.2%, as estimated last month. |
No 12 |
0.2% |
|
Oct-2024 |
|
| |
|
|
|
US factory orders fall a second straight month in September. Factory orders dropped 0.5% after a downwardly revised 0.8% decrease in August. New orders for US-manufactured goods fell for a second straight month in September, and business spending on equipment appears to have pulled back in the third quarter. Factory orders dropped 0.5 per cent after a downwardly revised 0.8 per cent decrease in August, the Commerce Department’s Census Bureau said on Monday (Nov 4). Economists polled by Reuters had forecast factory orders would fall 0.5 per cent, after a previously reported 0.2 per cent decline in August. Factory orders were unchanged from a year earlier. |
No 11 |
-0.5% |
|
Sep-2024 |
|
| |
|
|
|
US factory orders fall by 0.2% in August 2024. Factory orders in the United States were down by 0.2% in August compared to the previous month, landing at $590.4 billion, a new report by the Census Bureau said on Thursday. New orders for manufactured durable goods remained stable at $289.6 billion, while manufactured nondurable goods orders dropped 0.5% to $300.8 billion. Shipments declined by 0.5% month-on-month to $590.1 billion, while unfilled orders rose by 0.4% to $1,391.4 billion. Inventories grew by 0.1% to $860.2 billion, with the inventories-to-shipments ratio at 1.46, up from 1.45 in July. |
No 10 |
-0.2% |
|
Aug-2024 |
|
| |
|
|
|
Factory orders rise in July after two months of weakness. Orders rise 5%, but excluding transportation were up a slight 0.4%. Orders for U.S. manufactured goods rose 5% in July, the Commerce Department said Wednesday. The gain follows two straight monthly declines. The rise in factory orders in July was in line with the consensus forecast of economists surveyed by the Wall Street Journal. |
No 9 |
5.0% |
|
Jul-2024 |
|
| |
|
|
|
US factory orders fall more than expected in June 2024. New orders for U.S.-manufactured goods fell more than expected in June, but business spending on equipment was solid as was initially estimated, government data showed on Friday. Factory orders dropped 3.3% after slipping 0.5% in May, the Commerce Department's Census Bureau said. Economists polled by Reuters had forecast factory orders falling 2.9%. The government also reported that orders for non-defense capital goods excluding aircraft, which are seen as a measure of business spending plans on equipment increased 0.9% in June, slightly revised down from the 1.0% reported last month. |
No 8 |
-3.3% |
|
Jun-2024 |
|
| |
|
|
|
New orders for U.S.-manufactured goods unexpectedly fell in May, while business spending on equipment appeared weaker than initially thought, government data showed on Wednesday. Factory orders dropped 0.5% after rising 0.4% in April, the Commerce Department's Census Bureau said. Economists polled by Reuters had forecast factory orders would gain 0.2%. Manufacturing, which accounts for 10.3% of the U.S. economy, is under pressure from higher interest rates and softening demand for goods.US factory orders unexpectedly fall in May. |
No 7 |
-0.5% |
|
May-2024 |
|
| |
|
|
|
US factory orders increased 0.7% in April, in line with market estimates, according to Commerce Department figures released Tuesday. New orders for manufactured goods, which measure the change in the value of new purchase orders placed with manufacturers, climbed $4.3 billion to reach $588.2 billion, rising for three consecutive months. The figure in March was revised down from a gain of 1.6% to an increase of 0.7% to stand at $584 billion.New orders for manufactured durable goods in April rose $1.8 billion, or 0.6%, to $283.9 billion – also up for three consecutive months. Transportation equipment led the increase with a gain of $1 billion, or 1.1%, to reach $96 billion. New orders for manufactured nondurable goods increased $2.4 billion, or 0.8%, to $304.3 billion. |
No 6 |
0.7% |
|
Apr-2024 |
|
| |
|
|
|
Commercial aircraft, motor vehicles lift US factory orders. New orders for U.S.-manufactured goods increased solidly in March, boosted by demand for commercial aircraft and motor vehicles, but gains elsewhere were moderate. Factory orders rose 1.6% after gaining 1.2% in February, the Commerce Department's Census Bureau said on Thursday. The increase in orders was in line with economists' expectations. Orders gained 0.3% year-on-year in March. Excluding transportation, orders increased 0.5% in March. |
No 5 |
1.6% |
|
Mar-2024 |
|
| |
|
|
|
US factory orders increase solidly in February. New orders for U.S.-manufactured goods rebounded more than expected in February, boosted by demand for machinery and commercial aircraft as manufacturing regains its footing. Factory orders increased 1.4% after dropping 3.8% in January, the Commerce Department's Census Bureau said on Tuesday. Economists polled by Reuters had forecast orders rebounding 1.0%. They rose 1.0% year-on-year in February. |
No 4 |
1.4% |
|
Feb-2024 |
|
| |
|
|
|
US factory orders fall more than expected in January. New orders for U.S.-manufactured goods dropped more than expected in January, pulled down by a sharp decline in bookings for commercial aircraft, but demand for computers and electronic products accelerated. Factory orders fell 3.6% after slipping 0.3% in December, the Commerce Department's Census Bureau said on Tuesday. Economists polled by Reuters had forecast orders declining 2.9%. They decreased 1.6% year-on-year in January. |
No 3 |
-3.6% |
|
Jan-2024 |
|
| |
|
|
|
US factory orders rise moderately in December. New orders for U.S.-made goods rose just moderately in December, but a pick up is likely in the months ahead as unfilled orders continued to pile up. Factory orders gained 0.2% after rebounding 2.6% in November, the Commerce Department's Census Bureau said on Friday. The increase was in line with economists' expectations. Orders increased 0.8% on a year-on-year basis in December. Manufacturing, which accounts for 10.3% of the economy, is being constrained by high interest rates. The outlook is, however, promising. |
No 2 |
0.2% |
|
Dec-2023 |
|
| |
|
|
|
US factory orders rose 2.6% in November, coming higher than market estimates, and partially recovering from the steep decline in October, according to Commerce Department figures released Friday. New orders for manufactured goods increased $14.9 billion to $592.9 billion, up for the third time in the last four months. The expectation for the figure, which measures the change in the value of new purchase orders placed with manufacturers, was to show an increase of 2.1%. |
No 1 |
2.6% |
|
Nov-2023 |
|
| |
|
|
|
|
|
|
|
|
|
| |
|
|
|
|
|
| |
|
|
|
|
|
|
|
|
|
|
|
|
|
|
|
Brief News | 2023 |
|
|
Factory Orders | Manufacturing |
|
Today's Week |
|
|
|
|
|
|
|
|
|
|
|
|
|
Factory Orders (10:00)
| DATE/WEEK |
HIGHLIGHTS |
FOR |
ACTUAL |
|
US factory orders fall 3.6% in October. New orders for U.S.-made goods fell more than expected in October, marking the biggest monthly drop in roughly three and a half years, constrained by weakening demand for durable goods and transportation equipment and bolstering the view that high interest rates are beginning to bite into spending. Factory orders fell 3.6% after a downwardly revised 2.3% in Sep. |
No 12 |
-3.6% |
|
Oct-2023 |
|
| |
|
|
|
U.S. Factory Orders Surge More Than Expected In September. Reflecting a surge in orders for durable goods, the Commerce Department released a report on Thursday showing new orders for U.S. manufactured goods jumped by more than expected in the month of September. The Commerce Department said factory orders shot up by 2.8 percent after climbing by a downwardly revised 1.0 percent in August. Economists had expected factory orders to jump by 2.3 percent compared to the 1.2 percent jump originally reported for the previous month. |
No 11 |
2.8% |
|
Sep-2023 |
|
| |
|
|
|
US factory orders beat expectations in August. New orders for U.S.-made goods increased more than expected in August and shipments accelerated, supporting views that economic growth strengthened in the third quarter. Factory orders rebounded 1.2% after falling 2.1% in July, the Commerce Department said on Wednesday. Economists polled by Reuters had forecast orders gaining 0.2%. Orders rose 0.5% on a year-on-year basis in August. Manufacturing, which accounts for 11.1% of the economy, continues to plod along despite 525 basis points in rate hikes from the Federal Reserve since March 2022. |
No 10 |
1.2% |
|
Aug-2023 |
|
| |
|
|
|
The Commerce Department reported Tuesday that factory orders for U.S.-manufactured goods dropped 2.1% in July, the first decline in four straight months. Manufacturing is a part of the economy that has been relatively constrained this year as consumers have shifted some of their spending from stuff to travel and other services. Orders for durable goods — those long-lasting big pieces of machinery like cars, appliances and factory equipment — are often looked to as a bellwether for consumer demand. And those fell by 5.2% in July. While it’s a pretty dramatic decline, there is a big caveat. |
No 9 |
-2.1% |
|
Jul-2023 |
|
| |
|
|
|
US factory orders jumped 2.3% in June, higher than estimates, according to Commerce Department figures released Thursday. New orders for manufactured goods increased $13.4 billion to $592 billion, rising for the sixth time in the last seven months. Expectations for the figure, which measures the change in the value of new purchase orders placed with manufacturers, was to show a gain of 2.2%. The figure for May was revised up from a rise of 0.3% to an increase of 0.4%, while it stood at $578.6 billion that month. New orders for manufactured durable goods in June increased $13.2 billion, or 4.6%, to $302.1 billion, up for four consecutive months. The figure in May posted a gain of 2%, revised up from the previous figure of an increase of 1.8%. Transportation equipment led the increase with a gain of $12.3 billion, or 12%, to reach $115.2 billion. |
No 8 |
2.3% |
|
Jun-2023 |
|
| |
|
|
|
U.S. factory orders miss expectations in May. New orders for U.S.-made goods increased less than expected in May as a surge in civilian aircraft orders was partially offset by sluggishness elsewhere amid higher interest rates that are eroding demand. Factory orders rose 0.3% after advancing by the same margin in April, the Commerce Department said on Wednesday. Economists polled by Reuters had forecast orders rising 0.8%. Orders increased 1.1% through May from a year earlier. |
No 7 |
0.3% |
|
May-2023 |
|
| |
|
|
|
U.S. Factory Orders Rise for the Second Straight Month but missed expectations, in AprilTotal factory orders increased 0.4% m/m (0.2% y/y) in April after a 0.6% gain in March (+0.9% originally) and a 1.7% drop in February, according to the U.S. Census Bureau. A 0.8% m/m April increase had been expected in the Action Economics Forecast Survey. The April m/m rise was the second successive monthly gain and the third in five months. Factory orders excluding the transportation sector fell 0.2% (-2.2% y/y), the fifth m/m fall in six months, on top of a 1.0% March decline. |
No 6 |
0.4% |
|
Apr-2023 |
|
| |
|
|
|
U.S. factory orders for March climbed 0.9 percent on hefty orders for commercial aircraft, it was expected a 1.3% increase, according to data released by the Commerce Department on Tuesday. The jump came on the heels of two consecutive months of declines and missed economists' expectations of a 1.2 percent increase. Stripping out orders for transportation, factory orders dropped 0.7 percent. New orders for manufactured goods in March increased by 4.9 billion U.S. dollars to 539.0 billion dollars. Orders for manufactured durable goods saw a 3.2 percent uptick in March to 276.2 billion dollars, and shipments of manufactured durable goods increased by 1.1 percent to 277.1 billion dollars. |
No 5 |
0.9% |
|
Mar-2023 |
|
| |
|
|
|
U.S. Factory Orders Dropped 0.7% in February Month-to-Month. It followed a 2.1% revised decrease in January. New orders for manufactured goods totaled $536.4 billion in February 2023, down 0.7% from January 2023, according to data provided by the U.S. Census Bureau on April 4. The drop in factory orders, which are now down three of the past four months, follows a 2.1% decrease in January. |
No 4 |
-0.7% |
|
Feb-2023 |
|
| |
|
|
|
US factory orders down 1.6% in January. New orders for manufactured goods in the United States stood at $542.8 billion in January 2023, representing a decrease of 1.6% on a monthly basis, the US Census Bureau announced in a full report on Monday. Shipments were $100 million lower month-on-month and landed at $277.4 billion, while unfilled orders grew by $300 million to $1.16 trillion. Inventories amounted to $493.3 billion following a 0.1% decline in January 2023. The inventories-to-shipments ratio was 1.48, down compared to 1.49 from the previous month. |
No 3 |
-1.6% |
|
Jan-2023 |
|
| |
|
|
|
This report is mixed and if not for aircraft would be weak. The headline gain was a bit below expectations of 2.2%.Driven by aircraft, factory orders rose 1.8 percent in December, it was expected an increase of 2.2% with the second estimate for the durables half of this report unchanged from the first estimate's 5.6 percent surge. The first estiamte for nondurables is a fall of 1.9 percent, reflecting easing price pressues for oil-related goods. |
No 2 |
1.8% |
|
Dec-2022 |
|
| |
|
|
|
New orders for U.S.-manufactured goods fell more than expected in November 2022 amid a sharp decline in bookings for aircraft, while higher borrowing costs cooled demand for other goods. The Commerce Department said on Friday that factory orders dropped 1.8% after gaining 0.4% in October. Economists polled by Reuters had forecast orders falling 0.8%. Orders increased 12.2% on a year-on-year basis in November. The Federal Reserve's fastest interest rate-hiking cycle since the 1980s as it battles inflation is slowing demand for goods, which are typically bought on credit. Americans are also shifting spending away from goods to services as the nation moves to a post-pandemic era. The plunge in factory orders was driven by a 6.3% drop in bookings for transportation equipment, which followed a 1.9% increase in October. Transportation equipment orders were weighed down by a 36.4% tumble in orders for civilian aircraft.Orders for defense aircraft fell 8.6%. Motor vehicle orders rose 0.6%. There were moderate gains in orders for machinery, computers and electronic products as well as electrical equipment, appliances and components |
No 1 |
-1.8% |
|
Nov-2022 |
|
| |
|
|
|
|
|
|
|
|
| |
|
|
|
|
|
| |
|
|
|
|
|
|
|
|
|
|
|
|
|
|
|
Brief News | 2022 |
|
|
Factory Orders | Manufacturing |
|
Today's Week |
|
|
|
|
|
|
|
|
|
|
|
|
|
Factory Orders (10:00)
| DATE/WEEK |
HIGHLIGHTS |
FOR |
ACTUAL |
|
U.S. factory orders beat expectations in October. New orders for U.S.-manufactured goods increased more than expected in October amid strong gains in demand for machinery and a range of other goods, which could allay concerns of a sharp slowdown in manufacturing. The Commerce Department said on Monday that factory orders jumped 1.0% after rising 0.3% in September. Economists polled by Reuters had forecast orders advancing 0.7%. Orders shot up 12.8% on a year-on-year basis in October. |
No 12 |
1.0% |
|
Oct-2022 |
|
| |
|
|
|
U.S. factory orders rise moderately in September. New orders for U.S.-manufactured goods increased moderately in September as a surge in bookings for civilian aircraft was partially offset by declines elsewhere, suggesting a loss of momentum in manufacturing amid rapidly rising borrowing costs. The Commerce Department said on Thursday that factory orders rose 0.3% after gaining 0.2% in August. September’s increase was in line with economists’ expectations. Orders advanced 13.0% on a year-on-year basis in September. Demand for goods is slowing also as spending rotates back to services. |
No 11 |
0.3% |
|
Sep-2022 |
|
| |
|
|
|
U.S. factory orders flat in August, as expansion in the manufacturing sector slows. Orders for manufactured goods were flat in August, the Commerce Department said Tuesday. The unchanged reading was in line with forecasts of economists surveyed by the Wall Street Journal. |
No 10 |
0.0% |
|
Aug-2022 |
|
| |
|
|
|
New orders for U.S.-manufactured goods unexpectedly fell in July, weighed down by a plunge in defense aircraft bookings, but the overall manufacturing industry remains resilient. The Commerce Department said on Friday that factory orders dropped 1.0% in July after increasing 1.8% in June. Economists polled by Reuters had forecast factory orders would increase 0.2%. Orders increased 13.4% on a year-on-year basis in July. The Institute for Supply Management said on Thursday manufacturing grew steadily in August as employment and new orders rebounded. July's factory orders were mixed. Orders for computers and electronic products increased 0.8%. Orders for electrical equipment, appliances and components fell 1.2%. There was also 0.7% drop in orders for transportation equipment, which reflected a 49.7% plunge in orders for defense aircraft and parts. Orders for machinery rose as did those for fabricated metal products. |
No 9 |
-1.0% |
|
Jul-2022 |
|
| |
|
|
|
Orders rose 2.0% on a month-on-month basis in June 2022. It was expected a 1.1% increase. Manufacturing, which accounts for 11.1% of the economy, continues to plod along despite 525 basis points in rate hikes from the Federal Reserve since March 2022. |
No 8 |
2.0% |
|
Jun-2022 |
|
| |
|
|
|
ew orders for U.S.-manufactured goods increased more than expected in May, bucking a slew of recent data showing a softening in the economy and underscoring that demand for products remains strong even as the Federal Reserve aggressively tightens financial conditions. The Commerce Department said on Tuesday that factory orders rose 1.6% in May after advancing 0.7% in April. Economists polled by Reuters had forecast factory orders would rise 0.5%. Other indicators have shown less resilience. A survey on Friday showed the Institute for Supply Management's national factory activity index contracted for a second straight month, though an "overwhelming majority" of companies indicated they were hiring. That followed moderate consumer spending growth in May along with weak housing starts, building permits and factory production. Manufacturing accounts for 12% of the U.S. economy and is being held up by strong demand for goods even as overall spending rotates more toward the services sector. The U.S central bank is seeking to cool demand across the economy as it tries to tamp down high inflation. |
No 7 |
1.6% |
|
May-2022 |
|
| |
|
|
|
New orders for U.S.-manufactured goods increased less than expected in April, but demand for products remains strong, which should help to keep factories humming. The Commerce Department said on Thursday that factory orders rose 0.3% in April after advancing 1.8% in March. Economists polled by Reuters had forecast factory orders would rise 0.7%. Manufacturing, which accounts for 12% of the U.S. economy, is being pinned by still strong demand for goods even as spending shifts back to services. A survey on Wednesday showed. the Institute for Supply Management’s national factory activity index rebounded in May after two straight monthly declines. But China’s zero COVID-19 policy and Russia’s dragging war against Ukraine could slow the improvement in supply chains. In April, there were increases in orders for machinery motor vehicles and primary metals. But orders for electrical equipment, appliances and components fell 0.2%. Orders for computers and electronic products edged up 0.1%. |
No 6 |
0.3% |
|
Apr-2022 |
|
| |
|
|
|
Rise in U.S. factory orders beats expectations in March 2022. New orders for U.S.-made goods increased more than expected in March and shipments rose solidly, but supply constraints following new COVID-19 lockdowns in China could slow manufacturing activity in the months ahead. The Commerce Department said on Tuesday that factory orders rose 2.2% in March after edging up 0.1% in February. Economists polled by Reuters had forecast factory orders would rise 1.1%. |
No 5 |
2.2% |
|
Mar-2022 |
|
| |
|
|
|
U.S. factory orders fell for the first time in 10 months. Orders for manufactured goods fell 0.5% in February 2022, the Commerce Department said Monday. Economists surveyed by the Wall Street Journal were expecting a 0.6% decline. This is the first decline in factory orders following nine consecutive monthly increases. The factory sector has been a bright spot during the pandemic even with supply-chain woes. Economists are seeing signs that demand in the sector could be weakening. Durable-goods orders fell a revised 2.1% in February, slightly better than the initial estimate of a 2.2% decrease. Orders for nondurable goods were up 1.2% in the month. The closely-watched orders for nondefense capital goods, excluding aircraft , fell a revised 0.2% in February, up slightly from the prior reading of a 0.3% fall. |
|
-0.5% |
|
Feb-2022 |
|
| |
|
|
|
U.S. factory orders growth beats expectations in January 2022. New orders for U.S.-made goods increased more than expected in January, pointing to continued strength in manufacturing despite supply challenges. The Commerce Department said on Thursday that factory orders rose 1.4% in January. Data for December was revised sharply higher to show orders gaining 0.7% instead of falling 0.4% as previously reported. Economists polled by Reuters had forecast factory orders would rebound 0.7%. Manufacturing, which accounts for 11.9% of the economy, is being underpinned by businesses rebuilding inventories, though tight supply chains remain a constraint. |
No 3 |
1.4% |
|
Jan-2022 |
|
| |
|
|
|
U.S. factory orders fall in December 2021; shipments rise further. New orders for U.S.-made goods fell slightly more than expected in December, but manufacturing remains supported by businesses replenishing inventories. The Commerce Department said on Thursday that factory orders decreased 0.4% in December 2021. Data for November was revised higher to show orders increasing 1.8% instead of 1.6% as previously reported. Economists polled by Reuters had forecast factory orders slipping 0.2%. Orders increased 16.9% in 2021. Manufacturing, which accounts for 11.9% of the economy, is being underpinned by businesses rebuilding inventories. |
No 2 |
-0.4% |
|
Dec-2021 |
|
| |
|
|
|
New orders for U.S.-manufactured goods accelerated in November 2021 but business spending on equipment likely struggled to rebound in the fourth quarter.The Commerce Department said on Thursday that factory orders rose 1.6% in November. Data for October was revised higher to show orders rising 1.2% instead of 1.0% as previously reported.Economists polled by Reuters had forecast factory orders advancing 1.5%. Orders increased 12.9% on a year-on-year basis.Manufacturing, which accounts for 11.9% of the economy, is being supported by businesses replenishing depleted inventories. |
No 1 |
1.6% |
|
Nov-2021 |
|
| |
|
|
|
|
|
|
|
|
| |
|
|
|
|
|
| |
|
|
|
|
|
|
|
|
|
|
|
|
|
|
|
Brief News | 2021 |
|
|
Factory Orders | Manufacturing |
|
Today's Week |
|
|
|
|
|
|
|
|
|
|
|
|
|
Factory Orders (10:00)
| DATE/WEEK |
HIGHLIGHTS |
FOR |
ACTUAL |
|
New orders for U.S.-made goods increased more than expected in October and businesses spending on equipment appeared to rebound after declining in the third quarter. The Commerce Department said on Friday that factory orders increased 1.0% in October. Data for September was revised higher to show orders gaining 0.5% instead of 0.2% as previously reported. Economists polled by Reuters had forecast factory orders rising 0.5%. |
No 12 |
1.0% |
|
Oct-2021 |
|
| |
|
|
|
New orders for U.S.-made goods unexpectedly rose in September, though manufacturing remains constrained by input shortages. The Commerce Department said on Wednesday that factory orders increased 0.2% in September. Data for August was revised down to show orders rising 1.0% instead of 1.2% as previously reported. Economists polled by Reuters had forecast factory orders unchanged. Orders gained 17.6% on a year-on-year basis. |
No 11 |
0.2% |
|
Sep-2021 |
|
| |
|
|
|
New orders for U.S.-made goods accelerated in August, pointing to sustained strength in manufacturing even as economic growth appeared to have slowed in the third quarter because of shortages of raw materials and labor. The Commerce Department said on Monday that factory orders increased 1.2% in August. Data for July was revised higher to show orders rising 0.7% instead of gaining 0.4% as previously reported. Orders have now increased for four straight months. Economists polled by Reuters had forecast factory orders gaining 1.0%. Orders shot up 18.0% on a year-on-year basis. |
No 10 |
1.2% |
|
Aug-2021 |
|
| |
|
|
|
New orders for manufactured goods in July, up fourteen of the last fifteen months, increased $1.9 billion or 0.4% to $508.1 billion, according to the U.S. Census Bureau. This followed a 1.5% June increase. Shipments led the increase 1.6% to $508.5 billion. New orders for manufactured durable goods in July, down following two consecutive monthly increases, decreased $0.3 billion or 0.1% to $257.4 billion, unchanged from the prior published decrease. Shipments of manufactured durable goods in July, up four of the last five months, increased 2.2% or $5.6 billion to $257.8 billion, unchanged from the previously published increase. Inventories of manufactured durable goods in July, up six consecutive months, increased 0.6% or $2.8 billion to $453.7 billion, unchanged from the previous month. |
No 9 |
0.4% |
|
Jul-2021 |
|
| |
|
|
|
New orders for U.S.-made goods increased more than expected in June, while business spending on equipment was solid, pointing to sustained strength in manufacturing even as spending is shifting away from goods to services. The Commerce Department said on Tuesday that factory orders rose 1.5% in June after advancing 2.3% in May. Economists polled by Reuters had forecast factory orders increasing 1.0%. Orders soared 18.4% on a year-on-year basis. |
No 8 |
1.5% |
|
Jun-2021 |
|
| |
|
|
|
New orders for U.S.-made goods rebounded sharply in May, while business spending on equipment remained solid, despite bottlenecks in the supply chain. The Commerce Department said on Friday that factory orders surged 1.7% in May after slipping 0.1% in April. Economists polled by Reuters had forecast factory orders rebounding 1.6%. Orders increased 17.2% on a year-on-year basis. Manufacturing accounts for 11.9% of the U.S. economy. Massive fiscal stimulus boosted demand for long-lasting manufactured goods during the COVID-19 pandemic, with millions of American working from home and learning remotely. |
No 7 |
1.7% |
|
May-2021 |
|
| |
|
|
|
New orders for U.S.-made goods fell more than expected in April as a global semiconductor shortage weighed on the production of motor vehicles and electrical equipment, appliances and components. The Commerce Department said on Friday that factory orders dropped 0.6% in April after increasing 1.4% in March. Economists polled by Reuters had forecast factory orders slipping 0.2%. Orders surged 14.2% on a year-on-year basis. |
No 6 |
-0.6% |
|
Apr-2021 |
|
| |
|
|
|
New orders for U.S.-made goods rebounded in March and business spending on equipment was stronger than initially estimated, boosted by robust domestic demand, though momentum could slow because of bottlenecks in the supply chain. The Commerce Department said on Tuesday that factory orders increased 1.1% in March after falling 0.5% in February. Economists polled by Reuters had forecast factory orders rebounding 1.3%. Orders rose 6.6% on a year-on-year basis.. |
No 5 |
1.1% |
|
Mar-2021 |
|
| |
|
|
|
New orders for U.S.-made goods fell in February, likely weighed down by unseasonably cold weather, though manufacturing remains strong as the economic recovery regains steam amid an improving public health situation and massive fiscal stimulus. The Commerce Department said on Monday that factory orders dropped 0.8% after surging 2.7% in January. Economists polled by Reuters had forecast factory orders slipping 0.5% in February. Orders increased 1.0% on a year-on-year basi.. |
Noi 4 |
-0.8% |
|
Feb-2021 |
|
| |
|
|
|
U.S. Factory Orders Jump More Than Expected In January. Partly reflecting a spike in orders for transportation equipment, the Commerce Department released a report on Thursday showing a bigger than expected increase in new orders for U.S. manufactured goods in the month of January.The Commerce Department said factory orders surged up by 2.6 percent after jumping by an upwardly revised 1.6 percent in December. Economists had expected factory orders to advance by 2.1 percent compared to the 1.1 percent increase originally reported for the previous month. |
No 3 |
2.6% |
|
Jan-2021 |
|
| |
|
|
|
U.S. Factory Orders Climb 1.1% in December. Manufacturing has been driven by strong demand for factory goods "as 23.7% of the labor force works from home because of the COVID-19 pandemic. |
No 2 |
1.1% |
|
Dec- 2020 |
|
| |
|
|
|
U.S. factory orders rose 1% in November as manufacturing recovery continued.
U.S. factory goods orders rose for the seventh straight month in November, the Commerce Department said Wednesday.Orders for manufactured goods rose 1% after a 1.3% gain in the prior month. Factories have been able to adapt their operations to meet health precautions required by the coronavirus pandemic |
No 1 |
1.0% |
|
Nov-2020 |
|
| |
|
|
|
|
|
|
|
|
| |
|
|
|
|
|
| |
|
Legends: |
|
Delayed |
|
Positive View |
|
Negative View |
|
Neutral View |
|
Non Available |
|
|
|
|
|
|
|
|
|
|
|
|
|
|
|
|
|
|
|
|
| |
|
|
|
|
|
|
|
|
|
|
|
|
|
|
|
|
|
|
|
|
|
Definitions | Explain |
|
|
Factory Orders | Manufacturing |
|
Today's Week |
|
|
|
|
|
|
|
|
|
|
|
|
| |
|
|
|
|
| |
|
| FACTORY ORDERS |
What are Factory Orders?
Factory orders consist of the earlier announced durable goods report plus non-durable goods orders.
The report is very predictable with nondurables the only new component.
Nondurables consist of such items as food and tobacco products which grow at a fairly consistent monthly rate, so that market forecasts for this report are far more accurate than for the durable orders report.
In addition to seeing nondurables for the first time, the market also watches for revisions to the durable orders data, which can be significant.
At present, durable goods orders sum to about 54% of total orders |
|
|
| |
|
|
|
|
|
|
|
|
|
|
|
| |
|
|
|
|
|
|
| DATA INFORMATION |
FACTORY ORDERS |
| SOURCE |
Institute for Supply Management. |
| WEB |
www.hts.com |
| FREQUENCY |
Monthly |
| AVAILABILITY |
The first business day of the month. |
| COVERAGE |
Data are for the previous month. Data for June are released in July. |
| REVISIONS |
Yes |
| IMPORTANCE |
Manufacturing - Very Important |
|
| |
|
|
|
|
|
|
|
|
|
|
|
|