|
 |
|
|
|
Week 36 -2012 | From Sep 03 to Sep 07, 2012 |
|
 |
|
|
|
|
|
|
| |
|
|
|
|
|
|
|
|
|
|
| |
Economic Data for Week 36-2012 | Global View | Week Rating
| DATE |
DAY |
REPORT/CATEGORY |
HIGHLIGHTS ON WEEK 36-2012 |
LAST |
|
Mon |
HSBC China Mfg PMI |
A contraction in China's factory sector activity intensified in August as both output and new orders dropped while manufacturers cut prices to compete for business. |
47.6 |
|
 |
Chiina |
The China HSBC Flash PMI fell to a seasonally adjusted 47.6, its lowest level since March 2009. The reading was little changed from a preliminary estimate of 47.8 and was lower than 49.3 in July. |
|
|
Mon |
Labor Day |
There will be no US Market Activity Today |
N/A |
|
|
US Market Holidays |
|
|
|
Tue |
Motor Vehicle Sales |
Sales in August were the highest monthly sales figure for any August since 2007. The industry's seasonally adjusted annual selling rate was 14.52 million vehicles in August. |
14.5 Millions |
|
|
Sales and Inventories |
August U.S. vehicle sales topped numerous analysts� expectations, and continue on a selling pace of more than 14 million vehicles, which would top last year�s total sales by about 1.5 million units. |
|
|
Tue |
ISM Manufacturing Index |
The August Manufacturing ISM printed at 49.6, down from July's 49.8, and below expectations of 50. This manufacturing index is shrinking at its sharpest clip in more than three years. |
49.6 |
|
|
Manufacturing |
This was the third contraction in a row and joins the global PMI which now has 80% of the world in contractionary territory. This is the longest decline since the recession ended in 2009, threatening to deprive the world�s largest economy of a driver of growth. |
|
|
Tue |
Construction Spending |
Construction spending plunged from 0.4% to -0.9%, on expectations of an unchanged print, which was the biggest miss in a year and the biggest drop in also a year. The 0.9% drop was the biggest decrease in a year and followed a 0.4% gain in June |
-0.9% |
|
|
Growth |
Construction spending in the U.S. unexpectedly fell in July for the first time in four months as a plunge in home-improvement outlays overshadowed gains in homebuilding. |
|
|
Wed |
MBA purchase Applications |
The Mortgage Bankers Association said its seasonally adjusted index of mortgage application activity, which includes both refinancing and home purchase demand, fell 2. 5% in the week ended August 31. |
-2.5% |
|
|
Real Estate |
The MBA's seasonally adjusted index of refinancing applications fell 3.0% to its lowest level since May 2012, while the gauge of loan requests for home purchases fell 0.8%. |
|
|
Wed |
ICSC Goldman Index |
The ICSC Index edged down 0.4% in the week ended Saturday from the week before on a seasonally adjusted, comparable-store basis as overall sales results were mixed.
|
-0.4%
W/W
|
|
|
Sales and Inventories |
ICSC expects September industry sales will increase 3% to 4%, excluding drug stores sales. On a year-on-year basis, the reading rose 3.7%.
|
|
|
Wed |
Johson Redbook |
Redbook attributes the week's strength to Labor Day promotions and back-to-school shopping that together helped offset regionally weak sales in the Gulf Coast region which was hit by Hurricane Isaac. |
2.5%
Y/Y
|
|
|
Sales and Inventories |
National chain store sales edged up 1.7% in the first week of September from August. Redbook Y/Y plus 2.5% rate the strongest since early June. |
|
|
Wed |
Productivity and Costs |
Productivity increased at a 2.2% annual rate rather than 1.6%. Productivity, which measures hourly output per worker, fell at a 0.5% rate in the first three months of 2012. |
2.2%
Q/Q |
|
|
Business Actvity |
Productivity Posts Sharp Gain as Labor Costs Come Down. Unit labor costs rose at a 1.5% rate in the second quarter rather than 1.7%. Unit labor costs accelerated at a 6.4% rate in the first quarter. |
|
|
Wed |
EIA Crude Oil Report |
EIA oil supplies down 7.4 million barrelsUS commercial crude oil inventories (excluding those in the Strategic Petroleum Reserve) decreased by 7.4 million barrels from the previous week. |
-7.4M
Barrels |
|
|
Commodity |
At 357.1 million barrels, U.S. crude oil inventories are near the upper limit of the average range for this time of year", the EIA reported today. |
|
|
Thu |
ADP Employment Report |
Private payrolls post largest gain in five months. ADP said businesses added 201,000 jobs last month. That's the most reported by the survey since March. |
201,000
Jobs |
|
|
Employment |
ADP said July job growth was stronger than first thought: Employers created 173,000 jobs � 10,000 more jobs than the group reported last month. |
|
|
Thu |
Jobless/Initial Claims |
Weekly applications for unemployment benefits fell by 12,000 to a seasonally adjusted 365,000. The four-week average, a less volatile measure, ticked up to 371,250. |
365K |
|
|
Employment |
The number of Americans filing new claims for jobless benefits fell last week to its lowest level in a month, also an upbeat signal for a labor market that has struggled to create enough jobs. |
|
|
Thu |
ISM Non-Mfg Index |
The Institute for Supply Management said on Thursday its services index jumped to 53.7 last month from 52.6 in July. That beat economists' forecasts for a 52.5 reading. |
53.7 |
|
|
Business Activity |
ISM's non-manufacturing PMI rises to 53.7, highest reading since May. The pace of growth in the massive services sector rose in August on the back of a rebound in employment, beating expectations, though a measure of new orders declined. |
|
|
Thu |
EIA Natural Gas Report |
In the week ending at Aug-31, the US natural gas storage by EIA dropped from 66B (previous week) to 28B. |
33bcf |
|
|
Commodity |
Natural gas in storage rose 28 billion cubic feet in the August 31 week to 3,402 bcf. An injection of 33 bcf was expected. |
|
|
Thu |
Fed Balance Sheet |
The balance sheet is $115 billion smaller than it was on December 28 last year. one-month rise. Rates are now again near record lows, as you can see in the chart below. |
9.4B |
|
|
Government |
On August 29 the Fed’s balance sheet was $42.76bn lower than a year ago, according to the latest figures. And $12.94bn lower than the previous week. Looking at total factors supplying reserve funds, these are down $31.52bn from a year ago and $6.99bn from the previous week. |
|
|
Thu |
M2 Money Supply |
|
$26.3B |
|
|
Money Supply |
|
|
|
Fri |
Fixed Mortgage Rates |
Mortgage rates continued to slip last week amid mixed economic data, but it didn't bolster mortgage demand from prospective homebuyers, and those who own homes aren't rushing out to refinance. |
3.55% APR |
|
|
Interest Rates |
The 30-year fixed rate fell to 3.55%, down from 3.59% the week prior, while the 15-year rate held steady at 2.86%. The two-week decline in the 30-year rate followed a one-month rise. |
|
|
Fri |
Employment Situation |
New Jobs at 96,000, Missing Expectations; Rate Hits 8.1%. Employment growth remained weak in August, with just 96,000 new positions created but the unemployment rate dropped to 8.1 percent |
8.1%
Rate
|
|
|
Employment |
The decline in the jobless rate, from 8.3% in July, came primarily because the labor force participation rate fell to 63.5% , its worst level in more than 30 years, so today's report is very dissapointing. |
|
|
|
|
|
|
|
|
| |
|
|
|
|
|
|
|
|
|
|
|
|
| |
|
|
|
|
| |
|
|
|
|
|
| |
|
|
|
|
|
| |
|
|
|
|
| |
|
| WEEK 36-2012 ENDING SEP. 07 |
Reports Commentary
The HSBC finding echoed the results of China's official PMI, released on Saturday, which hit a nine-month low in August, falling to a lower-than-expected 49.2 from 50.1 in July. It was the first time the official PMI had fallen below 50 points, the threshold dividing expansion from contraction, since November 2011.
August marked the 10th straight month that the HSBC survey, which better reflects smaller and private-sector manufacturers, has been below 50
The employment sub-index fell for the sixth month in a row, to its worst reading since March 2009.
Disappointing data from China also dragged oil prices lower. Both an official manufacturing activity survey and HSBC�s China manufacturing Purchasing Mangers� Index showed conditions in the sector worsened, with the latter survey falling to a 41-month low. Oil futures slipped during European trading hours on Monday, after data showed manufacturing activity weakened in China and as the dollar moved higher.
China's growth for 2012 could fall to as little as 3%, well below the government's target of 7.5 % growth.
U.S. auto industry continues to buck economy; vehicle sales expected to top 14 millionU.S. auto industry continues to buck economy; vehicle sales expected to top 14 million. The good news for the industry overall is most automakers have been able to post gains without increasing incentive spending, and while experiencing higher transaction prices .
This was the third contraction in a row and joins the global PMI which now has 80% of the world in contractionary territory.
Applications for U.S. home mortgages fell last week as demand for refinancing slowed further and new home loans slipped, an industry group said on Wednesday.
ICSC/Goldman Retail Sales Index Dips 0.4% in Week.
U.S. nonfarm productivity increased at a much faster clip than previously thought in the second quarter as businesses squeezed more output from employees, while wage inflation was muted.
Economists had expected second-quarter productivity would be raised to a 1.8 percent rate. The revision reflects an upward adjustment to the country's second-quarter economic growth estimate to a 1.7% pace from 1.5%.
Stocks rallied on Thursday on positive economic data and the European Central Bank's agreement to launch a new and potentially unlimited bond-buying program to lower struggling euro zone countries' borrowing costs.
The number of Americans filing new claims for jobless benefits fell last week to its lowest level in a month, also an upbeat signal for a labor market that has struggled to create enough jobs. The labor market is getting better and while the pace of improvement is nothing great, the direction is clear
On Tuesday, the ISM manufacturing report missed expectations, falling below 50, with a bunch of internals. But two days later, the counterpart ISM non-manufacturing (services) report came in very strong, with employment surging.
The differences between services and manufacturing is that manufacturing is highly exposed to exports to weak foreign nations, while services are not. It's simple. Here's a look at the ISM manufacturing export index. �Decent domestic growth, but weakness in areas exposed to Europe and China.
The health of housing, an endless debate, appeared a bit improved earlier this summer as data in August showed more homes sold and inventories of new homes depleted to record lows. By some measures, prices were rising.
The recent dip in the 30-year rate did little to bolster demand for refinancing, and applications for new mortgages also decreased.
U.S. unemployment rate falls to 8.1% even as job growth slows in August.
The reason was a huge amount of people who have stopped looking for jobs: labor force participation dropped to 63.5%, down from 63.7%, the lowest since 1981.
New job formation just 96,000 on expectations of 125,000.
The prior month�s data was revised lower by 22,000.
In short, 15,000 manufacturing jobs were lost, compared to the expected +10K.
College grads are at the highest unemployment rate since the BLS began tracking.
The real unemployment rate from the government�s report (U-6) is 14.7%
The report could lift hopes that the Fed will step in with a third round of quantitative easing, a program in which the central bank buys government debt in hopes of driving down interest rates and pushing investors to riskier assets. |
|
| |
|
|
|
|
|
|
|
|
|
|
|
|
|
|
|
|
|
|
|
|
|
|
|
|
|
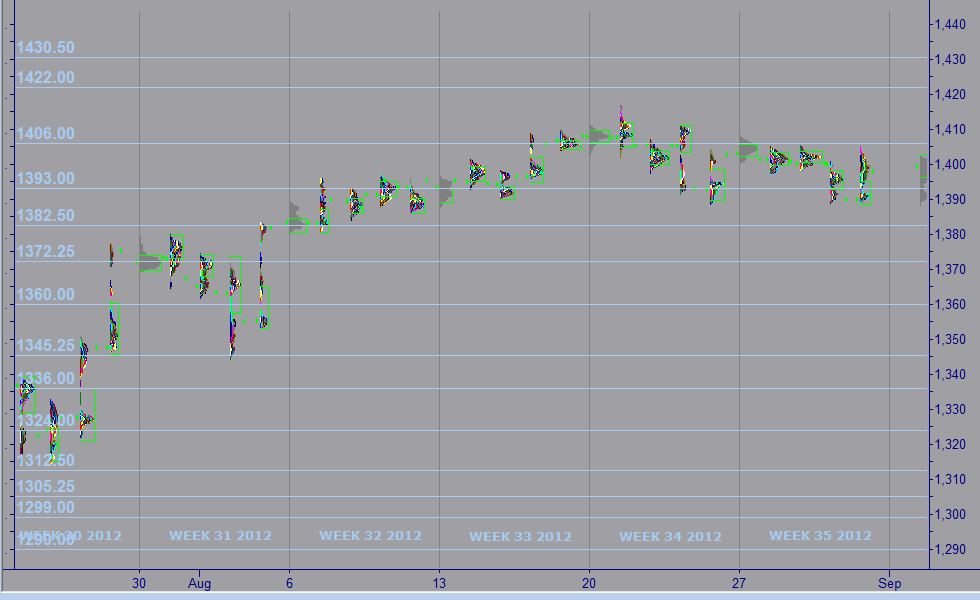
| MARKET PROFILE |
 |
WEEKS 2012 |
WEEK 36 |
% FROM CLOSE |
% FROM OPEN |
 |
RESISTANCE 1 |
1,330.25 |
1.39% |
1.35% |
|
RESISTANCE 2 |
1,326.25 |
1.08% |
1.04% |
 |
CLOSE MAR 02 |
1,350.00 |
|
|
|
OPEN MAR 04 |
1,255.00 |
0.04% |
|
 |
SUPPORT 1 |
1,289.00 |
0.66% |
0.62% |
|
SUPPORT 2 |
1,283.50 |
0.08% |
0.04% |
|
|
|
|
|
|
|
|
|
| |
|
|
|
|
|
| |
|
|
|
|
|
|
IMPORTANT NOTE: In an effort to comply with all applicable rules, regulations and disclosures please be so kind and read the "General Disclosure" below: |
| |
|
|
|
|
| GENERAL DISCLOSURE - TRADINGVESTING.COM |
- The material contained on our Website and Economic Calendar must be used at your own risk. Material is believed to be reliable, but we do not guarantee its accuracy or validity, nor is Tradingvesting.com responsible for any errors or omissions which may occur. The analysis and/or recommendations made by Tradingvesting.com do not provide, imply, or otherwise constitute a guarantee of performance. All contents and recommendations are based on data and sources believed to be reliable, but accuracy and completeness cannot be guaranteed. It should not be assumed that future results will be profitable or will equal past performance, real, indicated or implied.Tradingvesting.com website and material contained therein is not a solicitation to participate in the Futures/Stocks/Options Market. This Economic Calendar does not include Earning Releases, Announced Stock Splits, Upcoming Initial Public Offerings with Underwritings or Rating Changes. Tradingvesting.com has attempted to verify the information contained in this calendar. However, any aspect of such info may change without notice. Unless indicated otherwise: economic data is from the U.S and intraday data is at least 20 minutes delayed; all prices are in the local currency; Time is U.S. Eastern Time. Furthermore, there is a very high degree of risk involved in trading.Tradingvesting.com assumes no responsibilities for your trading and investment results, please red our Risk Disclosure.
- Tradingvesting.com does not provide investment advice, and does not represent that any of the information or related analysis is accurate or complete at any time. All information on this website are for educational purposes only and are not intended to provide financial advice. Any statements about profits or income, expressed or implied, do not represent a guarantee. Your actual trading may result in losses as no trading system is guaranteed. You accept full responsibilities for your actions, trades, profit or loss, and agree to hold Tradingvesting.com and any authorized distributors of this information harmless in any and all ways. We respect your right to privacy, please click here to view our privacy policy.
- U.S. Government Required Disclaimer - Commodity Futures Trading Commission.
Futures and options trading has large potential rewards, but also large potential risk. You must be aware of the risks and be willing to accept them in order to invest in the futures and options markets. Don't trade with money you can't afford to lose. This website is neither a solicitation nor an offer to Buy/Sell futures or options. No representation is being made that any account will or is likely to achieve profits or losses similar to those discussed on this website. The past performance of any trading system or methodology is not necessarily indicative of future results.
- CFTC rule 4.41:Hypothetical or simulated performance results have certain limitations. Unlike an actual performance record, simulated results do not represent actual trading. Also, since the trades have not been executed, the results may have under-or-over compensated for the impact, if any, of certain market factors, such as lack of liquidity. Simulated trading programs in general are also subject to the fact that they are designed with the benefit of hindsight. No representation is being made that any account will or is likely to achieve profit or losses similar to those shown.
- Risk Warning: Trading foreign exchange on margin carries a high level of risk, and may not be suitable for all investors. The high degree of leverage can work against you as well as for you. Before deciding to invest in foreign exchange you should carefully consider your investment objectives, level of experience, and risk appetite. The possibility exists that you could sustain a loss of some or all of your initial investment and therefore you should not invest money that you cannot afford to lose. You should be aware of all the risks associated with foreign exchange trading, and seek advice from an independent financial advisor if you have any doubts. Our linking to these sites does not constitute an endorsement of any products, services or the information found on them. Once you link to another site you are subject to the policies of the new site. By using this site, you agree to the Terms of Service, Privacy Policy and Risk Disclosure. Copyright � 2012 Tradingvesting, LLC. All rights reserved. If you have any questions regarding the Online Economic Calendar application, please contact us: click here.
THIS BRIEF STATEMENT CANNOT, OF COURSE, DISCLOSE ALL THE RISKS AND OTHER ASPECTS OF THE COMMODITY MARKETS AND EQUITY MARKETS. PLEASE READ MORE AT: TERMS OF SERVICE.
|
|
|
| |
|
|
|
|
|
| |
|
|
|
|
|