Tradingvesting..com
www.tradingvesting.com www.tradingvesting.com www.tradingvesting.com www.tradingvesting.com www.tradingvesting.com
 

Tradingvesting.com

Quick Links Today's Week
 
Economic Calendar 52 Week GlobalView Reports Trend


What is....

Charts What We Do Today's Week


  Tradingvesting.com is a Tool that provides Guidance for Traders and Investors to follow a Short-Term Trend and Long-Term Trend of the S&P 500 Index.  


  For Short-Term Trends  
       
  1. Weekly Alert Send by Emal  
  2. Menbers with valid email  
  3. Betwenn 8:30 and 16:30 EST  
  4. Based on Proprietary Indicator  
  5. Trend Follower  
       
  View Trend List  
 
           
  For Long-Term Trends      
           
  1. Key Economic Reports Interest, Inflation, GDP...  
  2. Top Earnings Reports AAPL, TSLA, NVDA. MSFT...  
  3. 52-Week Summary Oil, Gold, 10-Year, US Dollar...  
  4. World Factors Geopolitical Risks, WCB...  
  5. All Together Geopolitical Risks, WCB...  
           
  Economic Calendar      
   

Current Trend


Current Trend
             
Top of Page
           
  Tradingvesting | Charts USA Charts You need to know...   Today's Week Today's Week
GLOBALVIEW CHARTS
Indexes SP 500 Nasdaq Dow 10 Year bond 30 Year Mortgage Oil Gold Silver Copper NatGas US Dollar Bitcoin
             
Top of Page


S&P 500 Monthly | Last 10 Years

Today's Week
 
 
No Date 2017 2018 2019 2020 2021 2022 2023 2024 2025 2026 Avg
  Years 1 2 3 4 5 6 7 8 9 10  
1 January 1.21% 5.22% 9.17% -0.59% -1.34% -5.50% 5.80% 2.12% 2.33% 0.89% 1.93%
2 February 3.41% -3.64% 3.04% -8.70% 2.14% -3.22% -2.45% 4.84% -0.25% ... -0.54%
3 March -0.73% -2.74% 1.29% -13.10% 3.39% 3.83% 3.68% 3.06% -5.97% ... -0.81%
4 April 0.93% 0.55% 3.41% 16.59% 4.72% -8.99% 1.64% -4.23% -0.51% ... 1.57%
5 May 0.98% 2.36% -6.78% 6.11% 0.29% 0.04% 0.31% 4.94% 5.09% ... 1.48%
6 June 0.32% -0.01% 6.91% 2.02% 1.92% -8.78% 2.37% 3.08% 5.23% ... 1.45%
7 July 1.60% 4.12% 0.30% 5.32% 2.20% 9.24% 3.11% 0.94% 2.46% ... 3.25%
8 August -0.22% 2.85% -1.81% 6.45% 2.63% -3.83% -1.55% 2.00% 2.75% ... 1.03%
9 September 1.82% 0.59% 2.33% -4.12% -4.89% -8.92% -5.35% 2.46% 4.48% ... -1.29%
10 October 2.14% -7.33% 1.81% -3.42% 6.68% 7.26% -2.12% -0.91% 0.71% ... 0.54%
11 November 2.49% 1.57% 2.96% 9.87% -0.95% 4.57% 8.72% 5.40% -0.48% ... 3.79%
12 December 1.08% -10.16% 2.77% 3.02% 3.55% -6.06% 4.61% -2.62% 0.49% ... -0.37%
  Annual 18.74% -6.59% 30.43% 15.76% 26.61% -19.64% 23.79% 23.95% 15.96% 0.89% 12.99%
Mo Average 1.25% -0.55% 2.12% 1.62% 1.70% -1.70% 1.56% 1.76% 1.36% 0.89% 1.00%
Mo High 3.41% 5.22% 9.17% 16.59% 6.68% 9.24% 8.72% 5.40% 5.23% 0.89% 7.06%
Mo Low -0.73% -10.16% -6.78% -13.10% -4.89% -8.78% -2.45% -4.23% -5.97% 0.89% -5.62%
  View S&P 500 monthly          
Top of Page


Diffrence between Trading and Investing

Today's Week


TRADING VS INVESTING
Tradingvesting = Trading + investing

The primary difference between Trading and Investing is:

 Time Frame

- Trading focuses on making short-term profits from market volatility

- Investing focuses on building wealth gradually over years or decades through long-term growth and compounding.

The secondary difference between Trading and Investing is:

 Financial Aproach

Trading aims for quick profits from short-term market price fluctuations over days, weeks, or months, often utilizing technical analysis. Trading plays a vital role in providing liquidity to financial markets. It doesn’t rely on holding assets for years but rather on making smaller, frequent profits: sometimes within minutes or hours.

Investing is a long-term strategy focused on buying assets and holding them to grow value over time. Investors look beyond short-term price swings and instead focus on fundamentals: a company’s profitability, growth potential, and overall financial healt. Investing builds long-term wealth over years or decades, focusing on compound growth, dividends, and fundamental value.

The Goal of Trading and Investing is:

 Profit

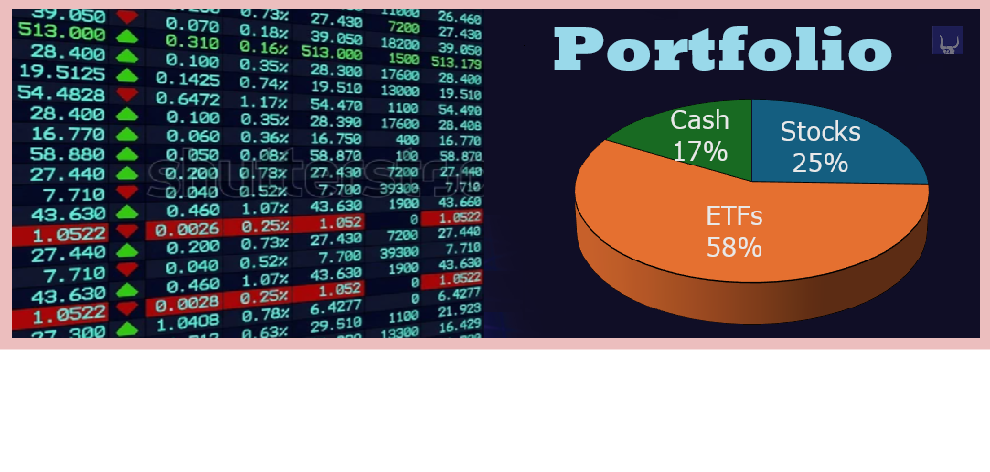
Trading and investing utilize different time frames and distinct financial approaches with the same goal: Profit.

             
Top of Page


Reasons to Follow

Today's Week


WHY WE USE U.S. DATA IN OUR REPORTS?
U.S. Economic data

Amid the doom and gloom, the U.S. is still the place most investors and businesses around the world turn to for opportunity even though Brazil, Russia and other emerging economies are increasingly catching up.

Emerging economies are catching up rapidly. China, the world's second-largest economy next to the U.S., expects an average of 9% growth a year for the next decade.

The U.S., whose economy barely grew during the first half of this year, will be lucky to see much more than 2% growth this year.

World Bank said on feb, 2012 in a report that forecast the China would become the world's largest economy before 2030. However gloomy the U.S. economy might look, the nation still leads the world in many ways. For now, considering the following facts:

1. The Biggest and Most Productive Economy

The U.S. is still the world's biggest and most productive economy in the world and that is the main reason to use U.S. data in our Economic Reports. The U.S. is the world's leading country in absolute volumes of imports and exports and, therefore, still the world's leading economic power.

2. Tops in Foreign Investment

Although, the United States is the world’s leading debtor nation, the U.S. remains the world's hot spot for foreigners investors.

3. World's Top Global Brands

The U.S. may not manufacture most of the world's automobiles or computers, but it's known for many top brands that do so.

4. World's Best Universities

U.S. public schools may be flagging, but the nation is still home to many of the world's top universities. And foreign students in the U.S. make up an important piece of its economy.

5. World's Top Reserve Currency

The value of the U.S. dollar may be declining, but it remains the currency of choice for many nations. The greenback accounted for roughly 61% of global central bank reserves during the first three months of 2011, according to the International Monetary Fund.

 
Important Pages
Airlines  
  Cruises  
  Housing Developers  
  Leveraged ETFs  
  Trading  
  Investing  
  Global View  
  Weekly Review  
             
Top of Page
             
Interest Rates
Interest Rates
Meetings
Minutes
Beige Book
Growth
Growth
GDP
US Balance
Spending
Inflation
Growth
CPI
Core PCE
PPI
Employment
Employment
Payroll
Rate
ADP
Manufacturing
Manufacturing
ISM Mfg
Industrial
Factory
Real Estate
Real Estate
Starts
Permits
Shiller
stock market, online trading, ETF, portfolio, dividends, crypto, day trading, shares, how to start investing, broker, day trading, IPO, bull market, bear market, how to invest, margin account, futures, stock market today, stock market futures, investing, stock signals, stock alerts, stockmarket, alerts
 
 
Calendar | 52-Weeks | Global | Trend500 | Top News | Reports | Charts | Indexes | Today
Vix | Oil | ETFs | Stocks | Futures | 10-Year | S&P 500 | Markets | Register
About | Contact | Log-in | Register | WeDo | Times | Links
Disclaimer | Privacy Policy | Risk Disclosure
 
Tradingvesting.com | Trading and Investing
 
All Rights Reserved | www.tradingvesting.com | © Copyright 2008
Discipline - Confidence - Patience