|
 |
|
 |
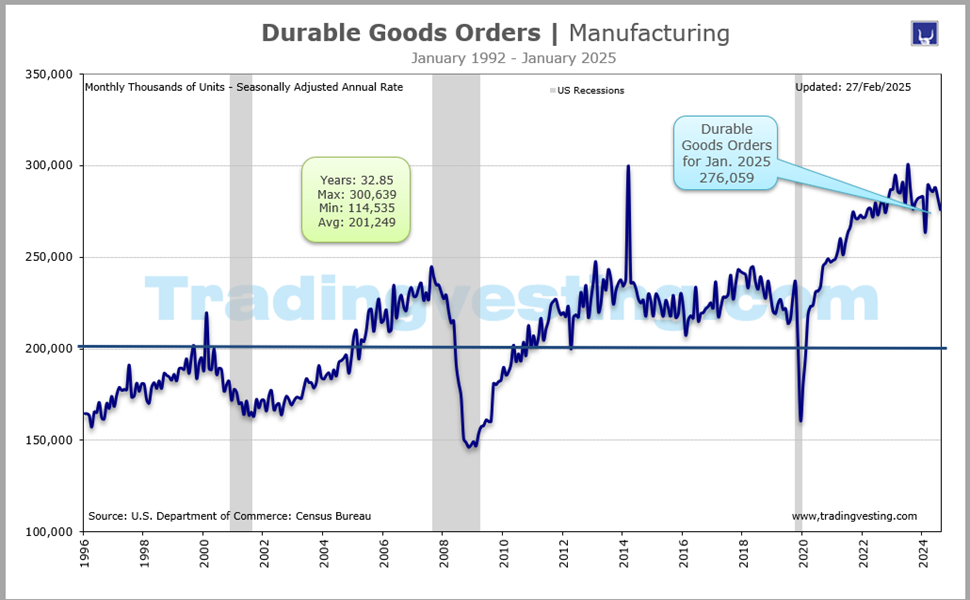
Durable Goods Orders | Manufacturing |
|
 |
|
Durable goods orders are a leading indicator of industrial production and capital spending. Durable goods is defined as goods whose intended lifespan is three years or more. Read More...
|
|
|
|
|
|
|
| |
|
| |
 1. ISM Manufacturing Index (1 of 9) 1. ISM Manufacturing Index (1 of 9) 2. Industrial Production (2 of 9) 2. Industrial Production (2 of 9)3. Durable Goods Orders (3 of 9)
 4. Factory Orders (4 of 9) 4. Factory Orders (4 of 9) 5. Empire State Mafg Index (5 of 9) 5. Empire State Mafg Index (5 of 9) 6. PMI Mfg Final (6 of 9) 6. PMI Mfg Final (6 of 9) 7. PMI Composite Flash (7 of 9) 7. PMI Composite Flash (7 of 9) 8. Chicago PMI (8 of 9) 8. Chicago PMI (8 of 9) 9. Philadelphia Mfg Index (9 of 9) 9. Philadelphia Mfg Index (9 of 9)
|
 |
|
|
|
|
| |
|
→ Big Chart |
|
→ Release |
|
| |
|
|
|
|
|
|
|
|
|
|
|
|
|
|
|
|
|
|
|
 |
|
Big Chart | Large Data |
 |
|
Durable Goods Orders | Manufacturing |
|
Today's Week |
 |
|
|
|
|
|
|
|
|
|
|
|
|
|
| |
|
|
|
|
|
|
|
|
|
|
|
|
|
|
|
|
|
|
|
|
|
Slides | Ten 10 |
|
|
Durable Good Orders | Manufacturing |
|
Today's Week |
|
|
|
|
|
|
|
|
|
|
|
|
|
|
| |
|
|
|
|
|
|
|
|
|
|
|
|
|
|
|
|
|
|
|
|
|
Release Schedule | 2026 |
|
|
Durable Goods Orders | Manufacturing |
|
Today's Week |
|
|
|
|
|
|
|
|
|
|
|
|
|
Durable Goods Orders (At 8:30 a.m ET)
| SCHEDULE 2026 |
No 1 |
No 2 |
No 3 |
No 4 |
No 5 |
No 6 |
No 7 |
No 8 |
No 9 |
No 10 |
No 11 |
No 12 |
| Release | Week |
|
|
|
|
|
|
|
|
|
|
|
|
| Release | Date |
|
|
|
|
|
|
|
|
|
|
|
|
| Release | Day |
|
|
|
|
|
|
|
|
|
|
|
|
 |
|
|
|
|
|
|
|
|
|
|
|
|
| Prior |
5.3% |
-1.4% |
0.0% |
-1.4% |
0.8% |
... |
... |
... |
... |
... |
... |
... |
| Prior Revised |
5.4% |
-0.9% |
-0.5% |
-1.2% |
1.3% |
... |
... |
... |
... |
... |
... |
... |
| CONSENSUS |
-2.3% |
0.5% |
-0.2% |
0.5% |
2.8% |
... |
... |
... |
... |
... |
... |
... |
| Consensus Low |
-5.1% |
-2.0% |
-4.5% |
0.3% |
0.1% |
... |
... |
... |
... |
... |
... |
... |
| Consensus High |
1.0% |
1.7% |
2.0% |
1.2% |
4.5% |
... |
... |
... |
... |
... |
... |
... |
| DURABLE M/M |
-1.4% |
0.0% |
-1.4% |
0.8% |
7.9% |
... |
... |
... |
... |
... |
... |
... |
| RATING |
|
|
|
|
|
|
|
|
|
|
|
|
| Month For |
Dec-25 |
Jan-26 |
Feb-26 |
Mar-26 |
Apr-26 |
May-26 |
Jun-26 |
Jul-26 |
Aug-26 |
Sep-26 |
Oct-26 |
Nov-26 |
|
|
|
|
|
|
|
|
|
|
|
|
|
|
|
| |
|
| |
|
|
|
|
|
|
|
|
|
|
|
Release Schedule | 2025 |
|
|
Durable Goods Orders | Manufacturing |
|
Today's Week |
|
|
|
|
|
|
|
|
|
|
|
|
|
Durable Goods Orders (At 8:30 a.m ET)
| SCHEDULE 2025 |
No 1 |
No 2 |
No 3 |
No 4 |
No 5 |
No 6 |
No 7 |
No 8 |
No 9 |
No 10 |
No 11 |
No 12 |
| Release | Week |
|
|
|
|
|
|
|
|
|
|
|
|
| Release | Date |
|
|
|
|
|
|
|
|
|
|
|
|
| Release | Day |
|
|
|
|
|
|
|
|
|
|
|
|
|
|
|
|
|
|
|
|
|
|
|
|
|
| Prior |
-1.1% |
-2.2% |
3.1% |
0.9% |
9.2% |
-6.3% |
16.4% |
-9.3% |
-2.8% |
2.9% |
0.5% |
-2.2% |
| Prior Revised |
-2.0% |
-1.8% |
3.3% |
... |
7.6% |
-6.6% |
16.5% |
-9.4% |
-2.7% |
3.0% |
0.7% |
-2.1% |
| CONSENSUS |
0.8% |
1.9% |
-1.0% |
1.4% |
-8.1% |
7.0% |
-11.0% |
-4.0% |
-0.5% |
0.1% |
-1.5% |
3.0% |
| Consensus Low |
-4.5% |
0.5% |
-1.5% |
0.0% |
-10.0% |
3.0% |
-13.0% |
-6.4% |
-1.6% |
-1.5% |
-4.5% |
0.2% |
| Consensus High |
2.2% |
3.5% |
1.3% |
2.8% |
-0.5% |
3.5% |
-8.6% |
2.0% |
4.3% |
1.4% |
0.6% |
5.4% |
| DURABLE M/M |
-2.2% |
3.1% |
0.9% |
9.2% |
-6.3% |
16.4% |
-9.3% |
-2.8% |
2.9% |
0.5% |
-2.2% |
5.3% |
| RATING |
|
|
|
|
|
|
|
|
|
|
|
|
| Month For |
Dec-24 |
Jan-25 |
Feb-25 |
Mar-25 |
Apr-25 |
May-25 |
Jun-25 |
Jul-25 |
Aug-25 |
Sep-25 |
Oct-25 |
Nov-25 |
|
|
|
|
|
|
|
|
|
|
|
|
|
|
|
| |
|
| |
|
|
|
|
|
|
|
|
|
|
|
Release Schedule | 2024 |
|
|
Durable Goods Orders | Manufacturing |
|
Today's Week |
|
|
|
|
|
|
|
|
|
|
|
|
|
Durable Goods Orders (At 8:30 a.m ET)
| SCHEDULE 2024 |
No 1 |
No 2 |
No 3 |
No 4 |
No 5 |
No 6 |
No 7 |
No 8 |
No 9 |
No 10 |
No 11 |
No 12 |
| Release | Week |
|
|
|
|
|
|
|
|
|
|
|
|
| Release | Date |
|
|
|
|
|
|
|
|
|
|
|
|
| Release | Day |
|
|
|
|
|
|
|
|
|
|
|
|
|
|
|
|
|
|
|
|
|
|
|
|
|
| Prior |
5.4% |
0.0% |
-6.1% |
1.4% |
2.6% |
0.7% |
0.1% |
-6.6% |
9.9% |
0.0% |
-0.8% |
0.2% |
| Prior Revised |
5.5% |
-0.3% |
-6.9% |
0.7% |
0.8% |
0.2% |
... |
-6.9% |
... |
-0.8% |
-0.4% |
0.8% |
| CONSENSUS |
1.0% |
-4.5% |
1.3% |
2.3% |
-0.5% |
0.0% |
0.3% |
4.5% |
-2.7% |
-0.5% |
0.5% |
-0.2% |
| Consensus Low |
-3.8% |
-6.7% |
0.2% |
-0.2% |
-2.0% |
-3.2% |
-2.3% |
-0.3% |
... |
-5.0% |
-0.5% |
-1.5% |
| Consensus High |
3.4% |
-1.3% |
3.0% |
4.5% |
1.8% |
3.0% |
0.8% |
9.0% |
... |
1.0% |
2.6% |
1.6% |
| Durable M/M |
0.0% |
-6.1% |
1.4% |
2.6% |
0.7% |
0.1% |
-6.6% |
9.9% |
0.0% |
-0.8% |
0.2% |
-1.1% |
| RATING |
|
|
|
|
|
|
|
|
|
|
|
|
| Month For |
Dec-23 |
Jan-24 |
Feb-24 |
Mar-24 |
Apr-24 |
May-24 |
Jun-24 |
Jul-24 |
Aug-24 |
Sep-24 |
Oct-24 |
Nov-24 |
|
|
|
|
|
|
|
|
|
|
|
|
|
|
|
| |
|
| |
|
|
|
|
|
|
|
|
|
|
|
Release Schedule | 2023 |
|
|
Durable Goods Orders | Manufacturing |
|
Today's Week |
|
|
|
|
|
|
|
|
|
|
|
|
|
Durable Goods Orders (At 8:30 a.m ET)
| SCHEDULE 2023 |
No 1 |
No 2 |
No 3 |
No 4 |
No 5 |
No 6 |
No 7 |
No 8 |
No 9 |
No 10 |
No 11 |
No 12 |
| Release | Week |
|
|
|
|
|
|
|
|
|
|
|
|
| Release | Date |
|
|
|
|
|
|
|
|
|
|
|
|
| Release | Day |
|
|
|
|
|
|
|
|
|
|
|
|
|
|
|
|
|
|
|
|
|
|
|
|
|
| Prior |
-2.1% |
5.6% |
-4.5% |
-1.0% |
3.2% |
1.1% |
1.7% |
4.7% |
-5.2% |
0.2% |
4.7% |
-5.4% |
| Prior Revised |
-1.7% |
5.1% |
-5.0% |
-1.2% |
3.3% |
1.2% |
2.0% |
4.4% |
-5.6% |
-0.1% |
4.0% |
-5.1% |
| CONSENSUS |
2.8% |
-4.0% |
1.5% |
0.9% |
-1.1% |
-1.0% |
0.5% |
-4.0% |
-0.3% |
1.0% |
-3.2% |
2.4% |
| Consensus Low |
-1.0% |
-4.7% |
-1.5% |
-0.5% |
-2.1% |
-2.0% |
-3.3% |
-5.7% |
-1.6% |
-0.5% |
-4.4% |
1.7% |
| Consensus High |
4.6% |
-0.5% |
2.8% |
2.0% |
0.2% |
1.5% |
7.0% |
0.5% |
1.0% |
3.6% |
-2.8% |
4.5% |
| Durable M/M |
5.6% |
-4.5% |
-1.0% |
3.2% |
1.1% |
1.7% |
4.7% |
-5.2% |
0.2% |
4.7% |
-5.4% |
5.4% |
| RATING |
|
|
|
|
|
|
|
|
|
|
|
|
| Month For |
Dec-22 |
Jan-23 |
Feb-23 |
Mar-23 |
Apr-23 |
May-23 |
Jun-23 |
Jul-23 |
Aug-23 |
Sep-23 |
Oct-23 |
Nov-23 |
|
|
|
|
|
|
|
|
|
|
|
|
|
|
|
| |
|
| |
|
|
|
|
|
|
|
|
|
|
|
Release Schedule | 2022 |
|
|
Durable Goods Orders | Manufacturing |
|
Today's Week |
|
|
|
|
|
|
|
|
|
|
|
|
|
Durable Goods Orders (At 8:30 a.m ET)
| SCHEDULE 2022 |
No 1 |
No 2 |
No 3 |
No 4 |
No 5 |
No 6 |
No 7 |
No 8 |
No 9 |
No 10 |
No 11 |
No 12 |
| Release | Week |
|
|
|
|
|
|
|
|
|
|
|
|
| Release | Date |
|
|
|
|
|
|
|
|
|
|
|
|
| Release | Day |
|
|
|
|
|
|
|
|
|
|
|
|
|
|
|
|
|
|
|
|
|
|
|
|
|
| Prior |
2.5% |
-0.9% |
1.6% |
-2.2% |
0.8% |
0.4% |
0.7% |
1.9% |
1.9% |
-0.2% |
0.4% |
1.0% |
| Prior Revised |
3.2% |
1.2% |
No |
-1.7% |
0.6% |
No |
0.8% |
2.2% |
2.2% |
0.2% |
0.3% |
0.7% |
| CONSENSUS |
-0.5% |
0.5% |
-0.5% |
1.0% |
0.5% |
0.1% |
-0.5% |
0.5% |
0.5% |
0.6% |
0.4% |
-0.8% |
| Consensus Low |
-1.2% |
-0.6% |
-1.5% |
-2.5% |
-0.1% |
-1.3% |
-2.5% |
-0.4% |
-0.4% |
-0.5% |
-0.5% |
-2.5% |
| Consensus High |
0.5% |
1.5% |
1.0% |
1.5% |
2.0% |
1.0% |
0.8% |
2.1% |
2.1% |
2.0% |
1.5% |
0.2% |
| Durable M/M |
-0.9% |
1.6% |
-2.2% |
0.8% |
0.4% |
0.7% |
1.9% |
0.0% |
0.0% |
0.4% |
1.0% |
-2.1% |
| RATING |
|
|
|
|
|
|
|
|
|
|
|
|
| Month For |
Dec-21 |
Jan-22 |
Feb-22 |
Mar-22 |
Apr-22 |
May-22 |
Jun-22 |
Jul-22 |
Aug-22 |
Sep-22 |
Oct-22 |
Nov-22 |
|
|
|
|
|
|
|
|
|
|
|
|
|
|
|
| |
|
| |
|
|
|
|
|
|
|
|
|
|
|
Release Schedule | 2021 |
|
|
Durable Goods Orders | Manufacturing |
|
Today's Week |
|
|
|
|
|
|
|
|
|
|
|
|
|
Durable Goods Orders (At 8:30 a.m ET)
| SCHEDULE 2021 |
No 1 |
No 2 |
No 3 |
No 4 |
No 5 |
No 6 |
No 7 |
No 8 |
No 9 |
No 10 |
No 11 |
No 12 |
| Release | Week |
|
|
|
|
|
|
|
|
|
|
|
|
| Release | Date |
|
|
|
|
|
|
|
|
|
|
|
|
| Release | Day |
|
|
|
|
|
|
|
|
|
|
|
|
|
|
|
|
|
|
|
|
|
|
|
|
|
| Prior |
0.7% |
0.2% |
3.4% |
-1.1% |
0.5% |
-1.3% |
2.3% |
0.8% |
-0.1% |
1.8% |
-0.4% |
-0.5% |
| Prior Revised |
0.7% |
0.7% |
3.5% |
-0.9% |
1.3% |
-0.8% |
3.2% |
No |
0.5% |
1.3% |
no |
0.1% |
| CONSENSUS |
1.6% |
1.1% |
0.8% |
2.0% |
0.7% |
2.0% |
2.1% |
-0.2% |
0.6% |
-1.0% |
0.3% |
1.6% |
| Consensus Low |
-0.5% |
-3.5% |
-1.0% |
1.0% |
-1.1% |
1.0% |
0.6% |
-4.0% |
-0.3% |
-5.0% |
-0.5% |
-0.5% |
| Consensus High |
3.5% |
3.0% |
3.9% |
7.0% |
1.9% |
4.0% |
4.0% |
0.8% |
1.5% |
1.0% |
1.1% |
3.5% |
| Durable M/M |
0.2% |
3.4% |
-1.1% |
0.5% |
-1.3% |
2.3% |
0.8% |
-0.1% |
1.8% |
-0.4% |
-0.5% |
2.5% |
| RATING |
|
|
|
|
|
|
|
|
|
|
|
|
| Month For |
Dec-20 |
Jan-21 |
Feb-21 |
Mar-21 |
Apr-21 |
May-21 |
Jun-21 |
Jul-21 |
Aug-21 |
Sep-21 |
Oct-21 |
Nov-21 |
|
|
|
|
|
|
|
|
|
|
|
|
|
|
|
| |
|
| |
|
Legends: |
 |
Delayed |
 |
Positive View |
 |
Negative View |
 |
Neutral View |
 |
Non Available |
|
|
|
|
|
|
|
|
|
|
|
|
|
|
|
|
|
|
|
|
| |
|
|
|
|
|
|
|
|
|
|
|
|
|
|
|
|
|
|
|
|
|
Brief News | 2026 |
|
|
Durable Goods Orders | Manufacturing |
|
Today's Week |
|
|
|
|
|
|
|
|
|
|
|
|
|
Durable Goods Orders (At 8:30 a.m ET)
| DATE/WEEK |
HIGHLIGHTS |
FOR |
ACTUAL |
|
Durable Goods Orders |
No 12 |
... |
|
Nov-2026 |
|
| |
|
|
|
Durable Goods Orders |
No 11 |
... |
|
Oct-2026 |
|
| |
|
|
|
Durable Goods Orders |
No 10 |
... |
|
Sep-2026 |
|
| |
|
|
|
Durable Goods Orders |
No 9 |
... |
|
Aug-2026 |
|
| |
|
|
|
Durable Goods Orders |
No 8 |
... |
|
Jul-2026 |
|
| |
|
|
|
Durable Goods Orders |
No 7 |
... |
|
Jun-2026 |
|
| |
|
|
|
Durable Goods Orders |
No 6 |
... |
|
May-2026 |
|
| |
|
|
|
Durable Goods Orders |
No 5 |
... |
|
Apr-2026 |
|
| |
|
|
|
Durable Goods Orders |
No 4 |
... |
|
Mar-2026 |
|
| |
|
|
|
Durable Goods Orders |
No 3 |
-1.2 |
|
Feb-2026 |
|
| |
|
|
|
Durable Goods Orders |
No 2 |
0.0% |
|
Jan-2026 |
|
| |
|
|
|
Durable Goods Orders |
No 1 |
-1.4% |
|
Dec-2025 |
|
| |
|
|
|
US November durable goods orders 5.3% vs 3.2% expected. New orders for manufactured durable goods in November,2025 up three of the last four months, increased $16.4 billion or 5.3 percent to $323.8 billion, the U.S. Census Bureau announced today. This followed a 2.1 percent October decrease. Excluding transportation, new orders increased 0.5 percent. Excluding defense, new orders increased 6.6 percent. Transportation equipment, also up three of the last four months, led the increase, $15.3 billion or 14.7 percent to $119.3 billion. |
No 12 |
5.3% |
|
Nov-2025 |
|
| |
|
|
|
|
|
|
|
|
| |
|
|
|
|
|
| |
|
|
|
|
|
|
|
|
|
|
|
|
|
|
|
Brief News | 2025 |
|
|
Durable Goods Orders | Manufacturing |
|
Today's Week |
|
|
|
|
|
|
|
|
|
|
|
|
|
Durable Goods Orders (At 8:30 a.m ET)
| DATE/WEEK |
HIGHLIGHTS |
FOR |
ACTUAL |
|
Durable Goods Orders Release for Nov. 2025 has been Delayed. The federal government has suspended all data compilation during the shutdown. Government Shutdown. |
No 12 |
... |
|
Nov-2025 |
|
| |
|
|
|
Durable Goods Orders Release for Oct. 2025 originally schedule for 26/Nov/2025 at -2.2%.New orders for U.S.-manufactured durable goods dropped by 2.2% to $307.4 billion in October 2025, breaking a two-month rising trend and falling further than the expected 1.5% decline. The decline was primarily driven by a 6.5% drop in transportation equipment ($103.8 billion), particularly a sharp decline in aircraft orders, though core capital goods orders (excluding aircraft and defense) rose 0.5%. |
No 12 |
-2.2% |
|
Oct-2025 |
|
| |
|
|
|
Durable Goods Orders Release for Sep. 2025 originally schedule for 24/Oct/2025 at 0.5%. New orders for U.S.-manufactured durable goods increased 0.5% to \(\$313.7\) billion in September 2025, marking two consecutive months of gains following an upwardly revised 3.0% rise in August. Growth was driven by transportation equipment (+0.4%) and strong demand in electrical equipment, machinery, and primary metals, indicating resilient business investment. |
No 11 |
0.5% |
|
Sep-2025 |
|
| |
|
|
|
Durable Goods Orders Release for Oct. 2025 has been Delayed. The federal government has suspended all data compilation during the shutdown. Government Shutdown. |
No 11 |
0.5% |
|
Oct-2025 |
|
| |
|
|
|
Durable Goods Orders Release for Sep. 2025 has been Delayed. The federal government has suspended all data compilation during the shutdown. Government Shutdown. |
No 10 |
... |
|
Sep-2025 |
|
| |
|
|
|
Demand for U.S. durable goods recovered after two months of declines, driven by a surge in orders for military and civilian aircraft. Total orders for durable goods—which include transportation equipment as well as goods like computers and metal products—rose 2.9% on month in August 2025, having fallen back over the previous two months, data from the Commerce Department showed Thursday. |
No 9 |
2.9% |
|
Aug-2025 |
|
| |
|
|
|
In July, U.S. new orders for manufactured durable goods decreased by 2.8% to $302.8 billion, following a 9.4% decline in June. The reduction was driven by a 9.7% drop in transportation equipment orders, but excluding transportation, orders rose a solid 1.1%. This ex-transportation increase was led by positive trends in sectors like tech, metals, and machinery, indicating underlying strength despite the headline decline. Shipments of durable goods also saw a healthy increase, rising 1.4% in July. Once again, weak nondefense aircraft orders were the key factor; nondefense aircraft orders plunged 33% m/m in July on top of a 53% m/m decline in June.
|
No 8 |
-2.8% |
|
Jul-2025 |
|
| |
|
|
|
U.S. Durable Goods Orders Sink on Lower Aircraft Orders. Total orders for goods made to last at least three years, such as automobiles, planes and electronic equipment, were 9.3% lower in June than in May. Demand for U.S. durable goods fell sharply in June, reversing much of jump in May that was driven by new aircraft orders.Demand for U.S. durable goods fell sharply in June, reversing much of jump in May that was driven by new aircraft ordes. |
No 7 |
-9.3% |
|
Jun-2025 |
|
| |
|
|
|
US new orders for manufactured durable goods experienced a substantial increase of 16.4% in May 2025, reaching $343.6 billion, driven primarily by a surge in transportation equipment, particularly nondefense aircraft and parts. This rebound significantly reversed a revised 6.6% decrease in April and surpassed market expectations for May's growth. |
No 6 |
16.4% |
|
May-2025 |
|
| |
|
|
|
New orders for manufactured durable goods in the United States decreased by 6.3% in April 2025, reaching $296.3 billion, a notable decline following four consecutive monthly increases. This decrease was primarily driven by a significant drop in transportation equipment orders, particularly non-defense aircraft and parts, impacted by trade policy concerns and a front-loading of orders in the prior month, |
No 5 |
-6.3% |
|
Apr-2025 |
|
| |
|
|
|
New orders for manufactured durable goods in the US surged 9.2% month-over-month to $315.7 billion in March 2025, marking the third consecutive monthly increase and far exceeding market expectations of a 2% rise. The sharp uptick was largely driven by a rush in orders for commercial aircraft |
No 4 |
9.2% |
|
Mar-2025 |
|
| |
|
|
|
In February 2025, U.S. durable goods new orders increased by 0.9% to $289.3 billion, driven primarily by a rise in transportation equipment orders. This followed an upwardly revised 3.3% increase in January. Excluding transportation, new orders rose by 0.7%, and excluding defense, they increased by 0.8%. Shipments of manufactured durable goods also saw a rise of 1.2% to $292.3 billion in February. |
No 3 |
0.9% |
|
Feb-2025 |
|
| |
|
|
|
Durable Goods Orders in the US surged 3.1% in January 2025, a rebound from two consecutive monthly decreases and beating market expectations. This increase was primarily driven by a significant jump in transportation equipment, especially nondefense aircraft and parts, and also saw positive contributions from capital goods, primary metals, machinery, computers and electronic products, and electrical equipment. |
No 2 |
3.1% |
|
Jan-2025 |
|
| |
|
|
|
New orders for U.S. durable goods decreased by 2.2% in December 2024, falling to $276.1 billion, a larger decline than the revised 2.0% drop in November, with the decrease primarily driven by a sharp decline in transportation equipment orders, particularly for non-defense aircraft and parts. |
No 1 |
-2.2% |
|
Dec-2024 |
|
| |
|
|
|
|
|
|
|
|
| |
|
|
|
|
|
| |
|
|
|
|
|
|
|
|
|
|
|
|
|
|
|
Brief News | 2024 |
|
|
Durable Goods Orders | Manufacturing |
|
Today's Week |
|
|
|
|
|
|
|
|
|
|
|
|
|
Durable Goods Orders (At 8:30 a.m ET)
| DATE/WEEK |
HIGHLIGHTS |
FOR |
ACTUAL |
|
U.S. Durable Goods Orders Pull Back More Than Expected In November 2024.New orders for U.S. manufactured durable goods slumped by much more than expected in the month of November, according to a report released by the Commerce Department on Monday. The report said durable goods orders tumbled by 1.1 percent in November after climbing by an upwardly revised 0.8 percent in October. Economists had expected durable goods orders to fall by 0.4 percent compared to the 0.3 percent increase that had been reported for the previous month. The bigger than expected decrease by durable goods orders came amid a sharp pullback by orders for transportation equipment, which plunged by 2.9 percent in November after jumping by 1.8 percent in October. |
No 12 |
-1.1% |
|
Nov-2024 |
|
| |
|
|
|
Durable Goods Orders in the US increased $0.7 billion, or 0.2%, to $286.6 billion in October, the US Census Bureau reported on Wednesday. This reading followed the 0.4% decrease (revised from -0.8%) recorded in September and came in worse than the market expectation for an increase of 0.5%. U.S. Durable Goods Orders Rise Less Than Expected In October. The numbers: Orders at U.S. factories posted a tepid increase in October, signaling that an ongoing slump in the industrial side of the economy shows no sign of abating. Durable-goods orders rose 0.2% last month, largely because of new airplane contracts for Boeing. Durable-goods orders barely budge. No sign manufacturing slump is ending. The Commerce Department released a report on Wednesday showing new orders for U.S. manufactured durable goods increased by less than expected in the month of October. The report said durable goods orders rose by 0.2 in October after falling by a revised 0.4 percent in September. |
No 11 |
0.2% |
|
Oct-2024 |
|
| |
|
|
|
New orders for manufactured durable goods in the US decreased by 2.2 billion or 0.8 percent to $284.8 billion in September 2024, following a revised 0.8 percent decline in August and compared with market expectations of a 1 percent fall.While the fall in durable goods orders in September was mostly due to the volatile transportation components, the decline in underlying capital goods shipments will still drag on business equipment investment. The surge in aircraft shipments earlier in the quarter probably prevented overall business equipment from declining in the third quarter, but the weak September data set the stage for a softer fourth quarter. |
No 10 |
|
|
Sep-2024 |
|
| |
|
|
|
Durable-goods orders were flat in August 2024, 0.0%, beating forecasts of a sharp decline. Orders flat vs expectations of a 3% decline. Orders for U.S. durable goods were flat in August, the Commerce Department said Thursday. The result was much better than anticipated. Economists had forecast a 3% fall in orders for durable goods — products made to last at least three years. New orders for U.S. manufactured durable goods were virtually unchanged in the month of August, according to a report released by the Commerce Department on Thursday. The Commerce Department said durable goods orders came in flat in August after soaring by 9.9 percent in July. Economists had expected durable goods orders to tumble by 2.6 percent. |
No 9 |
0.0% |
|
Aug-2024 |
|
| |
|
|
|
Durable goods orders jump in July, boosted by transportation. Orders for long-lasting items such as appliances, aircraft and computers surged in July, pushed by demand for transportation equipment, the Census Bureau reported Monday. So-called durable goods orders soared by 9.9%, reversing a downwardly revised 6.9% slump in June and easily topping the Dow Jones estimate for an increase of 4%. However, excluding the vital transportation category, orders actually declined 0.2%, as the sector posted a 34.8% increase. Excluding defense, orders rose 10.4% after declining 7.5%. |
No 8 |
9.9% |
|
Jul-2024 |
|
| |
|
|
|
New orders for manufactured durable goods in July, up five of the last six months, increased $26.1 billion or 9.9 percent to $289.6 billion, the U.S. Census Bureau announced today. This followed a 6.9 percent June decrease. Excluding transportation, new orders decreased 0.2 percent. Excluding defense, new orders increased 10.4 percent. Transportation equipment, up two of the last three months, drove the increase, $26.4 billion or 34.8 percent to $102.2 billion.. Orders for durable goods — generally big-ticket items such as aircraft, appliances and computers — unexpectedly fell 6.6% in June, compared with the forecast for a 0.3% increase. However, excluding transportation, new orders increased 0.5%. |
No 7 |
-6.6% |
|
Jun-2024 |
|
| |
|
|
|
Small gain in durable goods orders for may-2024-durable-goods. May durable goods orders edged 0.1% higher, beating market expectations. April durable goods orders were revised down to 0.2% from 0.7%. New orders for manufactured durable goods in the United States rose by 0.1% month-over-month in May 2024, following a downwardly revised 0.2% increase in April and better than market forecasts of a 0.1% fall. |
No 6 |
0.1% |
|
May-2024 |
|
| |
|
|
|
Durable goods orders see unexpected increase in April. Demand for long-lasting items such as appliances, cars and airplanes was much stronger than expected in April, the Commerce Department reported Friday. Durable goods orders rose 0.7% for the month, slightly below the 0.8% increase in March but far better than the Dow Jones consensus estimate for a 1% decline. Excluding transportation items, orders still accelerated 0.4%. However, new orders were flat, excluding defense. |
No 5 |
0.7% |
|
Apr-2024 |
|
| |
|
|
|
The number of durable goods orders in the United States went up by 2.6% or $7.3 billion in March, landing at $283.4 billion, a report published by the United States Census Bureau on Wednesday showed. Transportation equipment led the upbeat trend, jumping 7.7% or $6.8 billion in comparison to the previous month, coming in at $95.9 billion. Excluding transportation, new orders grew 0.2% in the reported month. In addition, shipments of manufactured durable goods were unchanged from the month before to stand at $282.4 billion. Unfilled orders for manufactured durable goods advanced by 0.4% or $5.9 billion to $1.40 trillion, while inventories were virtually unchanged at $527.9 billion. |
No 4 |
2.6% |
|
Mar-2024 |
|
| |
|
|
|
Economic data out Tuesday was mixed, showing stronger-than-expected orders for durable goods, but waning consumer confidence. February’s durable goods orders rose higher than consensus Orders for long-lasting goods in the U.S. rose 1.4% in February, higher than the 0.8% economists had predicted, according to StreetAccount. Last month’s core orders, which exclude aircraft, rose at 0.7%, also higher than the 0.5% that had been anticipated. |
No 3 |
1.4% |
|
Feb-2024 |
|
| |
|
|
|
US durable goods orders slump; business investment on equipment appears soft. Durable goods orders fall 6.1% in January. Core capital goods orders rise 0.1%. Orders for long-lasting U.S. manufactured goods fell by the most in nearly four years in January, while business investment on equipment appeared to have eased, signs that the economy lost momentum at the start of the year. |
No 2 |
-6.1% |
|
Jan-2024 |
|
| |
|
|
|
U.S. Durable-Goods Orders Stable in December 2023. Orders for long-lasting U.S. manufactured goods were unexpectedly unchanged in December amid a slump in transportation equipment, but demand elsewhere held up. The Commerce Department's Census Bureau said on Thursday that the unchanged reading in orders for durable goods, items ranging from toasters to aircraft meant to last three years or more, followed a 5.5% rebound in November. Economists polled by Reuters had forecast durable goods orders would rise 1.1%. Orders increased 4.4% on a year-over-year basis in December. Manufacturing, which accounts for 10.3% of the economy, continues to be hamstrung by higher interest rates, which are curbing demand for goods and raising costs for investment. |
No 1 |
0.0% |
|
Dec-2023 |
|
| |
|
|
|
|
|
|
|
|
| |
|
|
|
|
|
| |
|
|
|
|
|
|
|
|
|
|
|
|
|
|
|
Brief News | 2023 |
|
|
Durable Goods Orders | Manufacturing |
|
Today's Week |
|
|
|
|
|
|
|
|
|
|
|
|
|
Durable Goods Orders (At 8:30 a.m ET)
| DATE/WEEK |
HIGHLIGHTS |
FOR |
ACTUAL |
|
Orders for long-lasting U.S. manufactured goods surged in November, boosted by aircraft bookings, but business spending on equipment appeared lackluster amid higher borrowing costs. The Commerce Department's Census Bureau said on Friday that orders for durable goods, items ranging from toasters to aircraft meant to last three years or more, jumped 5.4% last month. Data for October was revised higher to show orders falling 5.1% instead of 5.4% as previously reported. Economists polled by Reuters had forecast durable goods orders rebounding 2.2%. Orders increased 4.5% on a year-over-year basis in November. |
No 12 |
5.4% |
|
Nov-2023 |
|
| |
|
|
|
US durable goods orders fall on weakness in transportation equipment sector. Orders for long-lasting U.S. manufactured goods fell more than expected in October as orders for motor vehicles and parts dropped amid strikes by the United Auto Workers (UAW) union against Detroit's "Big Three" automakers. The Commerce Department's Census Bureau said on Wednesday that orders for durable goods, items ranging from toasters to aircraft meant to last three years or more, dropped 5.4% last month, also weighed down by declines in bookings for civilian aircraft. Data for September was revised lower to show orders for these goods rising 4.0% instead of the previously reported 4.6%. Economists polled by Reuters had forecast durable goods orders would decline 3.1%. Durable goods orders rose 4.0% on a year-over-year basis in October. |
No 11 |
-5.4% |
|
Oct-2023 |
|
| |
|
|
|
US September durable goods orders 4.7% versus 1.7% expected. A sharp rebound in durable goods orders and well above expectations indicative of a rebounding manufacturing sector. The gain comes after 2 months of declines (prior month was revised lower to -0.1%). However 5 of the last 7 months have been higher. The gain was the largest of the year |
No 10 |
|
|
Sep-2023 |
|
| |
|
|
|
US durable goods orders beat expectations in boost to economy in third-quarter. Durable goods orders increase 0.2% in August. Core capital goods orders jump 0.9%; July revised down. Orders for long-lasting U.S. manufactured goods rose in August as an increase in machinery and other products offset a drop in civilian aircraft, and business spending on equipment appeared to regain momentum after faltering early in the third quarter. |
No 9 |
0.2% |
|
Aug-2023 |
|
| |
|
|
|
A 14.3 percent plunge in transportation equipment orders contributed to a 5.2 drop in new orders in July, below Econoday's consensus forecast of a 4.0 percent decrease. June estimate was revised down to 4.4 percent from 4.6 percent. New orders excluding transportation were up 0.5 percent, more than the 0.2 percent consensus, and following a 0.2 percent advance in June. New orders excluding defense were down 5.4 percent. Core capital goods orders, excluding defense and aircraft, edged up 0.1 percent in July after contracting 0.4 percent in June, a slightly better performance than expected. |
No 8 |
-5.2% |
|
Jul-2023 |
|
| |
|
|
|
Orders of big-ticket manufactured items soared past analysts' expectations to grow by almost 5% in June, fueled once more by buoyant transportation equipment orders, according to U.S. government data released Thursday.The surge in new orders in June is the fourth consecutive month of increases, indicating strong demand for durable goods despite an aggressive campaign of interest rate hikes by the U.S. Federal Reserve to tame inflation. On Wednesday, the Fed raised interest rates for an 11th time, and left open the option for more if inflation proved stubborn to bring down to its long-term target of 2%. Manufactured durable goods orders rose by 4.7% in June from a month earlier to $302.5 billion, the Commerce Department announced in a statement. The increase was more than triple the median expectation of a 1.5% rise in orders in a MarketWatch survey of economists. This was largely due to a jump in new orders of transportation equipment, which rose by 12.1%, the Commerce Department said. |
No 7 |
4.7% |
|
Jun-2023 |
|
| |
|
|
|
U.S. durable-goods orders climb for third month in a row but manufacturing slump may not be over. Business investment is rising at a slow pace. Orders for manufactured U.S. goods jumped 1.7% in May and rose for the third month in a row, boosted by strong demand for passenger planes and new autos. Business investment also rose. The recent increase in orders might be a sign that manufacturers have found a bottom, at least temporarily, after slumping in 2022. Orders rise in an expanding economy and shrink in a contracting one. |
No 6 |
1.7% |
|
May-2023 |
|
| |
|
|
|
Orders for items ranging from toasters to aircraft that are meant to last three years or more increased 1.1% last month. These so-called durable goods orders climbed 3.3% in March. Transportation orders rose 3.7% after jumping 9.9% in the prior month. Motor vehicle orders dipped 0.1%, falling for a second straight month.
New orders for key U.S.-manufactured capital goods unexpectedly rebounded in April, raising cautious optimism that business spending on equipment could recover in the second quarter after recent back-to-back declines. Orders for non-defense capital goods excluding aircraft, a closely watched proxy for business spending plans, surged 1.4% last month, the Commerce Department said on Friday. Data for March was revised higher to show these so-called core capital goods declining 0.6% instead of 1.1% as previously reported. Economists polled by Reuters had forecast core capital goods orders would fall 0.2%. Core capital goods orders increased 2.7% on a year-on-year basis in April. |
No 5 |
1.1% |
|
Apr-2023 |
|
| |
|
|
|
While orders for items ranging from toasters to aircraft that are meant to last three years or more surged 3.2% last month, they were driven by the volatile civilian aircraft category, which soared 78.4% after falling 8.4% in February. These so-called durable goods orders dropped 1.2% in February. Boeing (BA.N), opens new tab reported on its website that it had received 60 aircraft orders, sharply up from only five in February. Manufacturing, which accounts for 11.3% of the U.S. economy, is already reeling from the Federal Reserve's fastest interest rate hiking campaign since the 1980s to tame inflation. |
No 4 |
3.2% |
|
Mar-2023 |
|
| |
|
|
|
New orders for manufactured durable goods in February, down three of the last four months, decreased $2.6 billion or 1.0 percent to $268.4 billion, the U.S. Census Bureau announced today. This followed a 5.0 percent January decrease. Excluding transportation, new orders were virtually unchanged. Excluding defense, new orders decreased 0.5 percent. Transportation equipment, also down three of the last four months, drove the decrease, $2.6 billion or 2.8 percent to $89.4 billion. |
No 3 |
-1.0% |
|
Feb-2023 |
|
| |
|
|
|
Durable goods orders drop 4.5% on aircraft. Orders last month were weighed down by a 54.6% plunge in the volatile civilian aircraft category, which followed a 105.6% surge in December. Boeing (BA.N), opens new tab reported on its website that it had received 55 aircraft orders in January, a fraction of the 250 booked in December. Orders for transportation equipment dropped 13.3% after increasing 15.8% in December. Motor vehicle orders gained 0.2%. U.S. core capital goods orders post largest gain in five months; shipments surge. |
No 2 |
-4.5% |
|
Jan-2023 |
|
| |
|
|
|
Orders for long-lasting goods also were much better than expected, rising 5.6% for December, compared with the 2.4% estimate. However, orders fell 0.1% when excluding transportation as demand for Boeing passenger planes helped drive the headline number. A report released by the Commerce Department on Thursday showed new orders for U.S. manufactured durable goods soared by much more than expected in the month of December. The Commerce Department said durable goods orders spiked by 5.6 percent in December after tumbling by 1.7 percent in November. Economists had expected durable goods orders to surge by 2.5 percent compared to the 2.1 percent slump that had been reported for the previous month. Excluding a substantial rebound in orders for transportation equipment, durable goods orders edged down by 0.1 percent in December after inching up by 0.1 percent in November. Ex-transportation orders were expected to come in unchanged. |
No 1 |
5.6% |
|
Dec-2022 |
|
| |
|
|
|
|
|
|
|
|
| |
|
|
|
|
|
| |
|
|
|
|
|
|
|
|
|
|
|
|
|
|
|
Brief News | 2022 |
|
|
Durable Goods Orders | Manufacturing |
|
Today's Week |
|
|
|
|
|
|
|
|
|
|
|
|
|
Durable Goods Orders (At 8:30 a.m ET)
| DATE/WEEK |
HIGHLIGHTS |
FOR |
ACTUAL |
|
U.S. durable-goods orders dropped 2.1% in November 2022. In another report on Friday, the Commerce Department said orders for non-defense capital goods excluding aircraft, a closely watched proxy for business spending plans, rose 0.2% in November. These so-called core capital goods orders increased 0.3% in October. They gained 8.8% on a year-on-year basis. The data is not adjusted for inflation. Slowing price increases, a strong dollar and the shift in spending from goods to services likely contributed to the moderation in core capital goods orders. That is hurting manufacturing, which accounts for 11.3% of the economy. Shipments of core capital goods dipped 0.1% after increasing 1.4% in October. Core capital goods shipments are used to calculate equipment spending in the gross domestic product measurement. Business spending on equipment contributed to the economy's rebound last quarter. |
No 12 |
-2.1% |
|
Nov-2022 |
|
| |
|
|
|
US: Durable Goods Orders rise by 1% in October vs. 0.4% expected. Durable Goods Orders in the US rose more than expected in October. US Dollar Index stays in negative territory below 107.00 after the data. Durable Goods Orders in the US rose by 1%, or by $2.8 billion, on a monthly basis in October to $277.4 billion, the monthly data published by the US Census Bureau revealed on Tuesday. This reading followed September's 0.3% expansion and came in better than the market expectation for an increase of 0.4%. |
No 11 |
1.0% |
|
Oct-2022 |
|
| |
|
|
|
A disappointing report on durable goods orders in September, as the transportation sector overshadowed what was otherwise weakness across the board. New Orders for Durable Goods Rose 0.4% in September. Far and away the largest impact on September durable goods came from the typically volatile categories of commercial aircraft and autos, where orders rose 21.9% and 2.2%, respectively. Strip out transportation, though, and orders declined 0.5% in September, coming in below the consensus expected +0.2%. Every major non-transportation category of orders fell in September. One of the most important pieces of today’s report, shipments of “core” non-defense capital goods ex-aircraft (a key input for business investment in the calculation of GDP), fell 0.5% in September after healthy gains in July and August. |
No 10 |
0.4% |
|
Sep-2022 |
|
| |
|
|
|
US August durable goods orders -0.2% vs -0.4% expected. These numbers were surprisingly weak in July in an early sign of creeping economic weakness. This was better than forecast but is the second month in a row of contraction. That said, it's all concerntrated in volatile air and defense orders, excluding those it was a strong report with a positive revision to last month. New orders for U.S.-manufactured capital goods increased more than expected in August, suggesting that businesses remained keen to invest in equipment despite higher interest rates, which could keep the economy on a moderate growth path. Some of the largest gain in orders in seven months reported by the Commerce Department on Tuesday, however, reflected higher prices. The data suggested that business spending on equipment probably rebounded in the third quarter, further dispelling fears that the economy was in recession. Orders for non-defense capital goods excluding aircraft, a closely watched proxy for business spending plans, surged 1.3% last month. That was the biggest gain since January. Data for July was revised higher to show these so-called core capital goods orders gaining 0.7% instead of 0.3% as previously reported. The data is not adjusted for inflation. |
No 9 |
-0.2% |
|
Aug-2022 |
|
| |
|
|
|
Durable-goods orders flat, but businesses invest more in good sign for U.S. economy. U.S. durable goods orders were unchanged in July, breaking a four-month growth sequence but without appearing to break the underlying growth trend. Durable Goods Orders Remain Unchanged. Preliminary Durable Goods Orders for July was weaker than expected on headline — 0.0% (unched) month over month, down from the +1.0% expected — but bring some reassurances upon deeper examination. |
No 8 |
0.0% |
|
Jul-2022 |
|
| |
|
|
|
June 2022 New Orders for Durable Goods increased 1.9% . New orders for manufactured durable goods in June increased $5.0 billion or 1.9 percent to $272.6 billion, the U.S. Census Bureau announced. U.S. durable goods orders were through the roof in June, smashing through economists forecasts which were predicting a decline. The overall numbers were up 1.9% for the month, against a economists poll from the Wall Street Journal which had predicted a decline of 0.4%. |
No 7 |
1.9% |
|
Jun-2022 |
|
| |
|
|
|
Durable goods orders gain 0.7%; shipments up 1.3%. Orders for durable goods, items ranging from toasters to aircraft that are meant to last three years or more, advanced 0.7% in May after rising 0.4% in April. They were lifted by a 0.8% gain in orders for transportation equipment, which followed a 0.7% increase in April. New orders for U.S.-made capital goods and shipments increased solidly in May, pointing to sustained strength in business spending on equipment in the second quarter, but rising interest rates and tighter financial conditions could slow momentum. |
No 6 |
0.7% |
|
May-2022 |
|
| |
|
|
|
U.S. Durable Goods Orders Climb 0.4% In April, Less Than Expected. A report released by the Commerce Department on Wednesday showed new orders for U.S. manufactured durable goods increased by less than expected in the month of April. The Commerce Department said durable goods orders rose by 0.4 percent in April after climbing by a downwardly revised 0.6 percent in March. Economists had expected durable goods orders to advance by 0.6 percent compared to the 1.1 percent jump that had been reported for the previous month. |
No 5 |
0.4% |
|
Apr-2022 |
|
| |
|
|
|
Orders placed with U.S. factories for durable goods rose in March, pointing to sustained investment in business equipment that is helping drive economic growth. Bookings for durable goods -- items meant to last at least three years -- increased 0.8% in March , ledss than expected of 1%, after a revised 1.7% decline a month earlier, Commerce Department figures showed Tuesday. The figures aren’t adjusted for inflation. The value of core capital goods orders, a proxy for investment in equipment that excludes aircraft and military hardware, rose by a larger-than-forecast 1%. The median estimates in a Bloomberg survey of economists called for a 1% increase in all durable goods and a 0.5% gain in the core figure. Stocks fell in early trading as investors monitor corporate earnings, and the yield on the 10-year Treasury note declined. |
No 4 |
0.8% |
|
Mar-2022 |
|
| |
|
|
|
US durable goods orders slip in February, marking first decline in 5 months. Orders at U.S. factories for long-lasting goods fell more than expected in February 2022, snapping a months-long streak of increases and business investment as manufacturers confronted a worsening supply-chain crisis. Bookings for all durable goods – products that are intended to last at least three years – fell 2.2%, the first decline in five months, the government reported on Thursday. Economists surveyed by Refinitiv forecast a 0.5% decline. |
No 3 |
-2.2% |
|
Feb-2022 |
|
| |
|
|
|
Orders for durable goods reflected the buoyant spending, rising 1.6% in January 2022 or double the expectation. Durable Orders report also brought more better than expected news: Orders for long-lasting goods jumped 1.6% in January 2022, compared to the outlook for a 0.8% gain. |
No 2 |
1.6% |
|
Jan-2022 |
|
| |
|
|
|
Durable goods orders, up 2.6 percent (revised from 2.5 percent), jumped sharply in November with December's consensus at a decrease of 0.5 percent. Both ex-transportation and core capital goods orders are seen up 0.4 percent. Also, orders for long-lasting goods declined 0.9% for December 2021, worse than the estimate for a 0.6% drop. Orders for durables hit their lowest point since April 2020, reflecting an end-of-year slowdown as omicron cases skyrocketed.. |
No 1 |
-0.9% |
|
Dec-2021 |
|
| |
|
|
|
|
|
|
|
|
| |
|
|
|
|
|
| |
|
|
|
|
|
|
|
|
|
|
|
|
|
|
|
Brief News | 2021 |
|
|
Durable Goods Orders | Manufacturing |
|
Today's Week |
|
|
|
|
|
|
|
|
|
|
|
|
|
Durable Goods Orders (At 8:30 a.m ET)
| DATE/WEEK |
HIGHLIGHTS |
FOR |
ACTUAL |
|
New orders for US manufactured durable goods rose 2.5 percent month-over-month in November of 2021, extending gains from a revised 0.1 percent increase in October and compared to market expectations of a 1.6 percent increase.
New orders for U.S.-made capital goods unexpectedly fell in November while shipments rose modestly, suggesting that shortages were hampering business spending on equipment. Orders for non-defense capital goods excluding aircraft, a closely watched proxy for business spending plans, dipped 0.1% last month, the Commerce Department said on Thursday. These so-called core capital goods orders shot up 0.9% in October. Economists polled by Reuters had forecast core capital goods orders rising 0.6%. |
No 12 |
2.5% |
|
Nov-2021 |
|
| |
|
|
|
New orders for US manufactured durable goods fell 0.5 percent month-over-month in October of 2021, after a 0.4 percent decrease in September and compared to market expectations of a 0.2 percent increase. |
No 11 |
-0.5% |
|
Oct-2021 |
|
| |
|
|
|
U.S. durable-goods orders decline in September, pulled lower. Oct 27, 2021 — Durable-goods orders fell 0.4% in September, the first decline after four straight gains, the Commerce Department said Wednesday. New orders for manufactured durable goods in September decreased $1.0 billion or 0.4% to $261.3 billion, the U.S. Census Bureau announced today. This decrease, down following four consecutive monthly increases, followed a 1.3% August increase. Excluding transportation, new orders increased 0.4%. Excluding defense, new orders decreased 2.0% |
No 10 |
-0.4% |
|
Sep-2021 |
|
| |
|
|
|
Orders for durable goods, items ranging from toasters to aircraft that are meant to last three years or more, accelerated 1.8% in August 2021 after climbing 0.5% in July. They were boosted by a 5.5% rebound in orders for transportation equipment, which followed a 0.4% fall in July. Strong U.S. business spending on equipment seen underpinning GDP growth in Q3.New orders and shipments of key U.S.-made capital goods increased solidly in August amid strong demand for computers and electronic products, keeping business spending on equipment on track for another quarter of robust growth. The sustained strength in business investment is expected to limit the hit on economic growth from an anticipated slowdown in consumer spending in the third quarter as the boost from fiscal stimulus fades and COVID-19 infections flare up. Demand for goods is being driven by businesses desperate to replenish inventories, but strained supply chains remain a challenge. |
No 9 |
1.8% |
|
Aug-2021 |
|
| |
|
|
|
Orders for durable goods, items ranging from toasters to aircraft that are meant to last three years or more, dipped 0.1% in July 2021 after rising 0.8% in June 2021. They were pulled down by a 2.2% decline in orders for transportation equipment, which followed a 1.4% increase in June. U.S. business equipment spending strong even as new orders flat in July. Core capital goods orders flat in July; June revised up. Core capital goods shipments increase 1%. Durable goods orders fall 0.1%. New orders for key U.S.-made capital goods were unexpectedly flat in July amid supply constraints and a shift in demand to services, suggesting that business spending on equipment could slow in the second half after robust growth over the past year. Still, business investment in equipment remains strong, with the report from the Commerce Department on Wednesday showing shipments of these capital goods accelerating last month. Orders are 18% above their pre-pandemic levels. Investment in equipment is expected to help offset cooling consumer spending and keep the economy on a solid growth path this quarter. |
No 8 |
-0.1% |
|
Jul-2021 |
|
| |
|
|
|
Durable Goods Orders for June 2021 came out this morning — a classic “good news/bad news” scenario. Though the headline numbers was expected to be +2.0% for the month, it only made it to +0.8%. That’s the bad news. Revisions to May’s headline, however, were significant: +3.2% versus the +2.3% originally reported. New orders for durable goods rose 0.8% in June 2021 (+1.7% including revisions to prior months), falling short of the consensus expected gain of 2.2%. Orders excluding transportation increased 0.3% in June (+0.6% including revisions),, below the consensus expected +0.8%. Orders are up 29.3% from a year ago, while orders excluding transportation are up 19.6%. |
No 7 |
0.8% |
|
Jun-2021 |
|
| |
|
|
|
U.S. Durable Goods Orders Rise 2.3% in May 2021. Orders to U.S. factories for big-ticket manufactured goods rose for the 12th time in the last 13 months in May 2021, pulled up by a surge in demand for civilian aircraft. The Commerce Department said Thursday that orders for durable goods — meant to last at least three years — climbed 2.3% in May, reversing a 0.8% drop in April and coming despite a backlogged supply chain and a shortage of workers. Orders for aircraft shot up 27.4% last month after climbing 31.5% in April. Excluding transportation orders — which can bounce wildly from month to month — durable goods orders rose 0.3% last month, down from a 1.7% gain in April.. |
No 6 |
2.3% |
|
May-2021 |
|
| |
|
|
|
U.S. Durable Goods Orders Drop 1.3% in April 2021. U.S. orders for big-ticket manufactured goods dropped unexpectedly in April for the first time in 11 months, pulled down by plunging orders for transportation equipment. The Commerce Department reported Thursday that orders for factory goods meant to last at least three years fell 1.3% in April after rising 1.3% in March. Transportation orders skidded 6.7%. Excluding transportation, which can swing sharply from month to month, durable goods orders were up 1% in April. Factories have been hamstrung by a shortage of supplies as the U.S. economy reopens from the COVID-19 pandemic and demand for goods and services rebounds rapidly. Orders for auto parts, disrupted by a shortage of computer chips, dropped 6.2% in April. Orders for military capital goods dropped 25.8% after falling 11.7% in March. Economists had expected durable goods orders to rise about 0.7% last month. Despite the unexpected decline, the April report also contained hopeful signs: A category that tracks business investment — orders for nondefense capital goods excluding aircraft — increased 2.3% last month on top of a 1.6% gain in March. |
No 5 |
-1.3% |
|
Apr-2021 |
|
| |
|
|
|
U.S. orders for long-lasting durable goods rebounded in March 2021 after a poor showing in the prior month, but shortages of key supplies are still hampering manufacturers as they race to keep up with rising demand from customers. Orders for durable goods rose 0.5% last month, the government said Monday. These are products such as electronics, appliances, machines, cars and other transportation equipment meant to last at least three years. Economists surveyed by Dow Jones and the Wall Street Journal had forecast a 2.2% increase. Orders would have been three times stronger in March, however, if not for a sharp drop in bookings for commercial and military aircraft. Orders had decline in February for the first time since the pandemic began, mostly because of unusually harsh winter weather and a sharp drop in auto production owing to a shortage of key computers chips. |
No 4 |
0.5% |
|
Mar-2021 |
|
| |
|
|
|
U.S. durable-goods-orders decline is first in 10 months. Orders for U.S. durable goods unexpectedly declined in February 2021 for the first time in nearly a year, indicating a pause in the months-long manufacturing rebound. Bookings for durable goods -- or items meant to last at least three years -- decreased 1.1% from the prior month, the first drop since April, after an upwardly revised 3.5% gain in January, Commerce Department figures showed Wednesday.Core capital goods orders, a category that excludes aircraft and military hardware and is seen as a barometer of business investment, dropped 0.8% after an upwardly revised 0.6% gain. The median estimates in a Bloomberg survey of economists called for 0.5 |
No 3 |
-1.1% |
|
Feb-2021 |
|
| |
|
|
|
U.S. durable-goods orders climb 3.4% in January 2021. U.S. manufacturers in January booked the biggest increase in orders in six months, pointing to an economy that is gaining steam again after a letdown at the end of 2020. Orders for durable goods — products meant to last at least three years — rose 3.4% in January, the government said Thursday. Economists surveyed by Dow Jones and the Wall Street Journal had forecast a 1% advance. Orders for manufacturers have now returned to precrisis levels, reflecting in large part a major shift among consumers toward the purchase of goods such as new cars, houses, appliances, electronics and so forth. Americans are spending a lot less on services. |
No 2 |
3.4% |
|
Jan-2021 |
|
| |
|
|
|
Growth in demand for long-lasting manufactured goods slowed in December 2020, as the overall economic recovery lost momentum at the end of last year. New orders for durable goods—products designed to last at least three years—increased 0.2% to a seasonally adjusted $245.3 billion in December compared with November, the Commerce Department reported Wednesday. That was the eighth straight month of gains, although the increase was the smallest since last August. U.S. Durable-Goods Orders rose less than forecast in December 2020.Four times as many jobs were lost last year due to the coronavirus pandemic as during the worst part of the global financial crisis in 2009, a U.N. report said Monday. |
No 1 |
0.2% |
|
Dec-2020 |
|
| |
|
|
|
|
|
|
|
|
| |
|
|
|
|
|
| |
|
Legends: |
|
Delayed |
|
Positive View |
|
Negative View |
|
Neutral View |
|
Non Available |
|
|
|
|
|
|
|
|
|
|
|
|
|
|
|
|
|
|
|
|
| |
|
|
|
|
|
|
|
|
|
|
|
|
|
|
|
|
|
|
|
|
|
Definitions | Explain |
|
|
Durable Goods Orders | Manufacturing |
|
Today's Week |
|
|
|
|
|
|
|
|
|
|
|
|
| |
|
|
|
|
| |
|
| DURABLE GOODS ORDERS |
What is it?
Durable goods are items ranging from toasters to aircraft that are meant to last three years or more.
Durable goods orders are a leading indicator of manufacturing. Though orders tend to be volatile. New Durable Goods Order measures the strength of manufacturing.
Durable goods are designed to last three or more years including:
- airplanes
- machine parts for factories,
- cars and buses,
- cranes,
- appliances, etc.
The number of new orders is a gauge to manufacturing strength because these are the first type of goods to be effected by economic shift.
Consumers need to be very optimistic to purchase a car compared to daily necessities such as clothes. Therefore they can also hold off these goods first in economic downturns.
Why is it important?
Durable goods orders are a leading indicator of industrial production and capital spending like business spending on equipment. Durables orders are living up to their reputation as one of the U.S.'s most volatile monthly indicators. Remember, Durable goods is defined as goods whose intended lifespan is three years or more.
In theory the durable goods orders series should be one of the more important indicators of the economy's health. But its susceptibility to major revisions of the previous monthly data suggestions caution in taking the data for any particular month too seriously.
One can compare the trend growth rate in New orders for U.S. durable goods those lasting longer than three years, such as automobiles and kitchen appliances, with that of the PPI for finished goods to assess the growth rate in real orders.
Durable Goods
In economics, a durable good or a hard good is a good that does not quickly wear out, or more specifically, one that yields utility over time rather than being completely consumed in one use.
Most economists will pay closer attention to orders for so-called core capital goods computers, machinery and other goods that signal business investment plans. In other words, durable good orders can show a sign that companies are boosting investment.
Orders for durable goods, items expected to last at least three years, are a barometer of U.S. growth and give an indication of how well the economy is performing. Orders spike when growth accelerates and sag when the economy weakens
Nondurable goods
Nondurable goods or soft goods (consumables) are the opposite of durable goods. They may be defined either as goods that are immediately consumed in one use or ones that have a lifespan of less than 3 years.
Examples: cosmetics and cleaning products, food, fuel, office supplies, packaging and containers, paper and paper products, personal products, rubber, plastics, textiles, clothing and footwear.
While durable goods can usually be rented as well as bought, nondurable goods generally are not rented.
Core Capital Goods / Ex-Transportation Orders
Bookings for major transportation items such as airliners and large trucks are uneven from month to month and can mask underlying trends. Orders for military weapons and equipment can have the same effect.
As a result, economists pay close attention to another category of orders known as core capital goods.
Bookings for these goods, which strip out defense and transportation, tend to provide a clearer idea of how well the overall manufacturing sector is doing
Data
Monthly fluctuations in durable goods orders are frequent and large and skew the underlying trend in the data. In fact, even the yearly change must be viewed carefully because of the volatility in this series.
Durable goods are items that are expected to last at least three years. Orders can be volatile from month to month. |
|
|
| |
|
|
|
|
|
|
|
|
|
|
|
|
|
|
|
|
|
|
|
|
|
Data | Source |
|
|
Durable Goods Orders | Manufacturing |
|
Today's Week |
|
|
|
|
|
|
|
|
|
|
|
|
| |
|
|
|
|
|
|
| DATA INFORMATION |
DURABLE GOODS ORDERS |
| SOURCE |
Institute for Supply Management. |
| WEB |
www.hts.com |
| FREQUENCY |
Monthly |
| AVAILABILITY |
The first business day of the month. |
| COVERAGE |
Data are for the previous month. Data for June are released in July. |
| REVISIONS |
Yes |
| IMPORTANCE |
Manufacturing - Very Important |
|
| |
|
|
|
|
|
|
|
|
|
|
|
|