 |
 |
|
|
|
Week 30 -2012 | From Jul 23 to Jul 27, 2012 |
|
 |
|
|
|
|
|
|
| |
|
|
|
|
|
|
|
|
|
|
| |
Economic Data for Week 30-2012 | Global View | Week Rating
| DATE |
DAY |
REPORT/CATEGORY |
HIGHLIGHTS ON WEEK 30-2012 |
LAST |
|
Mon |
Chicago Fed Nat Activity Index |
The economy did not fall of a cliff in June. The June 2012 (CFNAI) release shows the 3 month moving average improved somewhat but has remained for the last 4 months in negative territory. |
N/A |
|
 |
Growth |
The CFNAI improved to -0.15 in June from a revised - 0.48 in May, while its more-representative three-month moving average rose to -0.20 from -0.38. |
|
|
Mon |
China Flash PMI |
At 10:30 am China Time, July 24, 2012. The HSBC Flash China manufacturing purchasing managers index (PMI) rose to 49.5 in July from 48.2 in June, rising close to the 50 level that divides expansion from contraction. The increase was driven by a jump in the output sub-index to 51.2 - the best showing since October 2011. |
|
|
 |
Growth |
China's manufacturing output in July grew at its fastest pace in nine months, helping lift an index of activity in the country's overall factory sector to its highest level since February, a survey on Tuesday showed. |
|
|
Thu |
HSBC China Flash PMI |
July flash manufacturing PMI reading was 49.5, and up from June's final reading of 48.2. The July reading was a five month high. A reading below 50 indicates contraction. The important manufacturing output index climbed to a nine month high of 51.2 from 49.3 in June. This reading has changed direction and now shows expansion.�
|
|
|
 |
China |
The flash reading contains only directional indications. For example although output is now expanding, both new orders and new export orders are contracting albeit at a slower pace while employment is contracting at a faster pace. Both output prices and input prices were declining at a slower rate. According to Markit, the improvement in the overall index suggests that the earlier easing measures are beginning to work.� |
|
|
Tue |
ICSC Goldman Sachs Index |
The International Council of Shopping Centers and Goldman Sachs Retail Chain Store Sales Index edged up 1% in week 29, july 21. |
1.0% |
|
|
Sales and Inventories |
Retail Sales improved over the prior week, but continued a choppy and uneven performance across retail categories, adding back-to-school categories got a boost. |
|
|
Tue |
Johnson Redbook |
Redbook Research reported that same-store sales increased 1.3% over the prior year for the third week of July, the weakest performance in over 15 months and following a 1.7% gain in the prior week. |
1.3% |
|
|
Sales and Inventories |
Month-to-date, sales increased 1.7% compared to last year and fell 1.3% relative to June. Redbook said �Sales were below plan in the third week. |
|
|
Tue |
FHFA House Price Index |
Home prices climbed 0.8% on a seasonally adjusted basis in May, following a revised 0.7% increase in April, the Federal Housing Finance Agency said Tuesday. More progress is being made in the housing sector as home prices are actually having a string of gains. |
|
|
|
Real Estate |
From May 2011 to May 2012, prices rose 3.7%, the agency said, although the index is still 17% below its all-time peak set in April 2007. |
|
|
Wed |
MBA purchase Applications |
The MBA's seasonally adjusted index of refinancing applications posted the biggest jump in seven months, rising 21.6% as mortgage interest rates hit record lows. |
N/A |
|
|
Real Estate |
Applications for U.S. home mortgages jumped last week on a surge in demand for refinancing, though purchase activity edged down, an industry group said on Wednesday. |
|
|
Wed |
New Home Sales |
The Commerce Department said sales of new homes plunged 8% last month, the steepest drop since February last year. |
350K |
|
|
Real Estate |
Sales in the Northeastern U.S. plummeted 60%. The decline suggests a weaker job market is dampening any pickup in the industry.� |
|
|
Wed |
EIA Crude Oil Report |
Domestic stocks of crude, excluding oil held in the Strategic Petroleum Reserve, rose unexpectedly by 2.72 million barrels to 380.11 million barrels in the week to July 20, the Energy Information Administration reported. |
N/A |
|
|
Commodity |
The rise in crude stocks came as U.S. crude imports rose 695,000 barrels per day to 9.59 million bpd. U.S. crude oil futures fell after the data. By 10:35 a.m. EST (1335 GMT), they were down 85 cents at $87.65 per barrel. |
|
|
Thu |
Jobless/Initial Claims |
US unemployment aid applications fall by 35,000 to 353,000, reversing previous week's gain. . A more accurate barometer of labor-market trends, the four-week claims average, declined by 8,750 to 367,250,000, the Labor Department said Thursday. |
353,000 |
|
|
Employment |
The number of people who filed applications for unemployment benefits fell by 35,000 last week to a seasonally adjusted 353,000, marking the third straight week of sharp swings that reflects the government's difficulty in assessing employment levels in the auto industry |
|
|
Thu |
Durable Goods Orders |
Orders for U.S. durable goods climbed more than projected in June as a surge in demand for aircraft and military hardware overshadowed a slump in business equipment spending. �Orders�excluding�the volatile transportation category unexpectedly dropped 1.1% in June, the most in five months. |
|
|
|
Manufacturing |
Overall orders increased 1.6% as demand for aircraft surged, after an upwardly revised 1.6% increase the prior month. Details of the report were generally weak. |
|
|
Tue |
FHFA House Price Index |
U.S. house prices rose 0.8% on a seasonally adjusted basis from April to May, according to the FHFA�s monthly House Price Index. The previously reported 0.8% increase in April was revised downward to a 0.7% increase. |
0.8% |
|
|
Real Estate |
For the 12 months ending in May of 2012, U.S. prices rose 3.7%. The U.S.index is 17.0% below its April 2007 peak and is roughly the same as the May 2004 index level. |
|
|
Thu |
Pending Home Sales |
Home buyers signed fewer contracts to buy existing homes in June, despite renewed optimism in the overall housing recovery. |
|
|
|
Real Estate |
The pending home sales index from the National Association of Realtors fell 1.4% from May. It is up 9.5% from June of 2011. |
|
|
Thu |
EIA Natural Gas Report |
The Energy Department's Energy Information Administration reported that natural gas in storage grew by 26 billion cubic feet to 3.189 trillion cubic feet for the week ended July 20. |
N/A |
|
|
Commodity |
According to EIA, the build in the comparable week last year was 48 billion cubic feet. The five-year average for that week is an increase of 61 billion cubic feet. |
|
|
Thu |
Fed Balance Sheet |
The Fed's balance sheet - a broad gauge of its lending to the financial system - stood at $2.833 trillion on July 25, down from $2.842 trillion the previous week. |
N/A |
|
|
Government |
The U.S. Federal Reserve's balance sheet shrank in the latest week, Fed data released on Thursday showed. |
|
|
Thu |
M2 Money Supply |
|
N/A |
|
|
Money Supply |
|
|
|
Fri |
Fixed Mortgage Rates |
30-year fixed-rate mortgage (FRM) averaged 3.49% with an average 0.7 point for the week ending July 26, 2012, down from last week 3.53%. Last year at this time, the 30-year FRM averaged 4.55% . |
3.49%
APR
|
|
|
Interest Rates |
15-year FRM this week averaged 2.80% with an average 0.7 point, down from last week when it averaged 2.83%. A year ago at this time, the 15-year FRM averaged 3.66%. |
|
|
Fri |
Gross Domestic Product (GDP) |
Gross domestic product, the value of all goods and services produced in the U.S., rose at a sluggish 1.5% clip in the second quarter. Weak consumer spending was the main reason the economy grew at an annual pace of just 1.5% in the April-June quarter. |
1.5% |
|
|
Growth |
The U.S. economy took a turn for the worse in the spring as consumers pared spending and businesses invested at a slower pace, with little sign growth will sharply accelerate anytime soon. |
|
|
Fri |
Consumer Sentiment |
Despite a slight upward revision from the preliminary report, a gauge of consumer sentiment in July came in at the lowest point of the year, according to an indicator released Friday. |
72.3
Level |
|
|
Consumer |
The University of Michigan-Thomson Reuters final reading of consumer sentiment reached 72.3, up from an initial read of 72 but below the 73.2 of June. |
|
|
|
|
|
|
|
|
|
|
|
|
|
|
|
|
|
|
|
|
|
|
|
|
|
|
| |
|
|
|
|
|
| |
|
|
|
|
|
| |
|
|
|
|
|
|
|
|
|
|
| |
|
| WEEK 30-2012 ENDING JUL. 27 |
Reports Commentary
We find both positive and negative turns in store sales this morning, as the ICSC-Goldman reports an increase in year over year growth to 2.8%, from 2.4% Y/Y last week, and the Redbook reports a decrease in Y/Y growth down to 1.6%, from 2.3% Y/Y last wee.
us of $75 billion in September, Treasury said in its monthly budget statement, the second monthly surplus of the fiscal year and the biggest surplus since April 2008. The government’s fiscal year runs from October 1 to September 30.The full-year figure comes about a month before voters go to the polls and choose President Barack Obama or former Massachusetts Gov. Mitt Romney for the White House. Deficit reduction has been a major component of the 2012 presidential race, with Romney frequently citing Obama-era shortfalls. Both men pledge to cut the deficit but differ dramatically on how: Obama wants Bush-era tax cuts on wealthy earners to expire; Romney would attack the deficit with spending cuts. |
|
| |
|
|
|
|
|
|
|
|
|
|
|
|
|
|
|
|
|
|
|
|
|
|
|
|
|
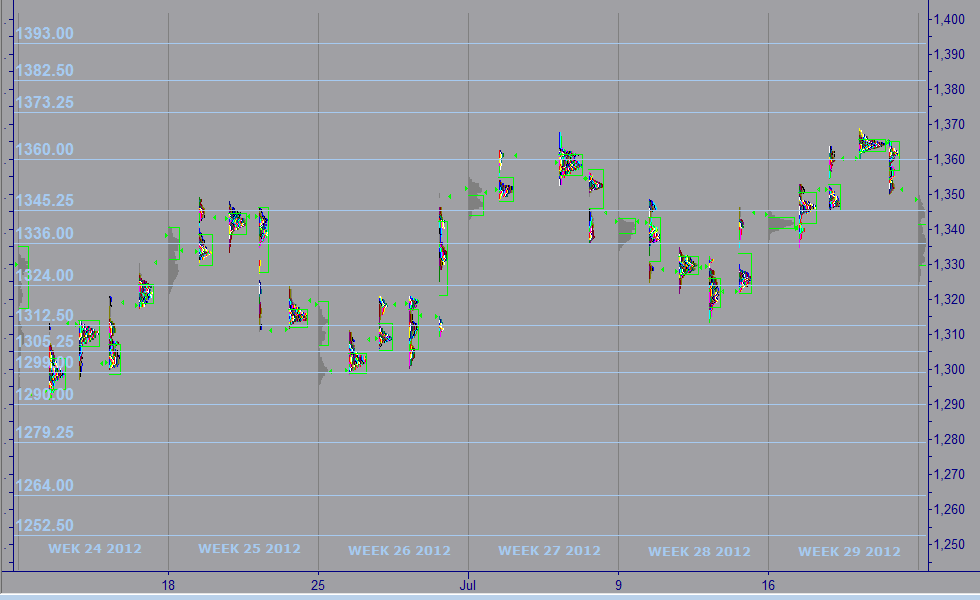
| MARKET PROFILE |
 |
WEEKS 2012 |
WEEK 30 |
% FROM CLOSE |
% FROM OPEN |
 |
RESISTANCE 1 |
1,330.25 |
1.39% |
1.35% |
|
RESISTANCE 2 |
1,326.25 |
1.08% |
1.04% |
 |
CLOSE MAR 02 |
1,350.00 |
|
|
|
OPEN MAR 04 |
1,255.00 |
0.04% |
|
 |
SUPPORT 1 |
1,289.00 |
0.66% |
0.62% |
|
SUPPORT 2 |
1,283.50 |
0.08% |
0.04% |
|
|
|
|
|
|
|
|
|
| |
|
|
|
|
|
| |
|
|
|
|
|
|
IMPORTANT NOTE: In an effort to comply with all applicable rules, regulations and disclosures please be so kind and read the "General Disclosure" below: |
| |
|
|
|
|
| GENERAL DISCLOSURE - TRADINGVESTING.COM |
- The material contained on our Website and Economic Calendar must be used at your own risk. Material is believed to be reliable, but we do not guarantee its accuracy or validity, nor is Tradingvesting.com responsible for any errors or omissions which may occur. The analysis and/or recommendations made by Tradingvesting.com do not provide, imply, or otherwise constitute a guarantee of performance. All contents and recommendations are based on data and sources believed to be reliable, but accuracy and completeness cannot be guaranteed. It should not be assumed that future results will be profitable or will equal past performance, real, indicated or implied.Tradingvesting.com website and material contained therein is not a solicitation to participate in the Futures/Stocks/Options Market. This Economic Calendar does not include Earning Releases, Announced Stock Splits, Upcoming Initial Public Offerings with Underwritings or Rating Changes. Tradingvesting.com has attempted to verify the information contained in this calendar. However, any aspect of such info may change without notice. Unless indicated otherwise: economic data is from the U.S and intraday data is at least 20 minutes delayed; all prices are in the local currency; Time is U.S. Eastern Time. Furthermore, there is a very high degree of risk involved in trading.Tradingvesting.com assumes no responsibilities for your trading and investment results, please red our Risk Disclosure.
- Tradingvesting.com does not provide investment advice, and does not represent that any of the information or related analysis is accurate or complete at any time. All information on this website are for educational purposes only and are not intended to provide financial advice. Any statements about profits or income, expressed or implied, do not represent a guarantee. Your actual trading may result in losses as no trading system is guaranteed. You accept full responsibilities for your actions, trades, profit or loss, and agree to hold Tradingvesting.com and any authorized distributors of this information harmless in any and all ways. We respect your right to privacy, please click here to view our privacy policy.
- U.S. Government Required Disclaimer - Commodity Futures Trading Commission.
Futures and options trading has large potential rewards, but also large potential risk. You must be aware of the risks and be willing to accept them in order to invest in the futures and options markets. Don't trade with money you can't afford to lose. This website is neither a solicitation nor an offer to Buy/Sell futures or options. No representation is being made that any account will or is likely to achieve profits or losses similar to those discussed on this website. The past performance of any trading system or methodology is not necessarily indicative of future results.
- CFTC rule 4.41:Hypothetical or simulated performance results have certain limitations. Unlike an actual performance record, simulated results do not represent actual trading. Also, since the trades have not been executed, the results may have under-or-over compensated for the impact, if any, of certain market factors, such as lack of liquidity. Simulated trading programs in general are also subject to the fact that they are designed with the benefit of hindsight. No representation is being made that any account will or is likely to achieve profit or losses similar to those shown.
- Risk Warning: Trading foreign exchange on margin carries a high level of risk, and may not be suitable for all investors. The high degree of leverage can work against you as well as for you. Before deciding to invest in foreign exchange you should carefully consider your investment objectives, level of experience, and risk appetite. The possibility exists that you could sustain a loss of some or all of your initial investment and therefore you should not invest money that you cannot afford to lose. You should be aware of all the risks associated with foreign exchange trading, and seek advice from an independent financial advisor if you have any doubts. Our linking to these sites does not constitute an endorsement of any products, services or the information found on them. Once you link to another site you are subject to the policies of the new site. By using this site, you agree to the Terms of Service, Privacy Policy and Risk Disclosure. Copyright � 2012 Tradingvesting, LLC. All rights reserved. If you have any questions regarding the Online Economic Calendar application, please contact us: click here.
THIS BRIEF STATEMENT CANNOT, OF COURSE, DISCLOSE ALL THE RISKS AND OTHER ASPECTS OF THE COMMODITY MARKETS AND EQUITY MARKETS. PLEASE READ MORE AT: TERMS OF SERVICE.
|
|
|
| |
|
|
|
|
|
| |
|
|
|
|
|