 |
 |
|
 |
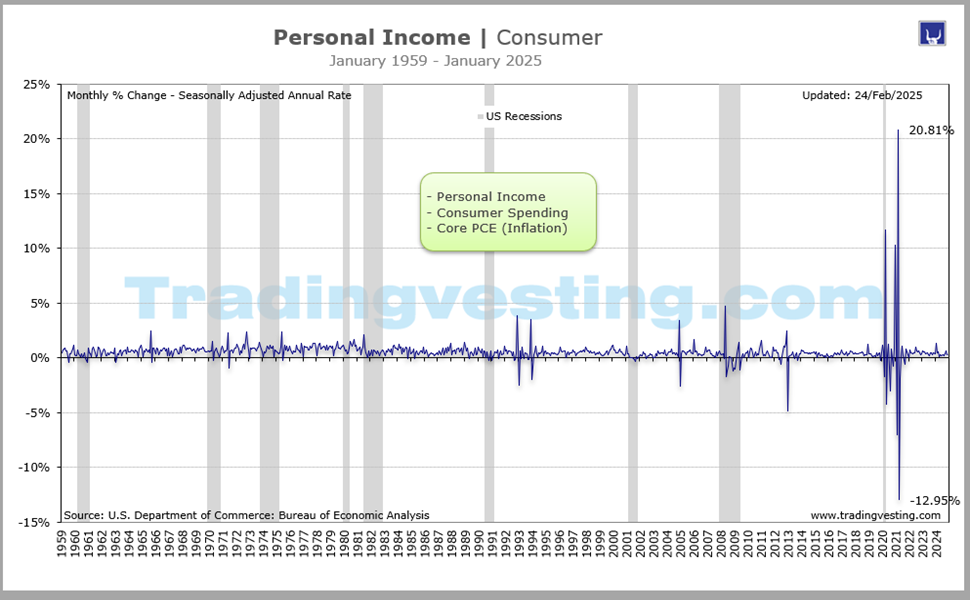
Personal Income | Consumer |
|
 |
|
Personal Consumption Expenditures. Consumer spending, Real PCE, is a major driver of the economy. Increased buying of both goods and services contributed to an upward revision in GDP.Read More...
|
|
|
|
|
|
|
| |
|
| |
 5. Personal Income (5 of 5) 5. Personal Income (5 of 5) 1. Consumer Confidence Index (1 of 5) 1. Consumer Confidence Index (1 of 5) 2. Consumer Sentiment Michigan (2 of 5) 2. Consumer Sentiment Michigan (2 of 5)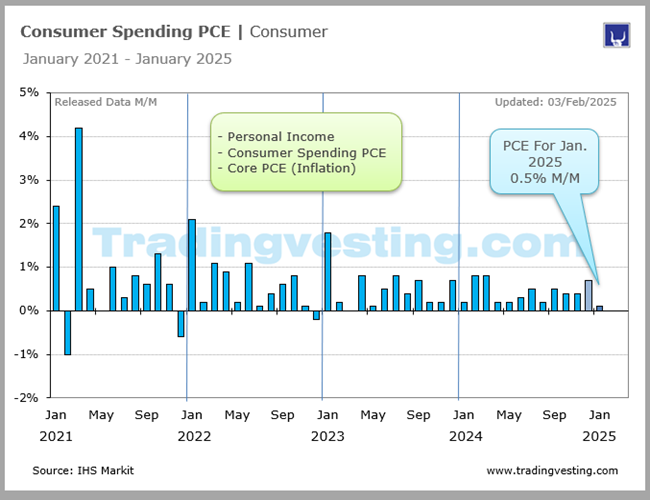 3. Consumer Spending / Real PCE (3 of 5) 3. Consumer Spending / Real PCE (3 of 5) 4. Cosumer Credit (4 of 5) 4. Cosumer Credit (4 of 5)
|
 |
|
|
|
|
| |
|
→ Big Chart |
|
→ Release |
|
| |
|
|
|
|
|
|
|
|
|
|
|
|
|
|
|
|
|
|
|
 |
|
Big Chart | Large Data |
 |
|
Personal Income | Consumer |
|
Today's Week |
 |
|
|
|
|
|
|
|
|
|
|
|
|
|
| |
|
|
|
|
|
|
|
|
|
|
|
|
|
| |
|
|
|
|
|
|
|
|
|
|
|
|
|
|
|
|
|
|
|
|
|
Release Schedule | 2026 |
|
|
Personal Income | Consumer |
|
Today's Week |
|
|
|
|
|
|
|
|
|
|
|
|
|
Personal Income
(At 8:30 a.m ET)
| SCHEDULE 2026 |
No 1 |
No 2 |
No 3 |
No 4 |
No 5 |
No 6 |
No 7 |
No 8 |
No 9 |
No 10 |
No 11 |
No 12 |
| Release | Week |
|
|
|
|
|
|
|
|
|
|
|
|
| Release | Date |
|
|
|
|
|
|
|
|
|
|
|
|
| Release | Day |
|
|
|
|
|
|
|
|
|
|
|
|
 |
|
|
|
|
|
|
|
|
|
|
|
|
| Prior M/M: |
0.3% |
0.3% |
0.4% |
-0.1% |
0.6% |
... |
... |
... |
... |
... |
... |
... |
| Prior Revised: |
0.4% |
... |
... |
0.0% |
0.5% |
... |
... |
... |
... |
... |
... |
... |
| CONSENSUS |
0.3% |
0.5% |
0.4% |
0.3% |
0.4% |
... |
... |
... |
... |
... |
... |
... |
| Consensus Low: |
0.1% |
0.2% |
0.2% |
0.2% |
0.2% |
... |
... |
... |
... |
... |
... |
... |
| Consensus High: |
0.7% |
0.6% |
0.4% |
0.8% |
0.6% |
... |
... |
... |
... |
... |
... |
... |
| P. INCOME |
0.3% |
0.4% |
-0.1% |
0.6% |
0.0% |
... |
... |
... |
... |
... |
... |
... |
| Rating |
|
|
|
|
|
|
|
|
|
|
|
|
| Month for: |
Dec 25 |
Jan-26 |
Feb-26 |
Mar-26 |
Apr-26 |
May-26 |
Jun-26 |
Jul-26 |
Aug-26 |
Sep-26 |
Oct-26 |
Nov-26 |
|
|
|
|
|
|
|
|
|
|
|
|
|
|
|
| |
|
| |
|
|
|
|
|
|
|
|
|
|
|
Release Schedule | 2025 |
|
|
Personal Income | Consumer |
|
Today's Week |
|
|
|
|
|
|
|
|
|
|
|
|
|
Personal Income
(At 8:30 a.m ET)
| SCHEDULE 2025 |
No 1 |
No 2 |
No 3 |
No 4 |
No 5 |
No 6 |
No 7 |
No 8 |
No 9 |
No 10 |
No 11 |
No 12 |
| Release | Week |
|
|
|
|
|
|
|
|
|
|
|
|
| Release | Date |
|
|
|
|
|
|
|
|
|
|
|
|
| Release | Day |
|
|
|
|
|
|
|
|
|
|
|
|
|
|
|
|
|
|
|
|
|
|
|
|
|
| Prior M/M: |
0.3% |
0.4% |
0.9% |
0.8% |
0.5% |
0.8% |
-0.4% |
0.3% |
0.4% |
0.4% |
0.4% |
... |
| Prior Revised: |
... |
... |
0.7% |
0.7% |
0.7% |
0.7% |
... |
... |
... |
... |
... |
0.1% |
| CONSENSUS |
0.4% |
0.3% |
0.4% |
0.4% |
0.3% |
0.3% |
0.2% |
0.4% |
0.3% |
0.4% |
0.3% |
0.5% |
| Consensus Low: |
0.3% |
0.2% |
0.1% |
0.0% |
0.2% |
0.0% |
-0.1% |
0.3% |
0.3% |
0.3% |
0.2% |
0.3% |
| Consensus High: |
0.7% |
0.7% |
0.6% |
0.6% |
0.4% |
0.8% |
0.5% |
0.5% |
0.4% |
0.5% |
0.4% |
0.5% |
| P. INCOME |
0.4% |
0.9% |
0.8% |
0.5% |
0.8% |
-0.4% |
0.3% |
0.4% |
0.4% |
0.4% |
... |
0.3% |
| Rating |
|
|
|
|
|
|
|
|
|
|
|
|
| Month for: |
Dec 24 |
Jan-25 |
Feb-25 |
Mar-25 |
Apr-25 |
May-25 |
Jun-25 |
Jul-25 |
Aug-25 |
Sep-25 |
Oct-25 |
Nov-25 |
|
|
|
|
|
|
|
|
|
|
|
|
|
|
|
| |
|
| |
|
|
|
|
|
|
|
|
|
|
|
Release Schedule | 2024 |
|
|
Personal Income | Consumer |
|
Today's Week |
|
|
|
|
|
|
|
|
|
|
|
|
|
Personal Income
(At 8:30 a.m ET)
| SCHEDULE 2024 |
No 1 |
No 2 |
No 3 |
No 4 |
No 5 |
No 6 |
No 7 |
No 8 |
No 9 |
No 10 |
No 11 |
No 12 |
| Released Week: |
|
|
|
|
|
|
|
|
|
|
|
|
| Rreleased Date: |
|
|
|
|
|
|
|
|
|
|
|
|
| Released Day: |
|
|
|
|
|
|
|
|
|
|
|
|
| Prior M/M: |
0.4% |
0.3% |
1.0% |
0.3% |
0.5% |
0.3% |
0.5% |
0.2% |
0.3% |
0.2% |
0.3% |
0.6% |
| Prior Revised: |
... |
... |
... |
... |
.. |
.. |
0.4% |
... |
... |
... |
... |
0.7% |
| Consensus: |
0.3% |
0.4% |
0.4% |
0.5% |
0.3% |
0.4% |
0.4% |
0.2% |
0.4% |
0.4% |
0.3% |
0.4% |
| Consensus Low: |
0.2% |
0.2% |
0.0% |
0.3% |
0.2% |
0.3% |
0.2% |
0.1% |
0.2% |
0.2% |
0.1% |
0.3% |
| Consensus High: |
0.5% |
0.6% |
0.5% |
0.7% |
0.4% |
0.5% |
0.4% |
0.4% |
0.6% |
0.6% |
0.4% |
0.5% |
| Personal Income: |
0.3% |
1.0% |
0.3% |
0.5% |
0.3% |
0.5% |
0.2% |
0.3% |
0.2% |
0.3% |
0.6% |
0.3% |
| RATING |
|
|
|
|
|
|
|
|
|
|
|
|
| Month for: |
Dec 23 |
Jan-24 |
Feb-24 |
Mar-24 |
Apr-24 |
May-24 |
Jun-24 |
Jul-24 |
Aug-24 |
Sep-24 |
Oct-24 |
Nov-24 |
|
|
|
|
|
|
|
|
|
|
|
|
|
|
|
| |
|
| |
|
|
|
|
|
|
|
|
|
|
|
Release Schedule | 2023 |
|
|
Personal Income | Consumer |
|
Today's Week |
|
|
|
|
|
|
|
|
|
|
|
|
|
Personal Income
(At 8:30 a.m ET)
| SCHEDULE 2023 |
No 1 |
No 2 |
No 3 |
No 4 |
No 5 |
No 6 |
No 7 |
No 8 |
No 9 |
No 10 |
No 11 |
No 12 |
| Released Week: |
|
|
|
|
|
|
|
|
|
|
|
|
| Rreleased Date: |
|
|
|
|
|
|
|
|
|
|
|
|
| Released Day: |
|
|
|
|
|
|
|
|
|
|
|
|
| Prior M/M: |
0.4% |
0.2% |
0.6% |
0.3% |
0.3% |
0.4% |
0.4% |
0.3% |
0.2% |
0.3% |
0.3% |
0.2% |
| Prior Revised: |
0.3% |
0.3% |
... |
... |
... |
0.3% |
0.5% |
... |
... |
... |
0.4% |
0.3% |
| Consensus: |
0.2% |
1.0% |
0.3% |
0.2% |
0.4% |
0.4% |
0.4% |
0.3% |
0.4% |
0.4% |
0.2% |
0.4% |
| Consensus Low: |
0.1% |
0.5% |
-0.1% |
-0.1% |
0.2% |
0.2% |
0.3% |
0.2% |
0.2% |
0.3% |
0.1% |
0.3% |
| Consensus High: |
0.4% |
1.5% |
0.4% |
0.4% |
0.5% |
0.4% |
0.5% |
0.5% |
0.6% |
0.5% |
0.3% |
0.5% |
| Personal Income: |
0.2% |
0.6% |
0.3% |
0.3% |
0.4% |
0.4% |
0.3% |
0.2% |
0.4% |
0.3% |
0.2% |
0.4% |
| RATING |
|
|
|
|
|
|
|
|
|
|
|
|
| Month for: |
Dec 22 |
Jan-23 |
Feb-23 |
Mar-23 |
Apr-23 |
May-23 |
Jun-23 |
Jul-23 |
Aug-23 |
Sep-23 |
Oct-23 |
Nov-23 |
|
|
|
|
|
|
|
|
|
|
|
|
|
|
|
| |
|
| |
|
|
|
|
|
|
|
|
|
|
|
Release Schedule | 2022 |
|
|
Personal Income | Consumer |
|
Today's Week |
|
|
|
|
|
|
|
|
|
|
|
|
|
Personal Income
(At 8:30 a.m ET)
| SCHEDULE 2022 |
No 1 |
No 2 |
No 3 |
No 4 |
No 5 |
No 6 |
No 7 |
No 8 |
No 9 |
No 10 |
No 11 |
No 12 |
| Released Week: |
|
|
|
|
|
|
|
|
|
|
|
|
| Rreleased Date: |
|
|
|
|
|
|
|
|
|
|
|
|
| Released Day: |
|
|
|
|
|
|
|
|
|
|
|
|
| Prior M/M: |
0.4% |
0.3% |
0.0% |
0.5% |
0.5% |
0.4% |
0.5% |
0.6% |
0.2% |
0.3% |
0.4% |
0.7% |
| Prior Revised: |
0.5% |
0.4% |
... |
0.7% |
... |
0.5% |
... |
0.7% |
... |
0.4% |
... |
... |
| Consensus: |
0.5% |
-0.3% |
0.5% |
0.4% |
0.6% |
0.5% |
... |
0.6% |
0.3% |
0.3% |
0.4% |
0.3% |
| Consensus Low: |
0.2% |
-1.3% |
0.1% |
0.2% |
0.2% |
0.3% |
... |
0.3% |
... |
0.1% |
0.0% |
0.0% |
| Consensus High: |
0.7% |
0.7% |
0.6% |
0.6% |
0.7% |
0.5% |
... |
1.0% |
... |
0.5% |
0.5% |
0.5% |
| Personal Income: |
0.3% |
0.0% |
0.5% |
0.5% |
0.4% |
0.5% |
0.6% |
0.2% |
0.3% |
0.4% |
0.7% |
0.4% |
| RATING |
|
|
|
|
|
|
|
|
|
|
|
|
| Month for: |
Dec 21 |
Jan-22 |
Feb-22 |
Mar-22 |
Apr-22 |
May-22 |
Jun-22 |
Jul-22 |
Aug-22 |
Sep-22 |
Oct-22 |
Nov-22 |
|
|
|
|
|
|
|
|
|
|
|
|
|
|
|
| |
|
| |
|
|
|
|
|
|
|
|
|
|
|
Release Schedule | 2021 |
|
|
Personal Income | Consumer |
|
Today's Week |
|
|
|
|
|
|
|
|
|
|
|
|
|
Personal Income
(At 8:30 a.m ET)
| SCHEDULE 2021 |
No 1 |
No 2 |
No 3 |
No 4 |
No 5 |
No 6 |
No 7 |
No 8 |
No 9 |
No 10 |
No 11 |
No 12 |
| Released Week: |
|
|
|
|
|
|
|
|
|
|
|
|
| Rreleased Date: |
|
|
|
|
|
|
|
|
|
|
|
|
| Released Day: |
|
|
|
|
|
|
|
|
|
|
|
|
| Prior: |
0.6% |
0.6% |
10.0% |
-7.1% |
21.1% |
-13.1% |
-2.0% |
-2.0% |
1.1% |
0.2% |
-1.0% |
0.5% |
| Prior Revised: |
1.0% |
... |
... |
... |
20.9% |
... |
... |
... |
1.1% |
... |
-1.0% |
... |
| Consensus: |
0.7% |
9.4% |
-7.0% |
20.3% |
-14.0% |
-2.6% |
... |
... |
0.3% |
... |
0.2% |
0.5% |
| Consensus Low: |
0.4% |
0.2% |
-1.0% |
8.8% |
... |
-4.3% |
... |
... |
-1.0% |
... |
-0.5% |
0.0% |
| Consensus High: |
1.5% |
11% |
-8.0% |
22.5% |
... |
5.6% |
... |
... |
0.6% |
... |
0.6% |
1.0% |
| Persona lIncome: |
0.6% |
10.0% |
-7.1% |
21.1% |
-13.1% |
-2.0% |
0.1% |
1.1% |
0.2% |
-1.0% |
0.5% |
0.4% |
| RATING |
|
|
|
|
|
|
|
|
|
|
|
|
| Month for: |
Dec 20 |
Jan-21 |
Feb-21 |
Mar-21 |
Apr-21 |
May-21 |
Jun-21 |
Jul-21 |
Aug-21 |
Sep-21 |
Oct-21 |
Nov-21 |
|
|
|
|
|
|
|
|
|
|
|
|
|
|
|
| |
|
| |
|
Legends: |
 |
Delayed |
 |
Positive View |
 |
Negative View |
 |
Neutral View |
 |
Non Available |
|
|
|
|
|
|
|
|
|
|
|
|
|
|
|
|
|
|
|
|
| |
|
|
|
|
|
|
|
|
|
|
|
|
Personal Income | Cosnumer
| DATE/WEEK |
HIGHLIGHTS |
FOR |
INDEX |
|
Personal Income |
No 12 |
... |
|
Nov-2026 |
|
| |
|
|
|
Personal Income |
No 11 |
... |
|
Oct-2026 |
|
| |
|
|
|
Personal Income |
No 10 |
... |
|
Sep-2026 |
|
| |
|
|
|
Personal Income |
No 9 |
... |
|
Aug-2026 |
|
| |
|
|
|
Personal Income |
No 8 |
... |
|
Jul-2026 |
|
| |
|
|
|
Personal Income |
No 7 |
... |
|
Jun-2026 |
|
| |
|
|
|
Personal Income |
No 6 |
... |
|
May-2026 |
|
| |
|
|
|
Personal Income |
No 5 |
... |
|
Apr-2026 |
|
| |
|
|
|
Personal Income |
No 4 |
... |
|
Mar-2026 |
|
| |
|
|
|
Personal Income |
No 3 |
... |
|
Feb-2026 |
|
| |
|
|
|
Personal Income |
No 2 |
... |
|
Jan-2026 |
|
| |
|
|
|
Personal Income |
No 1 |
... |
|
Dec-2025 |
|
| |
|
|
|
|
|
|
|
|
| |
|
|
|
|
|
| |
|
|
|
|
|
|
Personal Income
(At 8:30 a.m ET)
| DATE/WEEK |
HIGHLIGHTS |
FOR |
Y/Y |
|
Key Fed |
No 12 |
... |
|
Nov-2025 |
|
| |
|
|
|
bbbbbbbbbbbbbbbbbbbbbbbbbbbbbbbb |
No 12 |
0.4% |
|
Sep-2025 |
|
| |
|
|
|
Personal Income Oct. 2025. Delayed due to the government shut down. |
No 11 |
... |
|
Oct-2025 |
|
| |
|
|
|
Personal Income Sep. 2025: Delayed due to the government shut down, |
No 10 |
... |
|
Sep-2025 |
|
| |
|
|
|
In August 2025, US personal income increased by $95.71 billion, or 0.37%. This was driven by a 0.6% rise in government transfers (primarily Social Security) and a 0.3% increase in wages and salaries. Disposable personal income (DPI), which is personal income minus taxes, also rose by 0.4%. |
No 9 |
0.4% |
|
Aug-2025 |
|
| |
|
|
|
In July 2025, US personal income rose by $112.3 billion (0.4%) month-over-month), largely due to an increase in employee compensation, particularly private sector wages and salaries. Disposable personal income (DPI) also increased by $93.9 billion (0.4%), while personal consumption expenditures (PCE) rose $108.9 billion (0.5%). The personal saving rate was 4.4%. |
No 8 |
0.4% |
|
Jul-2025 |
|
| |
|
|
|
In June 2025, US personal income increased by $71.4 billion ($25.794 trillion total) at a monthly rate of 0.3%, recovering from a decline in May. This rise was driven by a 0.2% increase in employee compensation and a 1% jump in personal current transfer receipts, while real disposable personal income was unchanged after a 0.7% drop in May. |
No 7 |
0.3% |
|
Jun-2025 |
|
| |
|
|
|
In May 2025, US personal income decreased by $109.6 billion (0.4%), marking the first monthly decline since September 2021. This was driven by a drop in government transfer payments and farm income, which more than offset an increase in private-sector wages and salaries. Disposable personal income fell by 0.6%, while personal consumption expenditures decreased by 0.1%. |
No 6 |
-1.4% |
|
May-2025 |
|
| |
|
|
|
In April 2025, U.S. personal income rose by $210.1 billion (0.8%), while disposable personal income (DPI) increased by $189.4 billion (0.8%). Personal consumption expenditures (PCE) grew by $47.8 billion (0.2%), and the personal saving rate was 4.9%. In the second quarter of 2025, personal income increased in all 50 states and the District of Columbia, with the largest growth in Kansas and the smallest in Arkansas. |
No 5 |
0.8% |
|
Apr-2025 |
|
| |
|
|
|
In March 2025, U.S. personal income rose by $116.8 billion (0.5% at a monthly rate), while disposable personal income increased by $102.0 billion (0.5%). Personal consumption expenditures (PCE) increased by $134.5 billion (0.7%), and the personal saving rate was 3.9%. |
No 4 |
0.5% |
|
Mar-2025 |
|
| |
|
|
|
In February 2025, U.S. personal income increased by $194.7 billion (0.8%). Disposable personal income grew by $191.6 billion (0.9%), while personal consumption expenditures (PCE) rose by $87.8 billion (0.4%). The personal saving rate was 4.6%. |
No 3 |
0.8% |
|
Feb-2025 |
|
| |
|
|
|
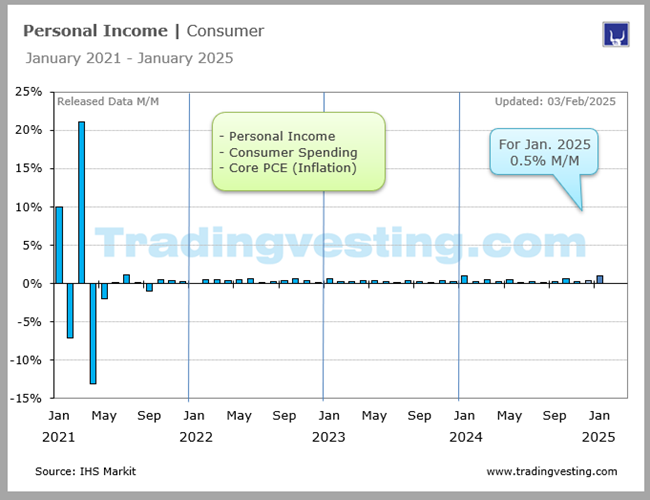
In January 2025, US personal income rose by $221.9 billion (0.9%), primarily driven by an increase in social security benefits and wages and salaries. In contrast, personal consumption expenditures decreased by $30.7 billion (0.2%). |
No 2 |
0.9% |
|
Jan-2025 |
|
| |
|
|
|
In December 2024, U.S. personal income increased by $92.0 billion, or 0.4%. This was largely driven by an increase in employee compensation, particularly private wages and salaries. Disposable personal income (DPI) rose by $79.7 billion (0.4%), while personal savings decreased as personal consumption expenditures grew at a faster pace. |
No 1 |
0.4% |
|
Dec-2024 |
|
| |
|
|
|
|
|
|
|
|
| |
|
|
|
|
|
| |
|
|
|
|
|
|
Personal Income
(At 8:30 a.m ET)
| DATE/WEEK |
HIGHLIGHTS |
FOR |
Y/Y |
|
In November 2024, personal income in the U.S. increased by $71.1 billion (0.3%) to $71.1 billion, driven by a rise in compensation that was partly offset by decreases in income from assets and transfer receipts. Disposable personal income rose $61.1 billion (0.3%), while personal outlays, which include consumer spending, increased by $78.2 billion (0.4%). The personal saving rate was 4.4%. |
No 12 |
0.3% |
|
Nov-2024 |
|
| |
|
|
|
In October 2024, U.S. personal income increased by $147.4 billion (0.6 percent). This was primarily driven by increases in compensation, personal income receipts on assets, and personal current transfer receipts. Disposable personal income (DPI) rose by $144.1 billion (0.7 percent), and the personal saving rate was 4.4 percent. |
No 11 |
0.6% |
|
Oct-2024 |
|
| |
|
|
|
In September 2024, US personal income rose by $71.6 billion (0.3% monthly) and disposable personal income increased by $57.4 billion (0.3%). Consumer spending, or personal consumption expenditures, increased by $105.8 billion (0.5%), and the personal saving rate was 4.6%. |
No 10 |
|
|
Sep-2024 |
|
| |
|
|
|
In August 2024, U.S. personal income increased by $50.5 billion (0.2% month-over-month), according to the Bureau of Economic Analysis (BEA). This growth was driven by an increase in wages and salaries, as well as personal current transfer receipts, with disposable personal income rising by $34.2 billion (0.2%) and the personal saving rate remaining at 4.8%. |
No 9 |
0.2% |
|
Aug-2024 |
|
| |
|
|
|
In July 2024, U.S. personal income rose by $75.1 billion (0.3%), driven by an increase in compensation, particularly private wages and salaries in services-producing industries. Disposable personal income increased by $54.8 billion (0.3%), and personal consumption expenditures (PCE) rose by $103.8 billion (0.5%). The personal saving rate was 2.9% in July 2024. |
No 8 |
0.3% |
|
Jul-2024 |
|
| |
|
|
|
In June 2024, U.S. personal income increased by $50.4 billion (0.2% at a monthly rate), driven by rises in compensation and personal current transfer receipts. Disposable personal income rose by $37.7 billion (0.2%), and consumer spending (personal consumption expenditures) grew by $57.6 billion (0.3%). The personal saving rate was 3.4% |
No 7 |
0.2% |
|
Jun-2024 |
|
| |
|
|
|
In May 2024, US personal income rose by $114.1 billion (0.5%), driven by increases in compensation (especially wages and salaries), personal income receipts on assets, and government social benefits. Disposable personal income grew by $94.0 billion (0.5%), and personal outlays increased by $56.4 billion (0.3%). The personal saving rate was 3.9%, with personal saving totaling $806.1 billion. |
No 6 |
0.5% |
|
May-2024 |
|
| |
|
|
|
In April 2024, U.S. personal income increased by $65.3 billion (0.3%) from the previous month, driven by growth in wages and government social benefits. However, real after-tax income per capita declined by 0.1% because personal income rose slower than inflation, as the Personal Consumption Expenditures (PCE) price index grew by 0.3%. Consequently, consumer spending increased slightly, but the personal saving rate remained at 3.6%. |
No 5 |
0.3% |
|
Apr-2024 |
|
| |
|
|
|
In March 2024, US personal income rose by $122.0 billion, a 0.5% increase. Disposable personal income (DPI) increased by $104.0 billion (0.5%), while personal consumption expenditures (PCE) rose by $160.9 billion (0.8%). The increase in personal income was mainly due to a rise in compensation, particularly private wages and salaries. |
No 4 |
0.5% |
|
Mar-2024 |
|
| |
|
|
|
In February 2024, U.S. personal income increased by $66.5 billion (0.3%), while disposable personal income grew by $50.3 billion (0.2%). Consumer spending, or personal consumption expenditures, rose by $145.5 billion (0.8%). Despite the income growth, real (inflation-adjusted) disposable personal income decreased by 0.1%. |
No 3 |
0.3% |
|
Feb-2024 |
|
| |
|
|
|
In January 2024, U.S. personal income increased by $233.7 billion (1.0 percent at a monthly rate). Disposable personal income (DPI) rose by $67.6 billion (0.3 percent), while personal consumption expenditures (PCE) increased by $43.9 billion (0.2 percent). The personal saving rate was 3.8 percent. |
No 2 |
1.0% |
|
Jan-2024 |
|
| |
|
|
|
Personal income growth edged lower to 0.3%, in line with the forecast. The data was included in the fourth quarter's advance gross domestic product report published on Thursday. Consumer spending increased at a strong 2.8% rate last quarter, accounting for the bulk of the economy's 3.3% growth pace. The pace of growth in consumer spending is, however, likely to moderate in the months ahead. Personal income increased 0.3% in December after rising 0.4% |
No 1 |
0.3% |
|
Dec-2023 |
|
| |
|
|
|
|
|
|
|
|
| |
|
|
|
|
|
| |
|
|
|
|
|
|
Personal Income
(At 8:30 a.m ET)
| DATE/WEEK |
HIGHLIGHTS |
FOR |
ACTUAL |
|
In November 2023, U.S. personal income increased by $81.6 billion (0.4%), with disposable personal income rising by $71.9 billion (0.4%). This was driven by a strong performance in wages and salaries, which contributed to a 0.2% increase in personal consumption expenditures. |
No 12 |
0.4% |
|
Nov-2023 |
|
| |
|
|
|
In October 2023, US personal income rose by $57.1 billion (0.2%), and disposable personal income increased by $63.4 billion (0.3%). Consumer spending increased by $41.2 billion (0.2%), and the personal saving rate was 3.8%. Real disposable personal income grew by 0.3%, and real consumer spending increased by 0.2%. |
No 11 |
0.2% |
|
Oct-2023 |
|
| |
|
|
|
In September 2023, US personal income increased by $77.8 billion (0.3%) at a monthly rate). This was primarily driven by increases in private wages and salaries. Disposable personal income (DPI), which is income after taxes, also increased by $56.1 billion (0.3%)). The personal saving rate was (3.4%). |
No 10 |
|
|
Sep-2023 |
|
| |
|
|
|
In August 2023, US personal income rose by $87.6 billion (0.4%), while disposable personal income increased by $46.6 billion (0.2%). Personal outlays, which include consumer spending, increased by $86.0 billion (0.4%), and personal saving was $794.1 billion, representing a saving rate of 3.9%. The income increase was mainly driven by rises in compensation and personal current transfer receipts. |
No 9 |
0.4% |
|
Aug-2023 |
|
| |
|
|
|
In July 2023, US personal income rose by $45.0 billion (0.2%) monthly rate), while disposable personal income (after taxes) increased by just (7.3billion()<0.1%$ monthly rate). Consumer spending (PCE) surged by $144.6 billion (0.8%) monthly rate), and real (inflation-adjusted) disposable income decreased by (0.2%) due to spending outstripping income growth. The personal saving rate was (3.5%). |
No 8 |
0.2% |
|
Jul-2023 |
|
| |
|
|
|
In June 2023, US personal income rose by $69.5 billion, a 0.3% increase, primarily due to growth in wages and government social benefits. Disposable personal income also increased by 0.3%, while personal consumption expenditures grew by 0.5%. Consequently, the personal saving rate declined to 4.3%. |
No 7 |
0.3% |
|
Jun-2023 |
|
| |
|
|
|
In May 2023, U.S. personal income increased by $91.2 billion (0.4%), while disposable personal income rose by $86.7 billion (0.4%). Personal outlays grew by $22.7 billion (0.1%), and consumer spending increased by $18.9 billion (0.1%). The personal saving rate for May was 4.6%, up from 4.3% in April. |
No 6 |
0.4% |
|
May-2023 |
|
| |
|
|
|
In April 2023, U.S. personal income rose by $80.1 billion (0.4%) in nominal terms, primarily due to increases in compensation and personal income receipts on assets. However, disposable personal income (DPI), which accounts for taxes, increased slightly by 0.4% ($79.4 billion). Real disposable personal income (adjusted for inflation) increased by less than 0.1% for the month. |
No 5 |
0.4% |
|
Apr-2023 |
|
| |
|
|
|
In March 2023, U.S. personal income increased by $67.9 billion (0.3%) while disposable personal income grew by $71.7 billion (0.4%). The personal saving rate was 5.1% for the month, a slight increase from 4.8% in February. |
No 4 |
0.3% |
|
Mar-2023 |
|
| |
|
|
|
In February 2023, U.S. personal income increased by $72.9 billion (0.3%) and disposable personal income grew by $89.9 billion (0.5%). The increase in personal income was primarily driven by higher compensation, and the personal saving rate was 4.6%. |
No 3 |
0.3% |
|
Feb-2023 |
|
| |
|
|
|
In January 2023, US personal income rose by $131.1 billion (0.6%), primarily driven by an increase in compensation from private wages and salaries, along with government transfer payments. Personal spending also increased by $312.5 billion (1.8%), with notable growth in spending on goods and services, and the personal saving rate was 4.7%. |
No 2 |
0.6% |
|
Jan-2023 |
|
| |
|
|
|
In December 2022, U.S. personal income increased by $49.5 billion (0.2%), primarily driven by rises in compensation and proprietors' income. In contrast, consumer spending (personal consumption expenditures) decreased by $41.6 billion (0.2%), with a decline in goods spending partially offset by an increase in services spending. The personal saving rate rose to 3.4% in December. |
No 1 |
0.2% |
|
Dec-2022 |
|
| |
|
|
|
|
|
|
|
|
| |
|
|
|
|
|
| |
|
|
|
|
|
|
Personal Income | Consumer (8:30)
| DATE/WEEK |
HIGHLIGHTS |
M/M |
Y/Y |
|
In November 2022, U.S. personal income increased by $80.1 billion (0.4%) while consumer spending grew by only $19.8 billion (0.1%). The income increase was driven by growth in compensation and income from assets, and the personal saving rate rose to 2.4%. Real disposable personal income also increased by 0.3%, while real consumer spending grew by less than 0.1%. |
No 12 |
0.4% |
|
Nov-2022 |
|
| |
|
|
|
In October 2022, U.S. personal income increased by $155.3 billion (0.7 percent), driven by rises in compensation and government social benefits. At the same time, disposable personal income rose by $132.9 billion (0.7 percent), and consumer spending (PCE) increased by $147.9 billion (0.8 percent). In real (inflation-adjusted) terms, disposable personal income grew by 0.4 percent and consumer spending by 0.5 percent. |
No 11 |
0.7% |
|
Oct-2022 |
|
| |
|
|
|
In September 2022, U.S. personal income increased by $78.9 billion, or 0.4%. This increase was primarily driven by higher compensation and personal income from assets. Despite the income growth, the personal saving rate dropped to 3.1% from 3.4% in August, and inflation remained a key factor affecting real income and spending. |
No 10 |
0.4% |
|
Sep-2022 |
|
| |
|
|
|
In August 2022, U.S. personal income increased by $71.6 billion, or 0.3%. This was primarily due to increases in compensation and proprietors' income. Disposable personal income rose 0.4%, and personal consumption expenditures (spending) increased 0.4%. |
No 9 |
0.3% |
|
Aug-2022 |
|
| |
|
|
|
In July 2022, U.S. personal income increased by $47.0 billion (0.2%), while disposable personal income (DPI) rose by $37.6 billion (0.2%). The increase in income was led by gains in wages and salaries, particularly in private industries. Real disposable personal income, which accounts for inflation, increased by 0.3% for the month. |
No 8 |
0.2% |
|
Jul-2022 |
|
| |
|
|
|
In June 2022, US personal income increased by $133.5 billion (0.6%), primarily driven by compensation (especially private wages and salaries) and proprietors' income. However, real disposable personal income decreased by 0.3% because consumer spending increased at a faster rate of 1.1%, leading to a personal savings rate of 5.1%. |
No 7 |
0.6% |
|
Jun-2022 |
|
| |
|
|
|
In May 2022, U.S. personal income increased by $113.4 billion (0.5 percent), primarily driven by higher compensation. Disposable personal income also rose by $96.5 billion (0.5 percent), but real disposable personal income decreased slightly by 0.1 percent after accounting for inflation. Consumer spending increased at a slower pace, up 0.2 percent, with a decrease in spending on goods and an increase in spending on services. |
No 6 |
0.5% |
|
May-2022 |
|
| |
|
|
|
In April 2022, US personal income rose by $89.3 billion, a 0.4% increase, primarily driven by growth in compensation, particularly wages and salaries. However, this was accompanied by a larger increase in consumer spending, which rose by $152.3 billion (0.9%), leading to a decrease in the personal saving rate to 4.4%. |
No 5 |
0.4% |
|
Apr-2022 |
|
| |
|
|
|
In March 2022, U.S. personal income increased by $107.2 billion (0.5% at a monthly rate), driven primarily by a rise in compensation. Consumer spending, or outlays, increased by a larger amount, $185.0 billion (1.1%), and the personal saving rate decreased to 6.2% from 6.8% in February. |
No 4 |
0.5% |
|
Mar-2022 |
|
| |
|
|
|
In February 2022, U.S. personal income increased by $101.5 billion (0.5%) from the previous month, primarily driven by an increase in compensation. While total personal income rose, government social benefits declined as pandemic-related assistance programs continued to wind down, although this was partly offset by an increase in Medicare and Medicaid. Real (inflation-adjusted) personal income decreased by 0.2%. |
No 3 |
0.5% |
|
Feb-2022 |
|
| |
|
|
|
In January 2022, US personal income increased by a modest $9.0 billion (0.0%), while consumer spending surged by $337.2 billion (2.1%). This income increase was primarily driven by higher wages and salaries, which was partly offset by a decrease in government social benefits, largely due to the expiration of the expanded Child Tax Credit. The personal saving rate dropped to 6.4% in January from 8.2% in Decembe
|
No 2 |
0.0% |
|
Jan-2022 |
|
| |
|
|
|
In December 2021, U.S. personal income increased by $70.7 billion (0.3%) at a monthly rate), primarily driven by a rise in employee compensation, according to the Bureau of Economic Analysis (BEA). In contrast, consumer spending decreased by $95.2 billion (0.6%)). The personal saving rate also increased to (7.9%) from (7.2%) in November. |
No 1 |
0.3% |
|
Dec-2021 |
|
| |
|
|
|
|
|
|
|
|
| |
|
|
|
|
|
| |
|
|
|
|
|
|
Personal Income | Consumer (8:30)
| DATE/WEEK |
HIGHLIGHTS |
M/M |
Y/Y |
|
In November 2021, U.S. personal income increased by $90.4 billion (0.4%) and disposable personal income (DPI) increased by $70.4 billion (0.4%). This was primarily driven by an increase in wages and salaries, though pandemic-related programs like unemployment insurance continued to decrease. The personal saving rate was 6.9% in November 2021.. |
No 12 |
0.4% |
|
Nov-2021 |
|
| |
|
|
|
In October 2021, U.S. personal income increased by $93.4 billion, or 0.5%. This rise was primarily driven by higher employee compensation, though it was partly offset by a decrease in government social benefits. Disposable personal income rose by 0.3%, while consumer spending increased 1.3%, causing the personal saving rate to fall to 7.3%. |
No 11 |
0.5% |
|
Oct-2021 |
|
| |
|
|
|
In September 2021, personal income in the U.S. decreased by $216.2 billion (1.0%) due to the winding down of pandemic-related assistance programs like expanded unemployment benefits. In contrast, consumer spending increased by $93.4 billion (0.6%). |
No 10 |
-1.0% |
|
Sep-2021 |
|
| |
|
|
|
In August 2021, U.S. personal income increased by $35.5 billion, or 0.2 percent, driven by higher compensation and government social benefits like the advanced Child Tax Credit. Consumer spending, or personal consumption expenditures, rose 0.8 percent, while disposable personal income increased 0.1 percent, and "real" (inflation-adjusted) disposable personal income decreased by 0.3 percent. |
No 9 |
0.2% |
|
Aug-2021 |
|
| |
|
|
|
In July 2021, U.S. personal income increased by $225.9 billion (1.1 percent). This was primarily driven by increases in government social benefits, which included the new advance Child Tax Credit, and compensation of employees. Disposable personal income rose by 1.1 percent, while personal consumption expenditures increased by $42.2 billion (0.3 percent). |
No 8 |
1.1% |
|
Jul-2021 |
|
| |
|
|
|
In June 2021, U.S. personal income increased by $26.1 billion (0.1%), primarily due to higher private wages and salaries, while government social benefits and unemployment insurance decreased. Disposable personal income (DPI) saw a slight decrease of $2.6 billion (less than 0.1%). |
No 7 |
0.1% |
|
Jun-2021 |
|
| |
|
|
|
In May 2021, U.S. personal income decreased by $414.3 billion ($414.3 billion, or (2.0%) due to a drop in pandemic-related government assistance. Disposable personal income fell by $436.3 billion ($436.3 billion, or (2.3%), while consumer spending (personal consumption expenditures) increased slightly by $2.9 billion (less than (0.1%). |
No 6 |
-2.0% |
|
May-2021 |
|
| |
|
|
|
In April 2021, U.S. personal income decreased significantly by $3.21 trillion, or 13.1 percent, mainly due to a drop in government social benefits like the economic impact payments from March. This was a reversal from the record-high increase in March 2021, which was largely fueled by stimulus checks. Disposable personal income (DPI) fell by 14.6 percent, while personal consumption expenditures (PCE) rose slightl |
No 5 |
-13.1% |
|
Apr-2021 |
|
| |
|
|
|
In March 2021, U.S. personal income surged by a record 21.1% due to the distribution of economic impact payments from the American Rescue Plan Act. Disposable personal income also rose by 23.6%, driven by government social benefits like these payments, along with increases in wages, proprietors' income, and income from assets. |
No 4 |
21.1% |
|
Mar-2021 |
|
| |
|
|
|
In February 2021, US personal income decreased by 7.1% ($1,516.6 billion), primarily because the previous month's surge was driven by one-time stimulus checks, which were not issued in February. Disposable personal income also dropped by 8.0% ($1,532.3 billion). This decline was a return to more normal levels after the significant boost from the December stimulus payments, which had caused a 10.1% surge in January. |
No 3 |
-7.1% |
|
Feb-2021 |
|
| |
|
|
|
In January 2021, U.S. personal income rose by 10.0% due to a significant increase in government social benefits like economic impact payments and enhanced unemployment insurance, as part of the Coronavirus Response and Relief Supplemental Appropriations (CRRSA) Act. This increase in government transfer payments was the main driver of the rise in personal income. |
No 2 |
10.0% |
|
Jan-2021 |
|
| |
|
|
|
In December 2020, U.S. personal income increased by $116.6 billion (0.6 percent), and disposable personal income (DPI) increased by $111.6 billion (0.6 percent), according to the Bureau of Economic Analysis (BEA). This growth was accompanied by a decrease of $27.9 billion (0.2 percent) in personal consumption expenditures (PCE). Real (inflation-adjusted) DPI grew by 0.2 percent for the month, while real PCE decreased by 0.6 percent. |
No 1 |
0.6% |
|
Dec-2020 |
|
| |
|
|
|
|
|
|
|
|
| |
|
|
|
|
|
| |
|
Legends: |
|
Delayed |
|
Positive View |
|
Negative View |
|
Neutral View |
|
Non Available |
|
|
|
|
|
|
|
|
|
|
|
|
|
|
|
|
|
|
|
|
| |
|
|
|
|
|
|
|
|
|
|
|
|
|
|
|
|
|
|
|
|
|
Definitions | Explain |
|
|
Personal Income | Consumer |
|
Today's Week |
|
|
|
|
|
|
|
|
|
|
|
|
| |
|
|
|
|
| |
|
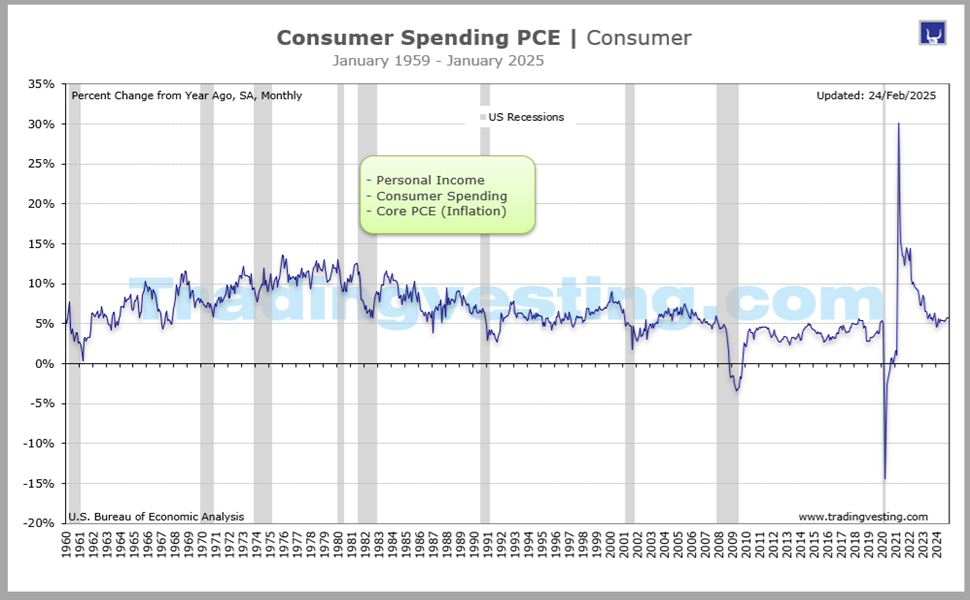
| Consumer Spending | Consumer |
Personal Income and Outlays:
1. Personal Income - Consumer
2. Personal Consumption Expenditures, Real PCE - Consumer Spending
3. PCE Price Index and Core PCE Price Index - Inflation
What is Core PCE?
Consumer spending, Real PCE, is a major driver of the economy. Increased buying of both goods and services contributed to an upward revision in GDP. Consumer spending is critical because it drives roughly 70% of growth and correspond to the amount of money spent by household in an economy. Consumer Spending is also known as Consumption or Personal Consumption Expenditure (PCE) and includes durables, like TV, and nondurables, like food. Changes in personal income signal changes in consumer spending. The income and outlays data are another handy way to gauge the strength of the consumer sector in this economy and where it is headed. The PCE or Cosumer Spending is indicative of the general consumption by individuals and their willingness to spend. Sharply declining or negative values indicate reduced consumption and are likely to correspond to times of economic stress. |
|
|
| |
|
|
|
|
|
|
|
|
|
|
|
| |
|
|
|
|
|
|
| DATA INFORMATION |
PERSONAL INCOME |
| SOURCE |
The Conference Board |
| WEB |
www.conference-board.org |
| FREQUENCY |
Monthly |
| AVAILABILITY |
The last week of the month |
| COVERAGE |
Data are for same month as the release month. |
| REVISIONS |
Yes |
| IMPORTANCE |
Consumer - Very Important |
|
| |
|
|
|
|
|
|
|
|
|
|
|
|