|
 |
|
|
|
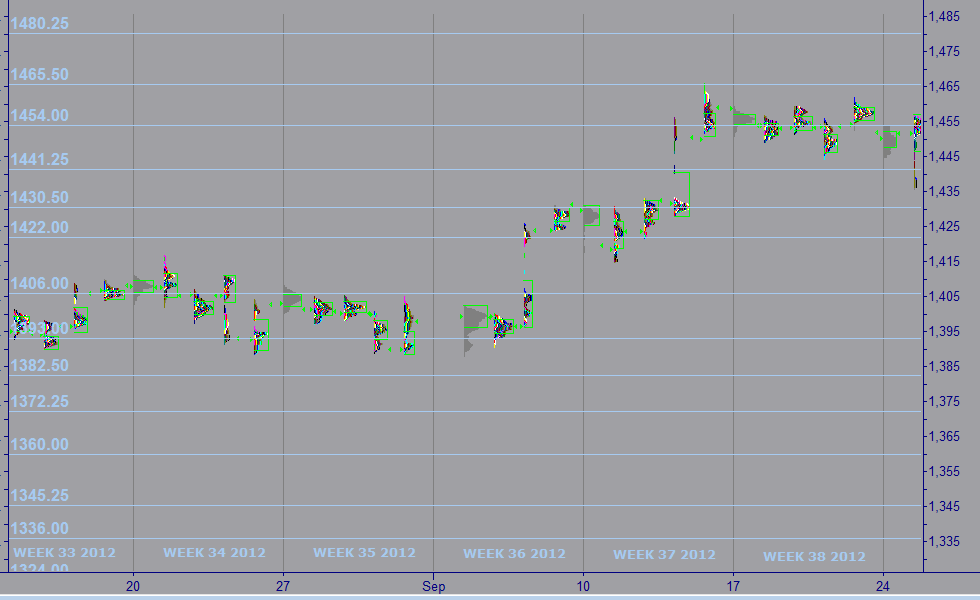
Week 39 -2012 | From Sep 24 to Sep 28, 2012 |
|
 |
|
|
|
|
|
|
| |
|
|
|
|
|
|
|
|
|
|
| |
Economic Data for Week 39-2012 | Global View | Week Rating
| DATE |
DAY |
REPORT/CATEGORY |
HIGHLIGHTS ON WEEK 39-2012 |
LAST |
|
Mon |
Chicago Fed Nat Activity Index |
The economy weakened considerably in August with the August 2012n (CFNAI) showing the 3 month moving (3MA) average declining significantly. The 3MA has remained for the last 6 months in negative territory. This indicatesnational economic activity was below its historical trend. |
-0.87 |
|
 |
Growth |
The Chicago Fed National Activity Index came in at -0.87 in August, versus -0.12 in July. The three-month average fell to -0.47 in August, versus -0.26 in July. |
|
|
Tue |
ICSC Goldman Sachs Index |
Last week, the ICSC-Goldman was up 2.1% Y/Y and 0.6% W/W and the Redbook was up 2.0% Y/Y. Therefore, U.S. Store Sales Mostly Flat Across Seasonal Changes |
0.6%
W/W
|
|
|
Sales and Inventories |
Goldman noted that although the Y/Y rate rose 0.8% this week, it has been trending lower. They added that gasoline prices are now moving lower, after nearly three months of uninterrupted gains, which could help discretionary spending as the holiday season begins. |
|
|
Tue |
Johnson Redbook |
Though the rate of growth is very modest, Redbook describes business among retailers as satisfactory. |
2.0%
Y/Y
|
|
|
Sales and Inventories |
Redbook added that Halloween sales are beginning earlier each year and may be keeping sales afloat. Redbook was up 2.0% Y/Y week 38. |
|
|
Tue |
S&P Case-Shiller Index |
The S&P/Case-Shiller composite index of 20 metropolitan areas gained 0.4% in July on a seasonally adjusted basis, shy of economists forecasts for 0.9%; still considered modest gains In July. |
0.4%
M/M
|
|
|
Real Estate |
U.S. single-family home prices rose for a sixth month in a row in July, though the improvement was not as strong as expected. The Case-Shiller HPI is now at 157.3 for the composite-10, up from 155.02 in June, and 144.61 for the�composite-20, up from 142.21. These are the highest readings since September of 2010. |
|
|
Tue |
Consumer Confidence |
The consumer confidence index increased to 70.3 in September. This is the highest level since February coming from a revised 61.3 in August. A prior estimate for August pegged the level at 60.6. |
70.3
Level
|
|
|
Consumer |
Led by expectations, a gauge of consumer confidence jumped up in September to the highest level in seven months, but remained relatively low. |
|
|
Tue |
FHFA House Price Index |
The FHFA House Price Index rose 0.2% on a seasonally-adjusted basis from June to July, the FHFA reported this morning. This brings the year over year gains to a fairly impressive 3.7%. |
0.2%
M/M
|
|
|
Real Estate |
The FHFA house price index posted another advance, though a little monthly movement, gaining 0.2% in July after rising 0.6% in June. |
|
|
Wed |
MBA purchase Applications |
The MBA said its seasonally adjusted index of mortgage application activity, which includes both refinancing and home purchase demand, rose 2.8% in the week ended Sept 21 or Week 38. |
2.8% |
|
|
Real Estate |
Applications for U.S. home mortgages rose last week as interest rates dropped to record lows in the wake of the Federal Reserve's latest stimulus efforts. |
|
|
Wed |
New Home Sales |
New Home Sales slipped 0.3% to a seasonally adjusted 373,000-unit annual rate for August 2012. July's sales pace was revised up to a 374,000-unit pace, the highest level since April 2010, from the previously reported 372,000 units. |
373K |
|
|
Real Estate |
New U.S. single-family home sales eased in August but held near two-year highs and prices vaulted to their highest level in more than five years. The sales pace in July, originally reported as 372,000, was the highest since April 2010. In short, New Homes Sales Dip, but Prices Hit 5-Year High. |
|
|
Wed |
EIA Crude Oil Report |
U.S. stocks of crude fell by 2.45 million barrels to 365.18 million barrels, on large drop in imports: EIA reported. Analysts had forecast a stock increase of 900,000 barrels. |
-2.4M
Barrels
|
|
|
Commodity |
U.S. crude oil and refined product stockpiles fell unexpectedly last week as crude imports plunged, government data showed on Wednesday. |
|
|
Thu |
Jobless/Initial Claims |
Initial claims for state unemployment benefits dropped 26,000 to a seasonally adjusted 359,000, the lowest level since July. The prior week's figure was revised up to show 3,000 more applications than previously reported. |
359K |
|
|
Employment |
The number of Americans who applied last week for unemployment benefits fell to the lowest level since late July, but claims remained in a narrow range, suggesting little acceleration in a slowly healing labor market. |
|
|
Thu |
Gross Domestic Product (GDP) |
GDP expanded at a 1.3% annual rate in Q2-2012, the slowest pace since Q3-2012 and down from last month's 1.7% estimate, the Commerce Department said in its third and final estimate. Apparently consumers and businesses spent and invested less than initially believed. |
1.3% |
|
|
Growth |
Economic growth was much weaker than previously estimated in Q2-2012 as a drought cut into inventories, setting the platform for an even more sluggish performance in the current quarter against the backdrop of slowing factory activity. |
|
|
Thu |
Durable Goods Orders |
New durable goods orders in August fell by the most since the recession and a separate reading on the broader U.S. economy came in much weaker than expected. |
-13.2% |
|
|
Manufacturing |
Durable goods orders dived 13.2%, the largest drop since January 2009, when the economy was in the throes of a recession. Orders for July were revised down to show a 3.3% increase instead of the previously reported 4.1% gain. |
|
|
Thu |
Corporate Profits |
Corporate profits climbed $21.8 billion in the second quarter, compared to a prior estimate of a $10.4 million increase. By contrast, corporate profits declined by $53.0 billion in the first quarter. Corporate profits in Q2-2012 decreased to $1.665 trillion annualized, compared to $1.671 trillion in Q1-2012. |
$1,665 |
|
|
Growth |
After-tax corporate profits unexpectedly rose at a 2.2% rate instead of the previously reported 1.1% increase. After-tax profits fell 8.6% in the first quarter. |
|
|
Thu |
Pending Home Sales |
Fewer Americans signed contracts to buy existing homes in August. After gains in home sales over the spring and summer pending home sales dropped 2.6% from July. This drop forecasts that final closings on existing homes will be lower heading into fall. |
99.2
Level
|
|
|
Real Estate |
Contract signings have been up Y/Y for sixteen consecutive months, which indicates overall home sales will be higher in 2012 than 2011. The Realtors predict a 9% gain to 4.64 million units. |
|
|
Thu |
EIA Natural Gas Report |
The EIA said natural-gas inventories rose 80 billion cubic feet in the week ended Sept. 21 to 3.576 trillion cubic feet. |
80 bcf |
|
|
Commodity |
Natural gas futures surged 2.6% to 2012 highs Thursday as cooler weather forecasts signalled a coming increase in gas-fired heating needs. |
|
|
Thu |
Fed Balance Sheet |
The U.S. Federal Reserve's balance sheet shrank in the latest week with reduced holdings of agency and mortgage-backed securities despite the central bank's increased bond purchases, |
$-17.2
Billions
|
|
|
Government |
The Fed's balance sheet - a broad gauge of its lending to the financial system - stood at $2.787 trillion on September 26, down from $2.804 trillion on September 19. |
|
|
Thu |
M2 Money Supply |
|
$13.8
Billions |
|
|
Money Supply |
|
|
|
Fri |
Fixed Mortgage Rates |
Mortgage finance backer Freddie Mac's weekly survey showed the average 30-year fixed-rate mortgage fell to 3.40% from 3.49% the previous week, matching the previous record low set in July. |
3.40% |
|
|
Interest Rates |
The fixed-rate 15-year mortgage also hit a record low of 2.73%, down from the previous record of 2.77% a week earlier. |
|
|
Fri |
Personal Income and Outlays |
Personal income inched up 0.1% last month on a seasonally adjusted basis. And July’s increase in wages was marked down to 0.1% from 0.3%. The big concern is that the rise in spending isn't being supported by faster wage growth. |
0.1% |
|
|
Consumer |
A sharp drop in savings over the past two months is a potentially negative sign for growth in the months ahead. Consumers cannot keep spending faster than their incomes grow, especially since their savings rate is already on the low side. |
|
|
Fri |
Consumer Spending Real PCE |
Consumers boosted spending in August by the biggest amount in six months, but their wages grew more slowly so they had to dip into their savings to pay for their purchases. |
0.5%
M/M
|
|
|
Consumer |
Spending rose by 0.5% in August that is the fastest rate since February and marked the second straight sharp gain. |
|
|
Fri |
Core PCE |
Inflation remained relatively tame last month. The personal consumption expenditure price index rose 0.1% in August, putting its increase over the past 12 months at 1.5%. |
0.1% |
|
|
Inflation |
Core PCE, which excludes volatile food and energy costs, also rose 0.1% for the second straight month, in line with expectations. Over the past year, core PCE inflation has risen 1.6%. |
|
|
Tue |
Chicago PMI |
|
3.40% |
|
|
Manufacturing |
|
|
|
Fri |
Consumer Sentiment |
Consumer Sentiment Rises, but Falls Short of Forecast 79. U.S. consumer sentiment rose to its highest level in four months in September as Americans saw better prospects for the job market and economy, |
78.3 |
|
|
Consumer |
The Thomson Reuters/University of Michigan's final reading on consumer sentiment rose to 78.3 from 74.3 in August, the highest level since May. |
|
|
|
|
|
|
|
|
| |
|
|
|
|
|
|
|
|
|
|
|
|
| |
|
|
|
|
| |
|
|
|
|
 |
Glossary: |
 |
Current Week |
|
Chart View |
 |
Positive View |
 |
Negative View |
 |
Neutral View |
 |
Non Available |
|
| |
|
|
|
|
|
| |
|
|
|
|
| |
|
| WEEK 39-2012 ENDING SEP. 28 |
Reports Commentary
Home prices kept rising in July across the United States, buoyed by greater sales and fewer foreclosures. Despite continuing economic uncertainty, consumers are slightly more optimistic than they have been in several months: Consumer-confidence gauge rises to 7-month high.
US Home Prices Rose for Sixth Month in a Row: Case-Shiller. Six years after its collapse, economists believe the housing market has turned a corner. The home price data confirmed "recent good news'' about the sector.
Home sales have been bolstered by the lowest mortgage rates on record. The average rate on the 30-year fixed mortgage touched a record low of 3.49 percent last week and has been below 4 percent all year. A limited supply of homes has also helped drive prices higher.
Still, many Americans, particularly first-time homebuyers, are unable to qualify for a mortgage or can't afford larger down payments required by banks. That's holding back sales
Home sales could get a further boost from the Federal Reserve. The Fed said two weeks ago that it would purchase $40 billion of mortgage-backed securities each month until the economy and hiring improve substantially. That's likely to keep mortgage rates at record-low rates for some time.
The two leading store sales indexes, the ICSC-Goldman and Redbook, are now up 2.9% and 2.0% year over year, respectively.
Fixed 30-year mortgage rates tumbled 9 basis points to average 3.63 percent, the lowest level in the history of the survey.The drop in rates followed the Fed's announcement it will purchase $40 billion in mortgage-backed securities every month until there is improvement in the labor market.
Sales of new single-family homes in the U.S. fell slightly in August to a 373,000 annual pace from July's slightly revised level of 374,000, the Commerce Department said Wednesday. The inventory of new homes on the market held near record lows last month. At August's sales pace it would take 4.5 months to clear the houses on the market, unchanged from July.
Refineries cut back production of gasoline where inventories are down 0.5 million barrels which is the ninth straight weekly draw though the lowest of the streak. Distillate inventories are also down 0.5 million barrels for a second straight draw.
Brent crude oil fell more than 1% to below $109 a barrel on Wednesday as the euro zone crisis deepened with violent clashes and a general strike in Greece and more bad economic news for Spain.
The labor market has been mired in weakness as worries about higher taxes and deep government spending cuts in January, the ongoing debt problems in Europe and slowing global growth lead employers to be cautious about ramping up hiring.
Sluggish job gains and stubbornly high unemployment spurred the Federal Reserve this month into launching a third round of bond purchases to drive down already low interest rates.
The U.S. central bank vowed to buy $40 billion worth of mortgage-backed securities each month until it sees a sustained upturn in the labor market.
The unemployment rate has been stuck above 8 percent for more than three years, the first time this has happened since the Great Depression, a hurdle for President Barack Obama's quest for a second term in office.
What’s more, another slowdown in the U.S. economy and dim prospects for a pickup in growth before the end of the year suggests hiring won’t accelerate much until 2013. The unemployment rate, now 8.1%, is not expected to fall much in the near future.
Pending home sales retreat after hitting 2-yr high. The performance in month-to-month contract signings has been uneven with ongoing shortages of lower priced inventory in much of the country, and across most price ranges in the West, but activity has remained at notably higher levels this year.
New home sales for August also disappointed, coming in lower than expected. New home sales are measured by signed contracts, rather than closings.
Many argued that stocks have rallied largely based on bond-buying expectations from the Federal Reserve, rather than healthy factors underpinning the global economy. The Fed’s unfurling of more quantitative easing was mostly a non-event that had already been factored into stock prices.
The Fed's holdings of debt issued by Fannie Mae, Freddie Mac and the Federal Home Loan Bank system totaled $83.41 billion, down from $87.10 billion the previous week.
The Fed announced Sept. 13 that it would be buying $40 billion in mortgage-backed securities each month for the foreseeable future. The idea of the purchases, popularly known as QE3, is to spur economic activity by pumping more cash into the economy and driving down rates. Those taking out new home loans, either to purchase or refinance, will be among the first beneficiaries of the Fed's policy.
For the most part, Americans have generally been reluctant shoppers in 2012, except when it comes to cars and trucks. Auto sales have surged to the highest level in three years, as many consumers replace aged vehicles they normally would have gotten rid of years ago had the economy been better.
Economists say consumer spending is unlikely to rise much faster unless businesses boost investment and hire at a faster pace, putting more money in people’s pockets.
The core index is closely watched by economists and the Federal Reserve to gauge inflationary trends and help determine whether to change interest rates. The central bank typically seeks to keep inflation at 2% or less. Consumers' inflation expectations for a year from now fell to 3.3% from 3.6%, while the five-to-10-year inflation outlook eased to 2.8% from 3%.
|
|
| |
|
|
|
|
|
|
|
|
|
|
|
|
|
|
|
|
|
|
|
|
|
|
|
|
|
| MARKET PROFILE |
 |
WEEKS 2012 |
WEEK 39 |
% FROM CLOSE |
% FROM OPEN |
 |
RESISTANCE 1 |
1,330.25 |
1.39% |
1.35% |
|
RESISTANCE 2 |
1,326.25 |
1.08% |
1.04% |
|
CLOSE MAR 02 |
1,350.00 |
|
|
|
OPEN MAR 04 |
1,255.00 |
0.04% |
|
 |
SUPPORT 1 |
1,289.00 |
0.66% |
0.62% |
|
SUPPORT 2 |
1,283.50 |
0.08% |
0.04% |
|
|
|
|
|
|
|
|
|
| |
|
|
|
|
|
| |
|
|
|
|
|
|
IMPORTANT NOTE: In an effort to comply with all applicable rules, regulations and disclosures please be so kind and read the "General Disclosure" below: |
| |
|
|
|
|
| GENERAL DISCLOSURE - TRADINGVESTING.COM |
- The material contained on our Website and Economic Calendar must be used at your own risk. Material is believed to be reliable, but we do not guarantee its accuracy or validity, nor is Tradingvesting.com responsible for any errors or omissions which may occur. The analysis and/or recommendations made by Tradingvesting.com do not provide, imply, or otherwise constitute a guarantee of performance. All contents and recommendations are based on data and sources believed to be reliable, but accuracy and completeness cannot be guaranteed. It should not be assumed that future results will be profitable or will equal past performance, real, indicated or implied.Tradingvesting.com website and material contained therein is not a solicitation to participate in the Futures/Stocks/Options Market. This Economic Calendar does not include Earning Releases, Announced Stock Splits, Upcoming Initial Public Offerings with Underwritings or Rating Changes. Tradingvesting.com has attempted to verify the information contained in this calendar. However, any aspect of such info may change without notice. Unless indicated otherwise: economic data is from the U.S and intraday data is at least 20 minutes delayed; all prices are in the local currency; Time is U.S. Eastern Time. Furthermore, there is a very high degree of risk involved in trading.Tradingvesting.com assumes no responsibilities for your trading and investment results, please red our Risk Disclosure.
- Tradingvesting.com does not provide investment advice, and does not represent that any of the information or related analysis is accurate or complete at any time. All information on this website are for educational purposes only and are not intended to provide financial advice. Any statements about profits or income, expressed or implied, do not represent a guarantee. Your actual trading may result in losses as no trading system is guaranteed. You accept full responsibilities for your actions, trades, profit or loss, and agree to hold Tradingvesting.com and any authorized distributors of this information harmless in any and all ways. We respect your right to privacy, please click here to view our privacy policy.
- U.S. Government Required Disclaimer - Commodity Futures Trading Commission.
Futures and options trading has large potential rewards, but also large potential risk. You must be aware of the risks and be willing to accept them in order to invest in the futures and options markets. Don't trade with money you can't afford to lose. This website is neither a solicitation nor an offer to Buy/Sell futures or options. No representation is being made that any account will or is likely to achieve profits or losses similar to those discussed on this website. The past performance of any trading system or methodology is not necessarily indicative of future results.
- CFTC rule 4.41:Hypothetical or simulated performance results have certain limitations. Unlike an actual performance record, simulated results do not represent actual trading. Also, since the trades have not been executed, the results may have under-or-over compensated for the impact, if any, of certain market factors, such as lack of liquidity. Simulated trading programs in general are also subject to the fact that they are designed with the benefit of hindsight. No representation is being made that any account will or is likely to achieve profit or losses similar to those shown.
- Risk Warning: Trading foreign exchange on margin carries a high level of risk, and may not be suitable for all investors. The high degree of leverage can work against you as well as for you. Before deciding to invest in foreign exchange you should carefully consider your investment objectives, level of experience, and risk appetite. The possibility exists that you could sustain a loss of some or all of your initial investment and therefore you should not invest money that you cannot afford to lose. You should be aware of all the risks associated with foreign exchange trading, and seek advice from an independent financial advisor if you have any doubts. Our linking to these sites does not constitute an endorsement of any products, services or the information found on them. Once you link to another site you are subject to the policies of the new site. By using this site, you agree to the Terms of Service, Privacy Policy and Risk Disclosure. Copyright � 2012 Tradingvesting, LLC. All rights reserved. If you have any questions regarding the Online Economic Calendar application, please contact us: click here.
THIS BRIEF STATEMENT CANNOT, OF COURSE, DISCLOSE ALL THE RISKS AND OTHER ASPECTS OF THE COMMODITY MARKETS AND EQUITY MARKETS. PLEASE READ MORE AT: TERMS OF SERVICE.
|
|
|
| |
|
|
|
|
|
| |
|
|
|
|
|