 |
 |
|
|
|
Week 09 -2012 | From Feb 27 to Mar 02, 2012 |
|
 |
|
|
|
|
|
|
| |
|
|
|
|
|
|
|
|
|
|
| |
Economic Data for Week 09-2012 | Global View | Week Rating
| DATE |
DAY |
REPORT/CATEGORY |
HIGHLIGHTS: WEEK 09-2012 |
LAST |
|
Mon |
Pending Home Sales Index |
Pending home sales climbed 2% in January to the highest level since April 2010, when buyers were taking advantage of a now-expired tax credit. |
97
Level |
|
 |
Real Estate |
The pending-home-sales index rose to 97.0 from a downwardly revised 95.1 reading in December. Even without the revision, the index would have shown growth: December's index was 96.6. |
|
|
Tue |
ICSC Goldman Index |
The ICSC Index slipped 1% in the week ended Saturday from the week before on a seasonally adjusted, comparable-store basis, after rising strongly the previous week. |
-1.4% W/W |
|
|
Sales and Inventories |
A blast of warm temperatures rolled in again and gasoline prices continued to climb, which collectively helped to soften sales this past week. |
|
|
Tue |
Durable Goods Orders |
Orders for long-lasting U.S. goods fell a bigger-than-expected 4.0% in January, as demand for a broad array of products declined. |
-4.0% M/M |
|
|
Manufacturing |
The increase in durable-goods orders in December, meanwhile, was revised up to 3.2% from 3.0%. Orders for U.S. durable goods sink 4.0% in January. |
|
|
Tue |
Johnson Redbook |
President's Day sales offered opportunities to clear remaining winter inventories as retailers said sales in the final week of February held up better with warmer weather |
2.5% Y/Y |
|
|
Sales and Inventories |
The Johnson Redbook Index also showed seasonally adjusted sales for the period were up 2.9% from last year, compared with a 2.8% targeted gain. |
|
|
Tue |
S&P Case-Shiller Index |
U.S. home prices fell 1.1% NSA and 0.5% SA in December to bring the year-over-year fall to 4%, according to the Case-Shiller home price index released Tuesday. |
-0.5% M/M |
|
|
Real Estate |
The 20-city composite is at its lowest level since the housing crisis began in mid-2006. Prices in hard-hit Detroit declined 3.8% in December, and only Phoenix and Miami saw price gains. |
|
|
Tue |
Consumer Confidence |
A gauge of U.S. consumer confidence rose to 70.8 in February, reaching the highest level in a year, with more optimism on jobs. |
70.8
Level |
|
|
Consumer |
Consumers are considerably less pessimistic about current business and labor market conditions. The January reading for confidence was revised to 61.5 from a prior estimate of 61.1. |
|
|
Wed |
MBA purchase Applications |
Applications for home mortgage purchases jumped last week as interest rates dipped, though demand for refinancing waned. |
-0.3% W/W |
|
|
Real Estate |
Purchase application volume increased over the week, but remains within the narrow and anemic range of activity we have seen since the expiration of the homebuyer tax credit in May 2010. |
|
|
Wed |
Gross Domestic Product (GDP) |
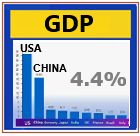
That's a major improvement from a 1.8% growth rate in the prior quarter, and the fastest growth since the second quarter of 2010. |
3.0%
Annual |
|
|
Growth |
Gross domestic product, the broadest measure of the nation's economy, grew at a 3% annual rate in the fourth quarter of 2011. |
|
|
Wed |
Chicago PMI |
The Chicago business barometer, which also is known as the Chicago PMI, accelerated to a reading of 64.0% in February from 60.2% in January. |
64.0
Level |
|
|
Manufacturing |
The index measuring production was the highest since April, new orders hit an 11-month high, order backlogs moved out of contraction and employment had the biggest one-month gain since March 2008. |
|
|
Wed |
EIA Crude Oil Report |
A slowing in refinery inputs contributed to a large 4.2 million barrel build in oil inventories to 344.9 million barrels in the February 24 week. |
4.2M
Barrels |
|
|
Commodity |
Facing weakening demand tied to rising fuel prices, refineries slowed production in the week, operating at 83.6% of capacity for a nearly two percentage point weekly dip. |
|
|
Wed |
Beige Book 2 |
The Federal Reserve reported Wednesday that the U.S. economy is continuing to grow, but slowly. Nationally, the report said, Economic activity continued to increase at a modest to moderate pace. |
N/A |
|
|
Interest Rates |
The Federal Reserve said the U.S. economy expanded modestly in January through mid-February as hiring picked up a bit across several districts. |
|
|
Thu |
Motor Vehicle Sales |
Auto sales hit highest mark since early 2008; compact cars drive gains. Last year, the industry sold about 13 million cars and light trucks. |
15.10M |
|
|
Sales and Inventories |
The seasonally adjusted rate for sales passed 15 million vehicles in February, a 1 million-vehicle increase from a surprisingly good January. |
|
|
Thu |
Jobless/Initial Claims |
The number of Americans filing first-time claims for jobless benefits fell to a level matching a four-year low, more evidence the labor market is healing. |
351,000 claims |
|
|
Employment |
Applications for unemployment insurance decreased 2,000 in the week ended Feb. 25 to 351,000, Labor Department figures showed today. |
|
|
Thu |
Personal Income |
Personal income growth slowed but remained healthy in January while spending improved a little. Personal income in January increased 0.3% after a 0.5% boost the month before. |
0.3% M/M |
|
|
Consumer |
Personal income increased 0.3% from the prior month while spending rose 0.2%, the Commerce Department said Thursday. In December, spending was flat, but incomes rose 0.5%. |
|
|
Thu |
Real PCE |
Consumer spending rose less than expected in January even as incomes improved, an indication that Americans may still be unsure about the slowly recovering economy. |
0.2% M/M |
|
|
Consumer |
Consumers faced higher prices to start the year. The price index for personal consumption expenditures increased 2.4% on a year-over-year basis in January |
|
|
Thu |
Core PCE |
The core PCE index, which excludes volatile food and energy prices, moved up 1.9% on a year-over-year basis in January. The measure rose a monthly 0.2% in January. |
0.2% M/M |
|
|
Inflation |
Core prices were up a monthly 0.1% in December. Economists had expected core prices to climb 0.2% in January. |
|
|
Thu |
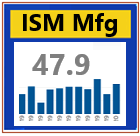
ISM Manufacturing Index |
The PMI registered 52.4%, a decrease of 1.7 percentage points from January�s reading of 54.1%, indicating expansion in the manufacturing sector for the 31st consecutive month. |
52.4 Level |
|
|
Manufacturing |
The New Orders Index registered 54.9%, a decrease of 2.7 percentage points from January�s reading of 57.6%, reflecting the 34th consecutive month of growth in new orders. |
|
|
Thu |
Construction Spending |
A sharp drop in commercial building projects caused a slight decline in construction spending in January. But the dip comes after previous figures were revised much�higher. |
-0.1% |
|
|
Growth |
Construction spending edged down 0.1% in January, the Commerce Department reported Thursday. That is the first drop since July. |
|
|
Thu |
EIA Natural Gas Report |
The EIA said natural-gas inventories fell just 82 bcf last week to 2,513 bcf, as mild temperatures across the country continue to keep a lid on demand for natural gas used to heat homes and offices. |
-82 bcf |
|
|
Commodity |
Natural-gas prices fell 5.9% after a government report showed a smaller-than-expected drop in inventories last week, underscoring weak demand for the fuel. |
|
|
Thu |
U.S. Fed Balance Sheet |
For the February 29 week, the Fed's balance sheet fell $7.1 billion after declining $5.1 billion the week before. The decline was led by a $12.3 billion decrease in mortgage-backed securities. |
$-7.1B W/W |
|
|
Government |
Total assets for the February 29 week decreased to $2.928 trillion. Holdings of Treasuries were partially offsetting, gaining $4.9 billion. |
|
|
Thu |
M2 Money Supply |
Apparently, Operation Twist is not entirely smooth every week as mortgage-backed securities fell faster than gains in Treasury holdings. |
$-10.5B W/W |
|
|
Money Supply |
|
|
|
Fri |
Fixed Mortgage Rates |
Interest rates on fixed rate mortgages fell this week with the 30-year fixed rate averaging 3.90 % with an average of 0.8 points, down from an average of 3.95 % last week. A year ago, averaged 4.87 %. |
3.90%
APR
|
|
|
Interest Rates |
The 15-year fixed rate mortgage averaged 3.17% with an average of 0.8 points, down from last week�s average of 3.19%. At this time last year, the 15-year fixed rate mortgage averaged 4.15 %. |
|
|
Fri |
Non Reports for Our Global Vision |
|
N/A |
|
|
No Reports |
|
|
|
|
|
|
|
|
|
| |
|
|
|
|
|
|
|
|
|
|
|
|
| |
|
|
|
|
| |
|
|
|
|
 |
Glossary: |
 |
Current Week |
|
Chart View |
 |
Positive View |
 |
Negative View |
 |
Flat View |
 |
Non Available |
|
| |
|
|
|
|
| |
|
|
|
|
|
|
|
|
|
|
| |
|
| WEEK 09-2012 ENDING MAR. 02 |
Reports Commentary
The S&P/Case-Shiller 20-city composite fell 1.1% in December, to wrap up 2011 with a 4% downturn. The index hasn�t been this low since February 2003 and has dropped 33.8% from its peak.
The U.S. economy grew 3% in the fourth quarter, faster than originally reported, mainly because of increased commercial construction and consumer spending and lower imports, the government reported Wednesday. It was still the fastest increase in a year and a half, according to revised Commerce Department data. |
|
| |
|
|
|
|
|
|
|
|
|
|
|
|
|
|
|
|
|
|
|
|
|
|
|
|
|
| MARKET PROFILE |
 |
WEEKS 2012 |
WEEK 09 |
% FROM CLOSE |
% FROM OPEN |
 |
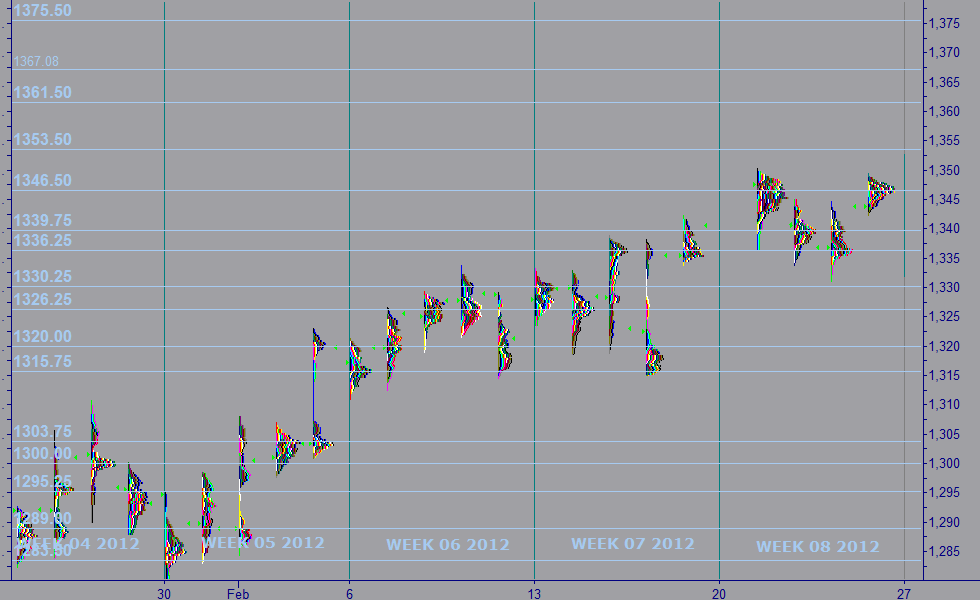
RESISTANCE 1 |
1,361.50 |
1.26% |
1.15% |
|
RESISTANCE 2 |
1,353.50 |
0.67% |
0.52% |
|
CLOSE FEB 24 |
1,344.50 |
|
|
|
OPEN FEB 26 |
1,347.00 |
0.19% |
|
 |
SUPPORT 1 |
1,336.25 |
0.61% |
-0.86% |
|
SUPPORT 2 |
1,320.00 |
-1.82% |
-2.15% |
|
|
|
|
|
|
|
|
|
| |
|
|
|
|
|
| |
|
|
|
|
|
|
IMPORTANT NOTE: In an effort to comply with all applicable rules, regulations and disclosures please be so kind and read the "General Disclosure" below: |
| |
|
|
|
|
| GENERAL DISCLOSURE - TRADINGVESTING.COM |
- The material contained on our Website and Economic Calendar must be used at your own risk. Material is believed to be reliable, but we do not guarantee its accuracy or validity, nor is Tradingvesting.com responsible for any errors or omissions which may occur. The analysis and/or recommendations made by Tradingvesting.com do not provide, imply, or otherwise constitute a guarantee of performance. All contents and recommendations are based on data and sources believed to be reliable, but accuracy and completeness cannot be guaranteed. It should not be assumed that future results will be profitable or will equal past performance, real, indicated or implied.Tradingvesting.com website and material contained therein is not a solicitation to participate in the Futures/Stocks/Options Market. This Economic Calendar does not include Earning Releases, Announced Stock Splits, Upcoming Initial Public Offerings with Underwritings or Rating Changes. Tradingvesting.com has attempted to verify the information contained in this calendar. However, any aspect of such info may change without notice. Unless indicated otherwise: economic data is from the U.S and intraday data is at least 20 minutes delayed; all prices are in the local currency; Time is U.S. Eastern Time. Furthermore, there is a very high degree of risk involved in trading.Tradingvesting.com assumes no responsibilities for your trading and investment results, please red our Risk Disclosure.
- Tradingvesting.com does not provide investment advice, and does not represent that any of the information or related analysis is accurate or complete at any time. All information on this website are for educational purposes only and are not intended to provide financial advice. Any statements about profits or income, expressed or implied, do not represent a guarantee. Your actual trading may result in losses as no trading system is guaranteed. You accept full responsibilities for your actions, trades, profit or loss, and agree to hold Tradingvesting.com and any authorized distributors of this information harmless in any and all ways. We respect your right to privacy, please click here to view our privacy policy.
- U.S. Government Required Disclaimer - Commodity Futures Trading Commission.
Futures and options trading has large potential rewards, but also large potential risk. You must be aware of the risks and be willing to accept them in order to invest in the futures and options markets. Don't trade with money you can't afford to lose. This website is neither a solicitation nor an offer to Buy/Sell futures or options. No representation is being made that any account will or is likely to achieve profits or losses similar to those discussed on this website. The past performance of any trading system or methodology is not necessarily indicative of future results.
- CFTC rule 4.41:Hypothetical or simulated performance results have certain limitations. Unlike an actual performance record, simulated results do not represent actual trading. Also, since the trades have not been executed, the results may have under-or-over compensated for the impact, if any, of certain market factors, such as lack of liquidity. Simulated trading programs in general are also subject to the fact that they are designed with the benefit of hindsight. No representation is being made that any account will or is likely to achieve profit or losses similar to those shown.
- Risk Warning: Trading foreign exchange on margin carries a high level of risk, and may not be suitable for all investors. The high degree of leverage can work against you as well as for you. Before deciding to invest in foreign exchange you should carefully consider your investment objectives, level of experience, and risk appetite. The possibility exists that you could sustain a loss of some or all of your initial investment and therefore you should not invest money that you cannot afford to lose. You should be aware of all the risks associated with foreign exchange trading, and seek advice from an independent financial advisor if you have any doubts. Our linking to these sites does not constitute an endorsement of any products, services or the information found on them. Once you link to another site you are subject to the policies of the new site. By using this site, you agree to the Terms of Service, Privacy Policy and Risk Disclosure. Copyright � 2012 Tradingvesting, LLC. All rights reserved. If you have any questions regarding the Online Economic Calendar application, please contact us: click here .
THIS BRIEF STATEMENT CANNOT, OF COURSE, DISCLOSE ALL THE RISKS AND OTHER ASPECTS OF THE COMMODITY MARKETS AND EQUITY MARKETS. PLEASE READ MORE AT: TERMS OF SERVICE.
|
|
|
| |
|
|
|
|
|
| |
|
|
|
|
|