 |
 |
|
|
|
Week 03 -2012 | From Jan 16 to Jan 20, 2012 |
|
 |
|
|
|
|
|
|
| |
|
|
|
|
|
|
|
|
|
|
| |
Economic Data for Week 03-2012 | Global View
| Week Rating
| DATE |
DAY |
REPORT/CATEGORY |
HIGHLIGHTS: WEEK 03-2012 |
LAST |
|
Mon |
Martin Luther King Jr. Day |
All major American stock exchanges, NYSE, NASDAQ and American Stock Exchange, follow these same holiday schedules |
N/A |
|
|
US Market Holidays |
Bond, Equity Markets Closed |
|
|
Tue |
Empire State Mfg Survey |
The Empire State Manufacturing Survey indicates that manufacturing activity expanded in New York State in January. The general business conditions index climbed points to 13.5. |
|
|
 |
Manufacturing |
Business conditions improved in January, with the general business conditions index rising five points to 13.5. This index has been on a clear upward trend since October 2011. |
|
|
Wed |
MBA purchase Applications |
The MBA's seasonally adjusted index of mortgage application activity, which includes both refinancing and home purchase demand, jumped 23.1% in the week ended January 13. |
23.1% |
|
|
Real Estate |
Applications for home mortgages surged more than 20% last week, fueled by a wave of refinancing demand as interest rates dropped. |
|
|
Wed |
ICSC-Goldman Store Sales |
US ICSC/Goldman Sachs Chain Store Sales +0.1% In Jan 14 Wk. The weekly increase, retail sales on a year-over-year basis bounced back and rose by 3.0%. |
0.1% W/W |
|
|
Sales and Inventories |
Despite the continuation of mild weather across the country consumers continued to redeem their holiday gift cards and gave retailers their first week of positive sales results for 2012. |
|
|
Wed |
Producer Price Index |
The Producer Price Index for finished goods declined 0.1% in December. Prices for finished goods moved up 0.3% in November and fell 0.3% in October. |
-0.1% |
|
|
Inflation |
The index for finished goods less foods and energy increased 0.3%. U.S. Producer Price Index Unexpectedly Falls in December: Lower Inflationary Pressure on Production Line. |
|
|
Wed |
Johnson Redbook |
The Johnson Redbook Retail Sales Index was up 2.8% in the second week of January following a 3.3% gain in the previous week. |
2.8% W/W |
|
|
Sales and Inventories |
This past week was another week of light volume for the nation's retailers as unseasonable mild weather put a damper on the need for seasonal merchandise. |
|
|
Wed |
Treasury Intal Capital |
Demand for safety during November gave a boost to foreign demand for US financial securities. Foreign accounts bought a net $58.0 billion of long term US securities |
$59.8B |
|
|
Balance of Payments |
Turbulence in the commodity and stock markets, a flow towards the safety of the US bond market makes sense. |
|
|
Wed |
Industrial Production |
Industrial Production in U.S. Rose 0.4% on Business Equipment. Manufacturing has bounced back from the lull that we have seen with the global upheavals. |
0.4% |
|
|
Manufacturing |
U.S. industrial production rebounded in December, reflecting gains in demand for business equipment, automobiles and construction materials. |
|
|
Wed |
Housing Market Index |
Rising four points to 25 on the NAHB/Wells Fargo Housing Market Index (HMI), the highest level since June 2007. |
25
Level |
|
|
Real Estate |
Builder confidence in the market for newly built, single-family homes continued to climb for a fourth consecutive month in January. |
|
|
Thu |
Consumer Price Index |
Consumer prices were unchanged last month, the latest sign that inflation remains tame. Lower gas prices offset rising costs for food, medical care and housing. |
|
|
|
Inflation |
The consumer price index was flat in December for the second straight month. Excluding volatile food and energy costs, so-called "core" prices rose 0.1%. |
|
|
Thu |
Jobless/Initial Claims |
Applications for unemployment insurance payments plunged by 50,000 to 352,000 in the week ended Jan. 14, less than forecast and the fewest since April 2008. |
|
|
|
Employment |
Claims for jobless benefits last week dropped to the lowest level in almost four years, pointing to an improvement in the U.S. job market that may help bolster spending in the new year. |
|
|
Thu |
Housing Starts |
U.S. Housing Starts Drop 4.1%, Worse Than Forecast. Housing starts dropped 4.1% to a 657,000 annual rate last month, reflecting a slump in multifamily dwellings. |
|
|
|
Real Estate |
Builders began work on fewer houses than forecast in December, capping the worst year on record for single-family home construction and signaling recovery in the industry will take time. |
|
|
Thu |
Building Permits |
Permits are encouraging. Housing permits held steady, nudging down a mere 0.1%, following a 5.6% advance in November. |
|
|
|
Real Estate |
The December ease in permits was led by a 3.7% decrease in multifamily permits after a 13.0% boost the month before. Single-family permits rose 1.8%, following a 1.9% increase in November.
|
|
|
Thu |
Philadelphia Fed Survey |
The Philadelphia Fed said its index of general business activity within the factory sector rose to 7.3 in January from 6.8 in December. |
|
|
|
Business Activity |
Philadelphia manufacturers remain very optimistic about the future. Within the Philly Fed survey, the subindexes were positive but slower this month. |
|
|
Thu |
Fixed Mortgage Rates |
The average rate on a 30-year fixed mortgage reached a new low this week, falling to 3.88%, which is a fraction of a percentage point below last week�s 3.89%, the previous record low. |
|
|
|
Interest Rates |
The average 15-year mortgage rate, which is popular among homeowners who are refinancing, hit 3.17%, up from last week�s 3.16% figure. |
|
|
Thu |
EIA Natural Gas Report |
US Natural gas futures slumped to a 10-year low last tuesday, as warm winter weather dampens demand and pressures prices that are already falling on record supplies. |
|
|
|
Commodity |
Natural gas in storage fell 87 billion cubic feet in the January 13 week to 3,290 bcf. A withdrawal of 90 bcf was expected. |
|
|
Thu |
EIA Crude Oil Report |
Inventory data show a 3.4 million barrel draw for oil, a draw that follows 3 weeks of builds. Light crude is down 50 cents to the $101 area following today's report. |
|
|
|
Commodity |
This report is offering a leading signal of weakness for final demand, one that runs counter to the general trend of economic indications. |
|
|
Thu |
Fed Balance Sheet |
This past week, the Fed's balance sheet expanded, reflecting Operation Twist and the Fed providing liquidity to Europe. Fed Balance Sheet Grows To $2.92 Trillion In Latest Week. |
|
|
|
Government |
For the January 18 week, the Fed's balance sheet expanded $20.2 billion after falling $18.6 billion the week before. |
|
|
Thu |
M2 Money Supply |
US money supply (M2) has surged in a parabolic manner in the last few weeks and is up by more than 50% year to date and up 33% in just 4 months - from June 1st to October 1st. |
|
|
|
Money Supply |
|
|
|
Fri |
Fixed Mortgage Rates |
The average rate on a 30-year fixed mortgage reached a new low this week, falling to 3.88%, which is a fraction of a percentage point below last week�s 3.89%, the previous record low. |
3.88%
APR
|
|
|
Interest Rates |
The average 15-year mortgage rate, which is popular among homeowners who are refinancing, hit 3.17%, up from last week�s 3.16% figure. |
|
|
Fri |
HSBC China Flash PMI |
China Factories See Sluggish Start in 2012: HSBC PMI. The HSBC flash manufacturing purchasing managers index (PMI), stood at 48.8 in January. January flash manufacturing PMI inched up to a reading of 48.8 from 48.7 in December indicating continued weakness. |
48.8 |
|
|
Chiina |
China's manufacturers started 2012 in a sluggish mode, suggesting Beijing will keep pulling pro-growth policy levers despite some early signs that a downward drift in factory activity is slowing. The reading was a three month high. |
|
|
Fri |
Existing Home Sales |
Existing home sales rise 5% in December to a seasonally adjusted annual rate of 4.61 million. November sales were revised down to 4.39 million from an initially reported 4.42 million. |
4.61M Level |
|
|
Real Estate |
Inventories fell 9.2% to 2.38 million, which represents 6.2 months of supply: the lowest inventory since April 2006, though inventory levels are generally low in the winter |
|
|
|
|
|
|
|
|
|
|
|
|
|
|
|
|
|
|
|
|
|
|
|
|
|
|
| |
|
|
|
|
 |
LEGENDS: |
 |
Current Week |
|
Chart View |
 |
Positive View |
 |
Negative View |
 |
Flat View |
 |
Non Available |
|
| |
|
|
|
|
| |
|
|
|
|
|
|
|
|
|
|
| |
|
| WEEK 03-2012 ENDING JAN. 20 |
Reports Commentary
Sales cooled off in the second week as consumer appetite for clearance bargains became partially satiated and year-end clearance dominated sales activity. As a result, for the week ending January 14, 2012, weekly retail sales rose by 0.1%.
U.S. Producer Price Index Unexpectedly Falls in December: Lower Inflationary Pressure on Production Line. Outlook of U.S. inflation is pretty good� and �commodity prices are no longer trending higher�
Builder confidence has now risen four months in a row, with the latest uptick being universally represented across every index component and region.
Inflation appears to be peaking after rising steeply last year. Prices rose 3% in 2011, up from a 1.5% pace in 2010 and the most since 2007.
Four years after housing helped spark the last recession, falling home prices and ongoing foreclosures are hampering an industry-wide recovery.
Jobless claims, which tend to be volatile week to week around holidays, have trended down over the past month, a sign employment may pick up after payrolls grew by 200,000 in December. Jobless Claims in U.S. Fall to Lowest Since 2008.
Mortgage rates were nearly unchanged this holiday week in lieu of a mixed bag of economic data reports and the Fed's asset holdings in the week ended Jan. 18 climbed to $2.922 trillion, from $2.902 trillion a week earlier.
The U.S. Federal Reserve's balance sheet rose over the last week as the central bank continued with its plan to extend maturities and support economic growth.
Concern over Chinese economic growth after the Jan HSBC flash China manufacturing PMI rose +0.1 to 48.4 and shows China's manufacturing activity may have contracted for a third month.
Red Flag: Smaller-than-expected increase in Dec existing home sales (+5.0% to 4.61 million versus expectations of +5.2% to 4.65 million). |
|
| |
|
|
|
|
|
|
|
|
|
|
|
|
|
|
|
|
| |
|
|
|
|
|
|
|
|
|
|
|
|
|
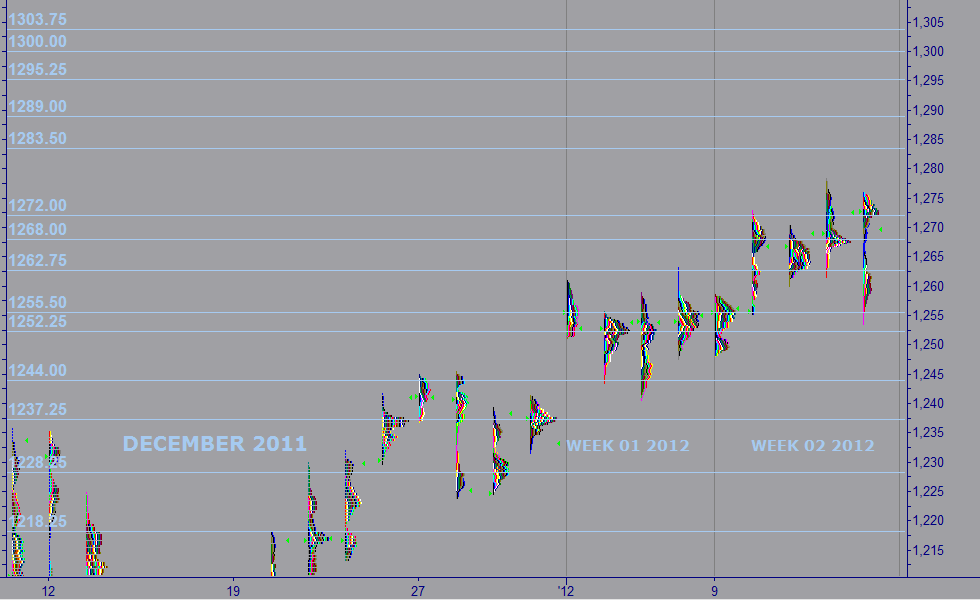
| MARKET PROFILE |
 |
WEEKS 2012 |
WEEK 03 |
% FROM CLOSE |
% FROM OPEN |
 |
RESISTANCE 1 |
1,289.00 |
1.54% |
1.83% |
|
RESISTANCE 2 |
1,283.50 |
1.10% |
1.39% |
|
CLOSE JAN 13 |
1,269.50 |
|
|
|
OPEN JAN 15 |
1,266.00 |
-0.28% |
|
 |
SUPPORT 1 |
1,252.25 |
-1.36% |
-1.10% |
|
SUPPORT 2 |
1,268.00 |
-0.12% |
0.16% |
|
|
|
|
|
|
|
|
|
| |
|
|
|
|
| |
|
|
|
|
|
| |
|
|
|
|
|
|
IMPORTANT NOTE: In an effort to comply with all applicable rules, regulations and disclosures please be so kind and read the "General Disclosure" below: |
| |
|
|
|
|
| GENERAL DISCLOSURE - TRADINGVESTING.COM |
- The material contained on our Website and Economic Calendar must be used at your own risk. Material is believed to be reliable, but we do not guarantee its accuracy or validity, nor is Tradingvesting.com responsible for any errors or omissions which may occur. The analysis and/or recommendations made by Tradingvesting.com do not provide, imply, or otherwise constitute a guarantee of performance. All contents and recommendations are based on data and sources believed to be reliable, but accuracy and completeness cannot be guaranteed. It should not be assumed that future results will be profitable or will equal past performance, real, indicated or implied.Tradingvesting.com website and material contained therein is not a solicitation to participate in the Futures/Stocks/Options Market. This Economic Calendar does not include Earning Releases, Announced Stock Splits, Upcoming Initial Public Offerings with Underwritings or Rating Changes. Tradingvesting.com has attempted to verify the information contained in this calendar. However, any aspect of such info may change without notice. Unless indicated otherwise: economic data is from the U.S and intraday data is at least 20 minutes delayed; all prices are in the local currency; Time is U.S. Eastern Time. Furthermore, there is a very high degree of risk involved in trading.Tradingvesting.com assumes no responsibilities for your trading and investment results, please red our Risk Disclosure.
- Tradingvesting.com does not provide investment advice, and does not represent that any of the information or related analysis is accurate or complete at any time. All information on this website are for educational purposes only and are not intended to provide financial advice. Any statements about profits or income, expressed or implied, do not represent a guarantee. Your actual trading may result in losses as no trading system is guaranteed. You accept full responsibilities for your actions, trades, profit or loss, and agree to hold Tradingvesting.com and any authorized distributors of this information harmless in any and all ways. We respect your right to privacy, please click here to view our privacy policy.
- U.S. Government Required Disclaimer - Commodity Futures Trading Commission.
Futures and options trading has large potential rewards, but also large potential risk. You must be aware of the risks and be willing to accept them in order to invest in the futures and options markets. Don't trade with money you can't afford to lose. This website is neither a solicitation nor an offer to Buy/Sell futures or options. No representation is being made that any account will or is likely to achieve profits or losses similar to those discussed on this website. The past performance of any trading system or methodology is not necessarily indicative of future results.
- CFTC rule 4.41:Hypothetical or simulated performance results have certain limitations. Unlike an actual performance record, simulated results do not represent actual trading. Also, since the trades have not been executed, the results may have under-or-over compensated for the impact, if any, of certain market factors, such as lack of liquidity. Simulated trading programs in general are also subject to the fact that they are designed with the benefit of hindsight. No representation is being made that any account will or is likely to achieve profit or losses similar to those shown.
- Risk Warning: Trading foreign exchange on margin carries a high level of risk, and may not be suitable for all investors. The high degree of leverage can work against you as well as for you. Before deciding to invest in foreign exchange you should carefully consider your investment objectives, level of experience, and risk appetite. The possibility exists that you could sustain a loss of some or all of your initial investment and therefore you should not invest money that you cannot afford to lose. You should be aware of all the risks associated with foreign exchange trading, and seek advice from an independent financial advisor if you have any doubts. Our linking to these sites does not constitute an endorsement of any products, services or the information found on them. Once you link to another site you are subject to the policies of the new site. By using this site, you agree to the Terms of Service, Privacy Policy and Risk Disclosure. Copyright � 2012 Tradingvesting, LLC. All rights reserved. If you have any questions regarding the Online Economic Calendar application, please contact us: click here.
THIS BRIEF STATEMENT CANNOT, OF COURSE, DISCLOSE ALL THE RISKS AND OTHER ASPECTS OF THE COMMODITY MARKETS AND EQUITY MARKETS. PLEASE READ MORE AT: TERMS OF SERVICE.
|
|
|
| |
|
|
|
|
|
| |
|
|
|
|
|