 |
 |
|
|
|
Week 44 -2012 | From Oct 29 to Nov 02, 2012 |
|
 |
|
|
|
|
|
|
| |
|
|
|
|
|
|
|
|
|
|
| |
Economic Data for Week 44-2012 | Global View | Week Rating
| DATE |
DAY |
REPORT/CATEGORY |
HIGHLIGHTS ON WEEK 44-2012 |
Last |
|
Mon |
Personal Income |
Monday�s personal income and spending report for the month of September showed troubling signs that many American�s have dipped dangerously into their savings. |
0.4% |
|
 |
Consumer |
While Personal Income rose at the expected pace of 0.4%, spending in the last month came well above expectations of 0.6%, printing at 0.8%, which meant that on a net basis, consumers, always hopeful, outspent themselves by a margin of 0.4%. |
|
|
Mon |
Consumer Spending Real PCE |
Consumer spending in the last month came well above expectations of 0.6%, printing at 0.8%, which meant that on a net basis, consumers, always hopeful, outspent themselves by a margin of 0.4%. |
0.8% |
|
|
Consumer |
Consumer spending was strong with a 0.8% increase in September, following a 0.5% rise in August.�The good news is that auto sales lifted spending but the bad news is that so did higher gasoline prices.� |
|
|
Mon |
Core PCE |
The core PCE rate rose a softer 0.1%, the same as the month before. The Core PCE Year-on-year, headline prices were up 1.7% in September versus 1.6% in August.� |
0.1% |
|
|
Inflation |
While real income was flat for the month of September, the encouraging news is that real spending is up. |
|
|
Tue |
ICSC Goldman Index |
The consumer returned to an uptrend for chain store sales with a 0.5% weekly gain for the week ending October 27, Week 43, on a same-store sales basis. |
0.5% |
|
|
Sales and Inventories |
Although last week experienced a rebound versus a dip of 0.7% the prior week, the year-ago pace for the ICSC-Goldman slipped to 2.7% from 2.9%. |
|
|
Tue |
Johnson Redbook |
Redbook reports a plus 1.8% year-on-year same-store sales pace in Week 43, up from 1.3% in the prior week but still no better than moderate and not showing much strength compared to a month ago. |
1.8%
Y/Y
|
|
|
Sales and Inventories |
The report in fact is looking for a sizable monthly decline vs September which is a negative indication for the government's ex-auto ex-gas reading. |
|
|
Tue |
S&P Case-Shiller Index |
The S&P/Case Shiller composite index of 20 metropolitan areas gained 0.5% on a seasonally adjusted basis, in line with economists' forecasts. |
0.5% |
|
|
Real Estate |
U.S. single-family home prices rose in August, the latest sign that the housing market is on the mend, a closely watched survey showed on Tuesday. US Home Prices Climb for Seventh Straight Month |
|
|
Wed |
MBA purchase Applications |
The Mortgage Bankers Association released their weekly summary of mortgage applications this morning. The basic application volume fell -4.75% from the previous week. |
-4.8%
W/W
|
|
|
Real Estate |
The mortgage purchase application index rose last week by +0.54%, but remains in a box at lower levels than seen prior to 2010. |
|
|
Wed |
Employment Cost Index |
Employment cost inflation nudged down in the third quarter, posting at a quarterly 0.4% gain, following a 0.5% rise in the second quarter. |
0.4%
Q/Q
|
|
|
Inflation |
The year-ago pace is warming at 2.0% versus 1.7% in the second quarter. Compensation costs for civilian workers increased 0.4%, seasonally adjusted, for the 3-month period endingSeptember 2012. |
|
|
Wed |
Chicago PMI |
|
13.63M |
|
|
Manufacturing |
|
|
|
Wed |
EIA Crude Oil Report |
EIA: U.S. August Crude Oil Imports -3.4% Vs Year Earlier, at 8.631 Million Barrels a Day. -U.S. crude oil imports fell 3.4%, or 305,000 barrels a day, in August from a year earlier, government data released Wednesday show. |
3.3% |
|
|
Commodity |
The drop came as domestic oil output rose 9.1%, or more than 1 million barrels a day, from a year earlier, at 8.631 million barrels a day, data from the Energy Information Administration show. |
|
|
Thu |
Motor Vehicle Sales |
Automakers reported another month of improved car sales in October, still lower than September, but Hurricane Sandy may have hit month-end results. |
14.3
Millions
|
|
|
Sales and Inventories |
The month's annual sales rate came in at 14.29 million which is a sharp 4% lower than September's and which points to weakness in the motor vehicle component of the monthly retail sales report. Weakness in the month was evenly split between cars and trucks and domestic-made and foreign-made. |
|
|
Thu |
ADP Employment Report |
According to ADP, the private sector added 158,000 jobs in October, based on the first report since ADP changed its methodology. Analysts projected 155,000 for October's report. |
158,000
Jobs
|
|
|
Employment |
US companies added 158,000 jobs in October, far higher than expected, according to ADP. Analysts had been expecting the private sector to add 88,000 jobs in October. |
|
|
Thu |
Jobless/Initial Claims |
Applications for U.S. unemployment benefits fell by 9,000 to a seasonally adjusted 363,000 in the week of Oct. 21-27, keeping them in a range that indicates little change in U.S. hiring patterns over the past few months. |
363K |
|
|
Employment |
Initial claims from two weeks ago were revised up to 372,000 from an original reading of 369,000, based on more complete data collected at the state level, according to the U.S. Labor Department. |
|
|
Thu |
Productivy and Costs |
Productivity increases modestly, unit labor costs drop. Nonfarm productivity increased at a modest pace in the third quarter, giving little sign that businesses are poised to ramp up hiring significantly. |
1.9%
Prod
|
|
|
Business Activity |
Productivity, which measures hourly output per worker, increased at a 1.9% annual rate, the Labor Department said on Thursday. |
|
|
Thu |
ISM Manufacturing Index |
Manufacturing expanded more than forecast, consumer confidence rose to a four-year high and fewer Americans filed claims for unemployment benefits, pointing to resilience in the U.S. economy heading into the fourth quarter. |
51.7 |
|
|
Manufacturing |
The Institute for Supply Management�s factory index rose to a five-month high of 51.7 in October from 51.5. Keep in mind that a reading above 50 indicates an expansion. |
|
|
Thu |
Consumer Confidence |
US consumer confidence jumped to an almost five-year high in October, according to a closely-watched survey. |
72.2 |
|
|
Consumer |
The Conference Board's Consumer Confidence Index rose to 72.2, up from 68.4 in September, largely due to improvements in the US jobs market. |
|
|
Tue |
Construction Spending |
Construction spending climbed in September to the highest level in almost three years, led by a rebound in homebuilding that is rippling through the U.S. economy.
|
0.6% |
|
|
Growth |
The 0.6% rise brought outlays up to $851.6 billion, the most since October 2009, and followed a revised 0.1% August drop that was smaller than previously estimated. |
|
|
Thu |
EIA Natural Gas Report |
U.S. natural gas inventories climbed last week to an all-time high, the fourth straight year a record high has been hit at this point in the season, according to data released Thursday by the Energy Information Administration. |
-76 bcf |
|
|
Commodity |
The EIA report showed that total domestic gas inventories climbed last week by 65 billion cubic feet to a record 3.908 trillion cubic feet, eclipsing the previous high of 3.852 tcf hit in November 2011. |
|
|
Thu |
Fed Balance Sheet |
Fed’s balance sheet shrinks to two consecutive weeks according to latest data. |
-8.4B |
|
|
Government |
The size of Fed�s balance sheet at the end of October is more or less back to the level before QE-Infinity was announced according to data published by the Federal Reserve on 1 November |
|
|
Thu |
M2 Money Supply |
|
$-1.9B |
|
|
Money Supply |
|
|
|
Fri |
Fixed Mortgage Rates |
The 30-year fixed-rate mortgage fell 4 basis points to 3.57%. A basis point is one-hundredth of 1 percentage point. |
3.57% |
|
|
Interest Rates |
The 15-year fixed-rate mortgage fell 1 basis point to 2.89%. The average rate for 30-year jumbo mortgages, or generally for those of more than $417,000, fell 6 basis points to 4.11%. |
|
|
Fri |
Employment Situation |
American job creation improved in October with 171,000 new jobs but the unemployment rate moved higher to 7.9%, setting the stage for a final push to the finish line in the heated presidential campaign. |
7.9%
Rate
|
|
|
Employment |
Most of the job creation came in the services sector, with a gain of 150,000, while government employment rolls saw a collective decrease of 13,000, according to the report from the Bureau of Labor Statistics. |
|
|
Fri |
Factory Orders |
U.S. companies boosted their orders for manufactured goods by the largest amount in 18 months in September, but companies remained cautious in ordering goods that signal plans to expand and modernize. |
4.8% M/M |
|
|
Manufacturing |
Factory orders rose 4.8% in September compared to August, a month when orders had fallen 5.1%, the Commerce Department said Friday. |
|
|
|
|
|
|
|
|
|
|
|
|
|
|
|
| |
|
|
|
|
|
|
|
|
|
|
|
|
|
|
|
| |
|
|
|
|
|
| |
|
|
|
|
|
| |
|
|
|
|
|
|
|
|
|
|
| |
|
| WEEK 44-2012 ENDING NOV. 02 |
Reports Commentary
Write commentarys for this week...
|
|
| |
|
|
|
|
|
|
|
|
|
|
|
|
|
|
|
|
|
|
|
|
|
|
|
|
|
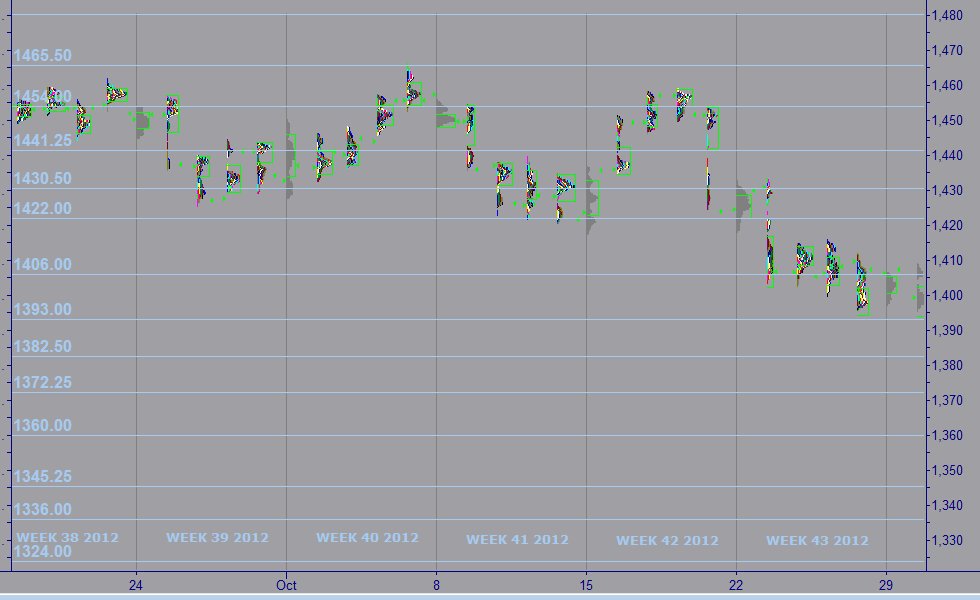
| MARKET PROFILE |
 |
WEEKS 2012 |
WEEK 44 |
% FROM CLOSE |
% FROM OPEN |
 |
RESISTANCE 1 |
1,330.25 |
1.39% |
1.35% |
|
RESISTANCE 2 |
1,326.25 |
1.08% |
1.04% |
 |
CLOSE MAR 02 |
1,350.00 |
|
|
|
OPEN MAR 04 |
1,255.00 |
0.04% |
|
 |
SUPPORT 1 |
1,289.00 |
0.66% |
0.62% |
|
SUPPORT 2 |
1,283.50 |
0.08% |
0.04% |
|
|
|
|
|
|
|
|
|
| |
|
|
|
|
|
| |
|
|
|
|
|
|
IMPORTANT NOTE: In an effort to comply with all applicable rules, regulations and disclosures please be so kind and read the "General Disclosure" below: |
| |
|
|
|
|
| GENERAL DISCLOSURE - TRADINGVESTING.COM |
- The material contained on our Website and Economic Calendar must be used at your own risk. Material is believed to be reliable, but we do not guarantee its accuracy or validity, nor is Tradingvesting.com responsible for any errors or omissions which may occur. The analysis and/or recommendations made by Tradingvesting.com do not provide, imply, or otherwise constitute a guarantee of performance. All contents and recommendations are based on data and sources believed to be reliable, but accuracy and completeness cannot be guaranteed. It should not be assumed that future results will be profitable or will equal past performance, real, indicated or implied.Tradingvesting.com website and material contained therein is not a solicitation to participate in the Futures/Stocks/Options Market. This Economic Calendar does not include Earning Releases, Announced Stock Splits, Upcoming Initial Public Offerings with Underwritings or Rating Changes. Tradingvesting.com has attempted to verify the information contained in this calendar. However, any aspect of such info may change without notice. Unless indicated otherwise: economic data is from the U.S and intraday data is at least 20 minutes delayed; all prices are in the local currency; Time is U.S. Eastern Time. Furthermore, there is a very high degree of risk involved in trading.Tradingvesting.com assumes no responsibilities for your trading and investment results, please red our Risk Disclosure.
- Tradingvesting.com does not provide investment advice, and does not represent that any of the information or related analysis is accurate or complete at any time. All information on this website are for educational purposes only and are not intended to provide financial advice. Any statements about profits or income, expressed or implied, do not represent a guarantee. Your actual trading may result in losses as no trading system is guaranteed. You accept full responsibilities for your actions, trades, profit or loss, and agree to hold Tradingvesting.com and any authorized distributors of this information harmless in any and all ways. We respect your right to privacy, please click here to view our privacy policy.
- U.S. Government Required Disclaimer - Commodity Futures Trading Commission.
Futures and options trading has large potential rewards, but also large potential risk. You must be aware of the risks and be willing to accept them in order to invest in the futures and options markets. Don't trade with money you can't afford to lose. This website is neither a solicitation nor an offer to Buy/Sell futures or options. No representation is being made that any account will or is likely to achieve profits or losses similar to those discussed on this website. The past performance of any trading system or methodology is not necessarily indicative of future results.
- CFTC rule 4.41:Hypothetical or simulated performance results have certain limitations. Unlike an actual performance record, simulated results do not represent actual trading. Also, since the trades have not been executed, the results may have under-or-over compensated for the impact, if any, of certain market factors, such as lack of liquidity. Simulated trading programs in general are also subject to the fact that they are designed with the benefit of hindsight. No representation is being made that any account will or is likely to achieve profit or losses similar to those shown.
- Risk Warning: Trading foreign exchange on margin carries a high level of risk, and may not be suitable for all investors. The high degree of leverage can work against you as well as for you. Before deciding to invest in foreign exchange you should carefully consider your investment objectives, level of experience, and risk appetite. The possibility exists that you could sustain a loss of some or all of your initial investment and therefore you should not invest money that you cannot afford to lose. You should be aware of all the risks associated with foreign exchange trading, and seek advice from an independent financial advisor if you have any doubts. Our linking to these sites does not constitute an endorsement of any products, services or the information found on them. Once you link to another site you are subject to the policies of the new site. By using this site, you agree to the Terms of Service, Privacy Policy and Risk Disclosure. Copyright � 2012 Tradingvesting, LLC. All rights reserved. If you have any questions regarding the Online Economic Calendar application, please contact us: click here.
THIS BRIEF STATEMENT CANNOT, OF COURSE, DISCLOSE ALL THE RISKS AND OTHER ASPECTS OF THE COMMODITY MARKETS AND EQUITY MARKETS. PLEASE READ MORE AT: TERMS OF SERVICE.
|
|
|
| |
|
|
|
|
| |
|
|
|
|
|
| |
|
|
|
|
|