 |
 |
|
|
|
Week 08 -2012 | From Feb 20 to Feb 24, 2012 |
|
 |
|
|
|
|
|
|
| |
|
|
|
|
|
|
|
|
|
|
| |
Economic Data for Week 08-2012 | Global View | Week Rating
| DATE |
DAY |
REPORT/CATEGORY |
HIGHLIGHTS: WEEK 08-2012 |
LAST |
|
Mon |
No Economic Data on tap for today |
|
N/A |
|
 |
No Economic Reports |
|
|
|
Tue |
Chicago Fed Nat Activity Index |
The index's three-month moving average, CFNAI-MA3, increased from +0.06 in December to +0.14 in January, reaching its highest level since March 2011 |
0.22 Level |
|
|
Growth |
January's CFNAI-MA3 suggests that growth in national economic activity was slightly above its historical trend. |
|
|
Wed |
MBA purchase Applications |
The MBA's seasonally adjusted index of refinancing applications gave up 4.8%, while the gauge of loan requests for home purchases slipped 2.9%. Composite -4.5%. |
-4.5% W/W |
|
|
Real Estate |
Applications for U.S. home mortgages (number of prospective home buyers) tumbled last week as demand for loan refinancing sagged: in what is a negative signal for underlying home sales. |
|
|
Wed |
HSBC China Flash PMI |
The February flash manufacturing PMI reading improved to a reading of 49.7 from 48.8 in January. This was the highest in four months but still under 50 which denotes contraction. |
49.70 |
|
|
Chiina |
Since the overall growth continues to slow despite the marginal improvement in the headline number thanks to a pickup in production after the Chinese New Year celebrations we have rated negative.� |
|
|
Wed |
ICSC Goldman Index |
Valentine's Day gifts contributed to the stronger performance, along with cold weather--which drove demand for some winter clearance merchandise--and spring apparel interest. |
3.0%
W/W |
|
|
Sales and Inventories |
ICSC/Goldman Sachs Chain Store Sales Up 3% and for February as a whole, the report forecasts a slightly below trend year-on-year gain of plus 3.0 to 3.5%. |
|
|
Wed |
Johnson Redbook |
National chain store sales rose 1.4% in the first three weeks of February from January. The index's rise compared with a targeted 1.5% gain. |
2.9%
Y/Y |
|
|
Sales and Inventories |
The Johnson Redbook Index also showed seasonally adjusted sales for the period were up 2.7% from last year, compared with a 2.8% targeted gain. |
|
|
Wed |
Existing Home Sales Index |
Sales of U.S. existing homes rose 4.3% in January and inventories fell to nearly seven-year lows, as lower prices, unusually warm weather and an improving economy all lifted demand. |
4.57M
Level |
|
|
Real Estate |
The National Association of Realtors said Wednesday that January sales were at a seasonally adjusted annual rate of 4.57 million |
|
|
Thu |
Jobless/Initial Claims |
Workers filed 351,000 initial claims for state unemployment benefits, the Labor Department said on Thursday. The prior week's figure was revised up to 351,000 from the previously reported 348,000. |
351,000 claims |
|
|
Employment |
New U.S. claims for unemployment benefitsafs are at the lowest level since the early days of the 2007-2009 recession and giving a fresh sign the battered labor market is healing. |
|
|
Thu |
FHFA House Price Index |
U.S. home prices fell 2.4% in the fourth quarter from a year earlier, as sales were boosted by investors seeking lower-cost distressed properties. |
0.7% M/M |
|
|
Real Estate |
Prices dropped 0.1% from the prior three months on a seasonally adjusted basis. In December, prices retreated 0.8% from a year earlier, while increasing 0.7% from the previous month. |
|
|
Thu |
Fixed Mortgage Rates |
Mortgage buyer Freddie Mac said Thursday the rate on the 30-year loan rose to 3.95%. That's up from last week's rate of 3.87%, the lowest since long-term mortgages began in the 1950s. |
3.95% APR |
|
|
Interest Rates |
The average on the 15-year fixed mortgage rose to 3.19% from 3.16%. It hit a record low of 3.14% three weeks ago. |
|
|
Thu |
EIA Natural Gas Report |
Natural gas in storage fell 166 billion cubic feet in the February 17 week. For the industry as a whole, near-term natural-gas prices are at levels below what it costs to add most new production |
-166 bcf |
|
|
Commodity |
Even though natural-gas spending in North America is estimated to decline by 40% and gas well drilling is set to fall by 50% in North America in 2012. |
|
|
Thu |
EIA Crude Oil Report |
West Texas Intermediate crude oil closed up 1.5% at $107.83 per barrel on the Nymex Thursday, while Brent, an international bench mark, rose 0.6% to $123.62. |
1.6M
Barrels |
|
|
Commodity |
A rise in imports fed a 1.6 million barrel build in oil inventories during the February 17 week. |
|
|
Thu |
U.S. Fed Balance Sheet |
For the February 22 week, the Fed's balance declined $5.1 billion after expanding $9.7 billion the week before. The U.S. Federal Reserve's balance sheet contracted slightly in the latest week. |
|
|
|
Government |
The dip was led by a $10.5 billion drop in Treasuries with central bank liquidity swaps falling $1.1 billion. |
|
|
Thu |
M2 Money Supply |
M2 Weekly Change $27.9B. |
$27.9B W/W |
|
|
Money Supply |
The U.S. Federal Reserve's balance sheet grew to a record size in the latest week and stood at $2.92 trillion on Feb. 15, up from $2.911 trillion on Feb 8 |
|
|
Fri |
Fixed Mortgage Rates |
Mortgage buyer Freddie Mac said Thursday the rate on the 30-year loan rose to 3.95%. That's up from last week's rate of 3.87%, the lowest since long-term mortgages began in the 1950s. |
3.95%
APR |
|
|
Interest Rates |
The average on the 15-year fixed mortgage rose to 3.19% from 3.16%. It hit a record low of 3.14% three weeks ago. |
|
|
Fri |
Consumer Sentiment |
Consumer sentiment rose to 75.3 in February - the highest reading in a year - from 75 in January. UMich sentiment rises to 75.3 in February |
75.3 Level |
|
|
Consumer |
The sentiment gauge, which covers how consumers view their personal finances as well as business and buying conditions, averaged about 87 in the year before the start of the most recent recession. |
|
|
Wed |
New Home Sales |
New-home sales fell 0.9% last month to a seasonally adjusted annual rate of 321,000 homes. A drop in the supply of properties added to growing signs of a recovery in the housing sector. |
321K Level |
|
|
Real Estate |
The gains came after the government upwardly revised October, November and December's figures. . December's sales pace was revised up to 324,000 units, the highest in a year, from 307,000 units. |
|
|
|
|
|
|
|
|
| |
|
|
|
|
|
|
|
|
|
|
|
|
| |
|
|
|
|
| |
|
|
|
|
 |
Glossary: |
 |
Current Week |
|
Chart View |
 |
Positive View |
 |
Negative View |
 |
Flat View |
 |
Non Available |
|
| |
|
|
|
|
| |
|
|
|
|
|
|
|
|
|
|
| |
|
| WEEK 08-2012 ENDING FEB. 24 |
Reports Commentary
The economic growth reflected in this level of the CFNAI-MA3 suggests limited inflationary pressure from economic activity over the coming year. The January National Activity Index (CFNAI) from the Chicago Federal Reserve provides another sign of improving economic momentum. The index slipped to 0.22 from 0.54 in December, which was revised up from 0.17. However, the three-month moving average rose to 0.14 which was its highest since last March. The figures had been negative since then.
During the last ten years there has been an 80% correlation between the Chicago Fed Index and the q/q change in real GDP.Lower interest rates have attracted many homeowners to refinancing deals, though still-oversupplied housing markets, tougher lending requirements and stubborn unemployment in some areas have damped demand for new purchases. With weekly claims approaching levels last seen before the recession that began in December 2007, economists say employers might be close to ending a long cycle of heavy layoffs, laying the ground for more hiring. The U.S.
Federal Reserve has left benchmark interest rates near zero since December 2008 to coax companies into hiring, and the recent improvement in the labor market has dampened expectations of further monetary stimulus. Foreclosures are boosting the supply of properties on the market and dragging down values for all houses.
Banks may seize more than 1 million U.S. homes this year after legal scrutiny of their foreclosure practices slowed actions against delinquent property owners in 2011.The average rate on the 30-year fixed mortgage jumped after standing pat for three straight weeks at record lows. But the rate stayed below 4% for the 12th straight week, keeping home-buying and refinancing attractive for those who can qualify. So far, low rates have done little to help the housing market, which is slowly improving.
Few people can qualify for the rates and many who can have already done so. But the housing market is flashing signs of health ahead of the spring-buying season. Sales of previously occupied homes are at their highest level since May 2010. More first-time buyers are making purchases. And the supply of homes fell last month to its lowest point in nearly seven years, which could push home prices higher. Despite the weak sales last month, details of the report offered further fresh signs of green shoots in the housing market, with the months' supply of homes on the market falling to 5.6 months � the lowest since January 2006. |
|
| |
|
|
|
|
|
|
|
|
|
|
|
|
|
|
|
|
|
|
|
|
|
|
|
|
|
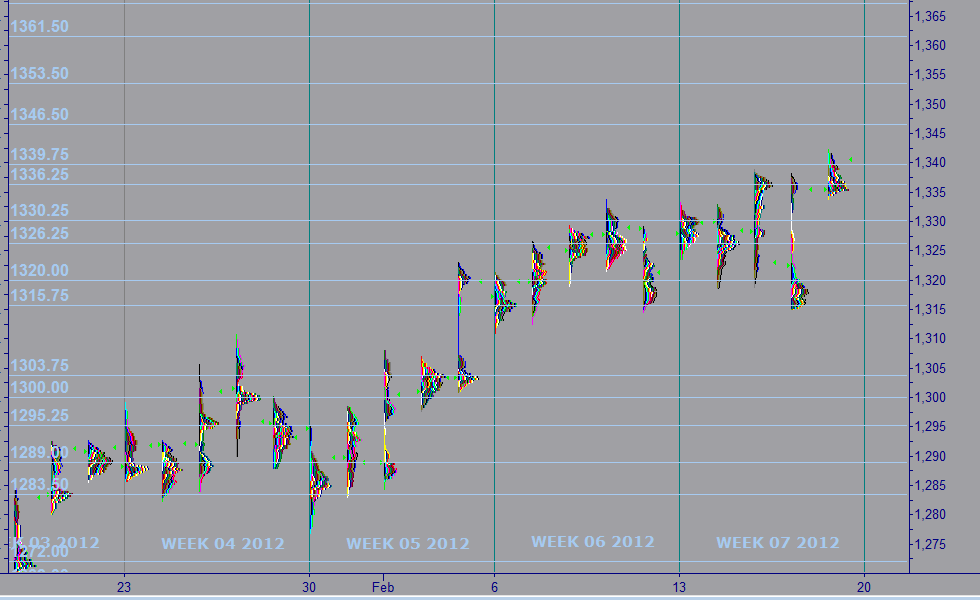
| MARKET PROFILE |
 |
WEEKS 2012 |
WEEK 08 |
% FROM CLOSE |
% FROM OPEN |
 |
RESISTANCE 1 |
1,353.50 |
1.01% |
0.52% |
|
RESISTANCE 2 |
1,346.50 |
0.49% |
-0.04% |
|
CLOSE FEB 17 |
1,340.00 |
|
|
|
OPEN FEB 19 |
1,347.00 |
0.52% |
|
 |
SUPPORT 1 |
1,336.25 |
-0.28% |
-0.86% |
|
SUPPORT 2 |
1,330.25 |
-0.73% |
-1.33% |
|
|
|
|
|
|
|
|
|
| |
|
|
|
|
|
| |
|
|
|
|
|
|
IMPORTANT NOTE: In an effort to comply with all applicable rules, regulations and disclosures please be so kind and read the "General Disclosure" below: |
| |
|
|
|
|
| GENERAL DISCLOSURE - TRADINGVESTING.COM |
- The material contained on our Website and Economic Calendar must be used at your own risk. Material is believed to be reliable, but we do not guarantee its accuracy or validity, nor is Tradingvesting.com responsible for any errors or omissions which may occur. The analysis and/or recommendations made by Tradingvesting.com do not provide, imply, or otherwise constitute a guarantee of performance. All contents and recommendations are based on data and sources believed to be reliable, but accuracy and completeness cannot be guaranteed. It should not be assumed that future results will be profitable or will equal past performance, real, indicated or implied.Tradingvesting.com website and material contained therein is not a solicitation to participate in the Futures/Stocks/Options Market. This Economic Calendar does not include Earning Releases, Announced Stock Splits, Upcoming Initial Public Offerings with Underwritings or Rating Changes. Tradingvesting.com has attempted to verify the information contained in this calendar. However, any aspect of such info may change without notice. Unless indicated otherwise: economic data is from the U.S and intraday data is at least 20 minutes delayed; all prices are in the local currency; Time is U.S. Eastern Time. Furthermore, there is a very high degree of risk involved in trading.Tradingvesting.com assumes no responsibilities for your trading and investment results, please red our Risk Disclosure.
- Tradingvesting.com does not provide investment advice, and does not represent that any of the information or related analysis is accurate or complete at any time. All information on this website are for educational purposes only and are not intended to provide financial advice. Any statements about profits or income, expressed or implied, do not represent a guarantee. Your actual trading may result in losses as no trading system is guaranteed. You accept full responsibilities for your actions, trades, profit or loss, and agree to hold Tradingvesting.com and any authorized distributors of this information harmless in any and all ways. We respect your right to privacy, please click here to view our privacy policy.
- U.S. Government Required Disclaimer - Commodity Futures Trading Commission.
Futures and options trading has large potential rewards, but also large potential risk. You must be aware of the risks and be willing to accept them in order to invest in the futures and options markets. Don't trade with money you can't afford to lose. This website is neither a solicitation nor an offer to Buy/Sell futures or options. No representation is being made that any account will or is likely to achieve profits or losses similar to those discussed on this website. The past performance of any trading system or methodology is not necessarily indicative of future results.
- CFTC rule 4.41:Hypothetical or simulated performance results have certain limitations. Unlike an actual performance record, simulated results do not represent actual trading. Also, since the trades have not been executed, the results may have under-or-over compensated for the impact, if any, of certain market factors, such as lack of liquidity. Simulated trading programs in general are also subject to the fact that they are designed with the benefit of hindsight. No representation is being made that any account will or is likely to achieve profit or losses similar to those shown.
- Risk Warning: Trading foreign exchange on margin carries a high level of risk, and may not be suitable for all investors. The high degree of leverage can work against you as well as for you. Before deciding to invest in foreign exchange you should carefully consider your investment objectives, level of experience, and risk appetite. The possibility exists that you could sustain a loss of some or all of your initial investment and therefore you should not invest money that you cannot afford to lose. You should be aware of all the risks associated with foreign exchange trading, and seek advice from an independent financial advisor if you have any doubts. Our linking to these sites does not constitute an endorsement of any products, services or the information found on them. Once you link to another site you are subject to the policies of the new site. By using this site, you agree to the Terms of Service, Privacy Policy and Risk Disclosure. Copyright � 2012 Tradingvesting, LLC. All rights reserved. If you have any questions regarding the Online Economic Calendar application, please contact us: click here.
THIS BRIEF STATEMENT CANNOT, OF COURSE, DISCLOSE ALL THE RISKS AND OTHER ASPECTS OF THE COMMODITY MARKETS AND EQUITY MARKETS. PLEASE READ MORE AT: TERMS OF SERVICE.
|
|
|
| |
|
|
|
|
|
| |
|
|
|
|
|