Tradingvesting..com
Reports View
The Top 13 Economic Reports with Indicators
As an individual Trader and Investor you need to understand the following major Economic Reports that can help you know where the “experts” are drawing their opinions from.
Brief News A to Z
Explain Explain
Links Links
   
ECONOMIC REPORTS
1


EARNINGS SEASON
MARKET CORRELATION


WORLD FACTORS
 
Reports AZ - Charts - BigCharts - SmallCharts - Slides - Recessions
 
 
Fed Funds Rate1. Fed Funds Rate (1 of 3)
FOMC Minutes2. FOMC Minutes (2 of 3)
Beige Book3. Beige Book (3 of 3)
Real GDP1. Real GDP (1 of 6)
US Trade Balance2. US Trade Balance (2 of 6)
US Trade in Goods3. US Trade in Goods (3 of 6)
Construction Spending 4. Construction Spending (4 of 6)
Corporate Profits5. Corporate Profit (5 of 6)
Current Account6. Current Account (6 of 6)
Consumer Price Index1. Consumer Price Index CPI (1 of 5)
Core PCE2. Core PCE (2 of 5)
Producer Price Index PPI3. Producer Price Index PPI (3 of 5)
Import and Exports4. Import and Exports Prices (4 of 5)
Employment Cost Index ECI5. Employment Cost Index ECI (5 of 5)
Non Farm Payroll1. Non Farm Payroll (1 of 5)
Unemployment Rate2. Unemployment Rate (2 of 5)
ADP Employment Report3. ADP Employment Rate (3 of 5)
JOLTS4. JOLTS (4 of 5)
Jobless Claims5. Jobless Claims (5 of 5)
ISM Mfg Index 1. ISM Manufacturing Index (1 of 9)
Industrial Production 2. Industrial Production (2 of 9)
Durable Good Orders 3. Durable Goods Orders (3 of 9)
Factory Orders 4. Factory Orders (4 of 9)
Empire State Mfg Index 5. Empire State Mafg Index (5 of 9)
PMI Mfg Final 6. PMI Mfg Final (6 of 9)
PMI Composite Flash 7. PMI Composite Flash (7 of 9)
Chicago PMI 8. Chicago PMI (8 of 9)
Philadelphia Mfg Index 9. Philadelphia Mfg Index (9 of 9)
Housing Starts1. Housing Starts (1 of 10)
Building Permits2. Building Permits (2 of 10)
Case Shiller3. Case Shiller Index (3 of 10)
New Home Sales4. New Home Sales (4 of 10)
Exisiting Home Sales5. Existing Home Sales (5 of 10)
PPending Home Sales6. Pending Home Sales (6 of 10)
HMI7. Housing Market Index (7 of 10)
FHFA8. FHFA House Price Index (8 of 10)
MBA Purchase Applications9. MBA Purchase Applications (9 of 10)
Mortgage Rate 30 Year10. Mortgage Rates 30-Year (10 of 10)
Prev Category Prev FOMC Meetings FOMC Minutes Beige Book Big Data Small Data Definitions Next Next Category
 
       
  Economic Reports USA Massive Volume of Data Economics   Reports Links
         
No Report / Indicator Category Type
A
1 ADP Employment Report Employment Economic Report | Monthly Releases | 12
B
2 Beige Book Interest Rates Economic Report | 8 times per Year Releases | 8
3 Bitcoin Crypto World Indicator | Daliy Quotes
4 Building Permits Real Estate Economic Report | Monthly Releases | 12
5 Business Inventories Sales and Inventories Economic Report | Monthly Releases | 12
C
6 Chicago CFNAI Business Activity Economic Report | Monthly Releases | 12
7 Chicago PMI Manufacturing Economic Report | Monthly Releases | 12
9 Construction Spending Growth Economic Report | Monthly Releases | 12
9 Consumer Confidence Consumer Economic Report | Monthly Releases | 12
10 Consumer Credit Consumer Economic Report | Monthly Releases | 12
11 Consumer Price Index (CPI) Inflation Economic Report | Monthly Releases | 12
12 Consumer Sentiment UM Consumer Economic Report | Monthly Releases | 12
13 Consumer Spending PCE Consumer Economic Report | Monthly Releases | 12
14 Copper Commodities Indicator | Daliy Quotes
15 Core PCE Inflation Economic Report | Monthly Releases | 12
16 Corporate Profits Growth Economic Report | 7 times per Year Releases | 7
17 Current Account Growth Economic Report | Quaterly Releases | 4
D
18 Durable Goods Orders Manufacturing Economic Report | Monthly Releases | 12
E
19 E-Commerce Sales Sales and Inventories Economic Report | Quaterly Releases | 4
20 EIA Crude Oil Report Commodity Economic Report | Weekly Releases | 52
21 EIA Natural Gas Report Commodity Economic Report | Weekly Releases | 52
22 Empire State Mfg Index Real Estate Economic Report | Monthly Releases | 12
23 Employment Cost Index (ECI) Inflation Economic Report | Quaterly Releases | 4
24 Existing Home Sales Real Estate Economic Report | Monthly Releases | 12
F
25 Factory Orders Manufacturing Economic Report | Monthly Releases | 12
26 Fed Balance Sheet Liquidity Economic Report | Weekly Releases | 52
27 FHFA House Price Index Real Estate Economic Report | Monthly Releases | 12
28 Fixed Mortgage Rates Real Estate Economic Report | Weekly Releases | 52
29 FOMC Meetings Interest Rates Economic Report | 8 times per Year Releases | 8
30 FOMC Minutes Interest Rates Economic Report | 8 times per Year Releases | 8
G
31 Geopolitical Risk World Factors World News | Weekly Releases | 52
32 Gold Hedge Commodity Indicator | Daliy Quotes
33 Gross Domestic Product (GDP) Growth Economic Report | Monthly Releases | 12
H
34 Housing Market Index (HMI) Real Estate Economic Report | Monthly Releases | 12
35 Housing Starts Real Estate Economic Report | Monthly Releases | 12
I
36 Imports and Exports Prices Inflation Economic Report | Monthly Releases | 12
37 Industrial Production Manufacturing Economic Report | Monthly Releases | 12
38 ISM Mfg Index Manufacturing Economic Report | Monthly Releases | 12
39 ISM Services Index Business Activity Economic Report | Monthly Releases | 12
J
40 Jobless Initial Claims Employment Economic Report | Weekly Releases | 52
41 JOLTS Employment Economic Report | Monthly Releases | 12
L
42 Leading Indicators (LEI) Business Actvity Economic Report | Monthly Releases | 12
M
43 Markets Holidays Market Events Market Event | Holidays | 12
44 MBA Mortgage Applications Real Estate Economic Report | Weekly Releases | 52
45 Money Supply Liquidity Economic Report | Monthly Releases | 12
46 Motor Vehicle Sales Sales and Inventories Economic Report | Monthly Releases | 12
N
47 New Home Sales Real Estate Economic Report | Monthly Releases | 12
48 Non Farm Payroll Employment Economic Report | Monthly Releases | 12
P
49 Pending Home Sales Index Real Estate Economic Report | Monthly Releases | 12
50 Personal Income Consumer Economic Report | Monthly Releases | 12
51 Philadelphia Fed Mfg index Manufacturing Economic Report | Monthly Releases | 12
52 PMI Mfg Final Manufacturing Economic Report | Monthly Releases | 12
53 PMI Mfg Flash Manufacturing Economic Report | Monthly Releases | 12
54 PMI Services Final Business Activity Economic Report | Monthly Releases | 12
55 Producer Price Index (PPI) Inflation Economic Report | Monthly Releases | 12
56 Productivity and Costs ULC Inflation Economic Report | Monthly Releases | 12
Q
57 Quadruple Witching Market Events Market Event | Quaterly Releases | 4
R
58 Retail Inventories (Adv) Sales and Inventories Economic Report | Monthly Releases | 12
59 Retail Sales Sales and Inventories Economic Report | Monthly Releases | 12
S
60 S&P 500 Index Index Indicator | Daliy Quotes
61 S&P Case-Shiller HPI Real Estate Economic Report | Monthly Releases | 12
T
62 Ten Year Yield Bond Market Indicator | Daliy Quotes
63 Treasury Budget Government Economic Report | Monthly Releases | 12
64 Treasury Intal Capital Government Economic Report | Monthly Releases | 12
U
65 Unemployment Rate Employment Economic Report | Monthly Releases | 12
66 US Dollar Index Currencies Indicator | Daliy Quotes
67 US Trade Balance Growth Economic Report | Monthly Releases | 12
68 US Trade - Goods Adv Growth Economic Report | Monthly Releases | 12
V
69 VIX S&P 500 Indicator | Daliy Quotes
W
70 Wholesale Inventories (Adv) Sales and Inventories Economic Report | Monthly Releases | 12
71 Wholesale Inventories (Pre) Sales and Inventories Economic Report | Monthly Releases | 12
72 World Central Banks World Factors World Factors | Interest Rates
         
Top of Page
       
  Economic Reports USA Massive Volume of Data Economics   Global View
     
 
Read More...
Fed Fund Rate  
  Bank Prime Rate  
  30-Year Fixed Rate  
  15-Year Fixed Rate  
  List of Recessions  
  MBA Mortgage Applications  
  Global View  
  Today's Week  
 
WHICH ECONOMIC REPORTS ARE WORTH IT AND WHY?
Massive volumes of Economic data

Economists, analysts, individual investors and even traders want to keep a pulse on the Economy. But no one wants to wade through the massive volume of Economic Statistics that are put out by various entities, both governmental and private.

Economic Reports and Indicators are those often-voluminous statistics put out by government agencies, non-profit organizations and even private companies.

They provide measurements for evaluating the health of our economy, the latest business cycles and how consumers are spending and generally faring. Various economic indicators are released daily, weekly, monthly and quaterly.

While it is important to keep a pulse on the economy, few analysts or economists wade throuh all these masssive volumes of data. An understing of the Top 13 Economic Reports can help you narrow your focus.

We have categorized data into 13 Economic Reports

These 13 Economic Reports are the most common and vital economic indicators and can have a huge impact on the market; therefore, knowing how to interpret and analyze them is important for all investors and traders.

These are reports that shape the entire trading session. The state of the current economic cycle also has an impact on how anticipated each of these reports are.

Who should follow these Reports: Traders and Investors

Even if you consider yourself a trader, (and not a long term investor), with little consideration of outside market influences, you should know how markets interact with and influence one another. 

Even if you don't follow these economic reports yourself, it is helpful to know where the "experts" are drawing their opinion from. If you do peruse these reports. remember that the data can change rapidly, and that broad trends are not judged by one isolated economic data point.

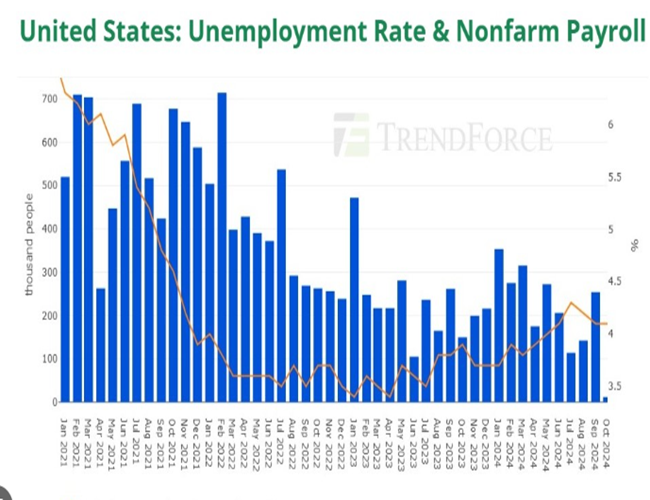
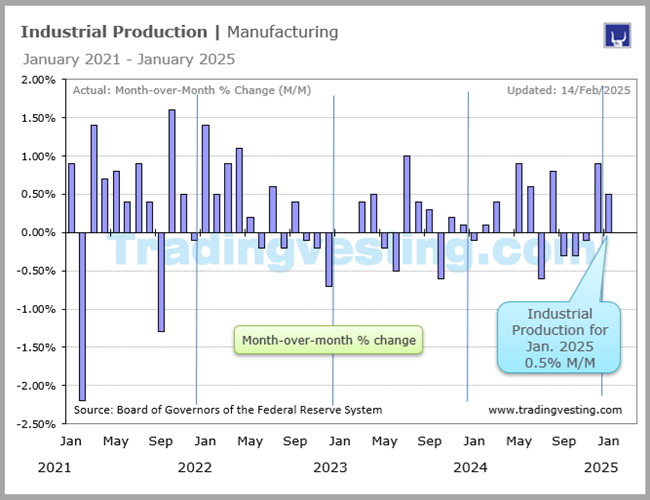
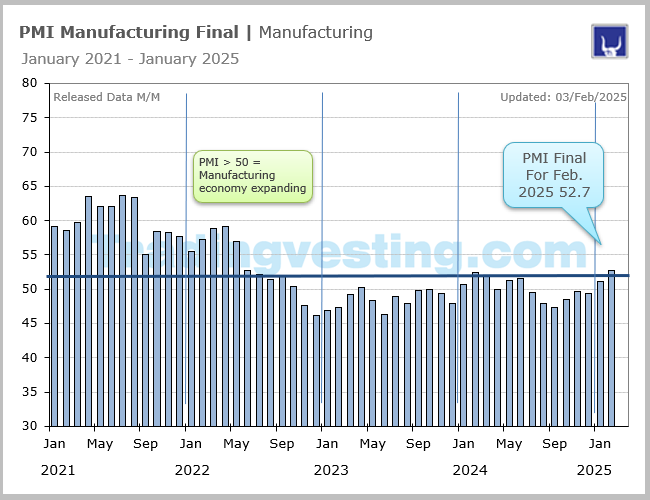
1st...Week: Manufacturing - Employment
2nd..Week: Inflation
3rd ..Week: Retail Sales - Real Estate
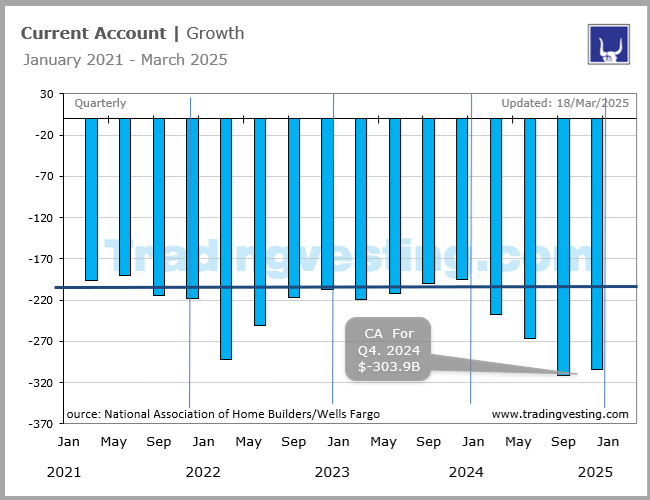
4th...Week: Consumer - GDP

Who should follow these Reports: Traders and Investors

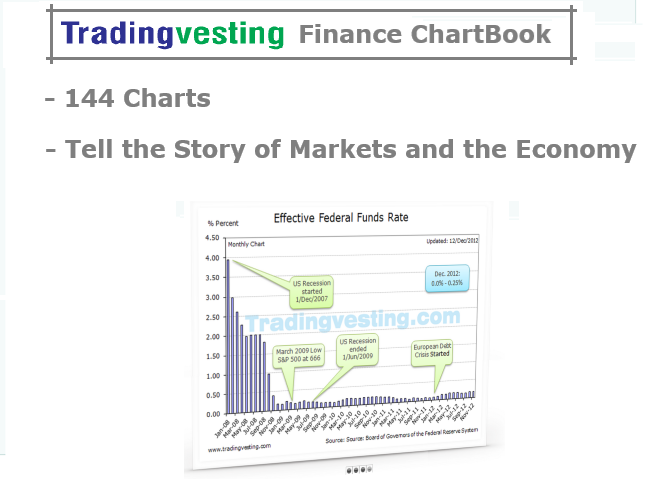
The Federal Reserve use most of this Economic data to assess the current economic and financial conditions to alter its monetary policy, which includes raising and lowering interest rates to control money supply.

For example, during peak periods of the business cycle when the economy is experiencing rapid growth in real GDP, employment will increase, and unemployment decrease, as businesses seek workers to produce a higher output.

A period of rising commodity prices arouses fears of inflation which prompts monetary authorities to raise interest rates to combat that inflation. Eventually, the rise in interest rates chokes off the economic expansion which leads to the inevitable economic slowdown and recession. During the recession demand for raw materials and money decreases, resulting in lower commodity prices and interest rates.

Activity in the bond and commodity markets can tell a lot about which way the economy is heading.

Read more about The Federal Reserve....

Why is it important?

The primary job of the Federal Reserve is to control inflation while avoiding a recession.

The most widely accepted definition of a recession is that when a country experiences two consecutive negative GDP prints, it is in recession.

It does this with monetary policy. To control inflation, the Fed must use contractionary monetary policy to slow economic growth. If the GDP growth rate is more than the ideal of 2-3%, excess demand can generate inflation by driving up prices for too few goods.

The Fed can slow this growth by tightening the money supply, which is the total amount of credit allowed into the market. The Fed's actions reduces the liquidity in the financial system, making it becomes more expensive to get loans. This slows economic growth and demand, which puts downward pressure on prices.

The Stages of the Business Cycle

There are four stages that describe the business cycle. At any point in time you are in one of these stages:
  1. Contraction - When the economy starts slowing down.
  2. Trough - When the economy hits bottom, usually in arecession.
  3. Expansion - When the economy starts growing again.
  4. Peak - When the economy is in a state of "irrational exuberance."


Top of Page
   
 
Related Links
Fed Fund Rate  
  Bank Prime Rate  
  30-Year Fixed Rate  
  15-Year Fixed Rate  
  Putting it All Together  
  Employment Overview  
  Global View  
  Today's Week  
 
WHY WE USE U.S. DATA IN OUR REPORTS?
U.S. Economic data

Amid the doom and gloom, the U.S. is still the place most investors and businesses around the world turn to for opportunity even though Brazil, Russia and other emerging economies are increasingly catching up.

Emerging economies are catching up rapidly. China, the world's second-largest economy next to the U.S., expects an average of 9% growth a year for the next decade.

The U.S., whose economy barely grew during the first half of this year, will be lucky to see much more than 2% growth this year.

World Bank said on feb, 2012 in a report that forecast the China would become the world's largest economy before 2030. However gloomy the U.S. economy might look, the nation still leads the world in many ways. For now, considering the following facts:

1. The Biggest and Most Productive Economy

The U.S. is still the world's biggest and most productive economy in the world and that is the main reason to use U.S. data in our Economic Reports. The U.S. is the world's leading country in absolute volumes of imports and exports and, therefore, still the world's leading economic power.

2. Tops in Foreign Investment

Although, the United States is the world’s leading debtor nation, the U.S. remains the world's hot spot for foreigners investors.

3. World's Top Global Brands

The U.S. may not manufacture most of the world's automobiles or computers, but it's known for many top brands that do so.

4. World's Best Universities

U.S. public schools may be flagging, but the nation is still home to many of the world's top universities. And foreign students in the U.S. make up an important piece of its economy.

5. World's Top Reserve Currency

The value of the U.S. dollar may be declining, but it remains the currency of choice for many nations. The greenback accounted for roughly 61% of global central bank reserves during the first three months of 2011, according to the International Monetary Fund.

         
Top of Page
         
Interest Rates
Interest Rates
Meetings
Minutes
Beige Book
Growth
Growth
GDP
US Balance
Spending
Inflation
Growth
CPI
Core PCE
PPI
Employment
Employment
Payroll
Rate
ADP
Manufacturing
Manufacturing
ISM Mfg
Industrial
Factory
Real Estate
Real Estate
Starts
Permits
Shiller
stock market, online trading, ETF, portfolio, dividends, crypto, day trading, shares, how to start investing, broker, day trading, IPO, bull market, bear market, how to invest, margin account, futures, stock market today, stock market futures, investing, stock signals, stock alerts, stockmarket, alerts
 
 
Calendar | 52-Weeks | Global | Trend500 | Top News | Reports | Charts | Indexes | Today
Vix | Oil | ETFs | Stocks | Futures | 10-Year | S&P 500 | Markets | Register
About | Contact | Log-in | Register | WeDo | Times | Links
Disclaimer | Privacy Policy | Risk Disclosure
 
Tradingvesting.com | Trading and Investing
 
All Rights Reserved | www.tradingvesting.com | © Copyright 2008
Discipline - Confidence - Patience