 |
 |
|
|
|
Week 28 -2012 | From July 09 to July 13, 2012 |
|
 |
|
|
|
|
|
|
| |
|
|
|
|
|
|
|
|
|
|
| |
Economic Data for Week 28-2012 | Global View | Week Rating
| DATE |
DAY |
REPORT/CATEGORY |
HIGHLIGHTS ON WEEK 28-2012 |
LAST |
|
Mon |
Consumer Credit |
Consumer credit climbed $17.1 billion, more than forecast in May, led by the biggest jump in credit-card debt in almost five years that may signal Americans are willing to use credit cards that could give a boost to what have been sluggish retail sales in recent months. |
$17.1B
M/M
|
|
 |
Consumer |
Revolving credit, which includes credit card spending, rose by $8 billion, the most since November 2007. Non-revolving debt, including educational loans and loans for motor vehicles and mobile homes, increased by $9.1 billion in May |
|
|
Tue |
ICSC Goldman Sachs Index |
According to ICSC-Goldman Sachs Index, week 28, July 10, was a good week for retailers.The ICSC index rose 2.0% week to week rate. |
|
|
|
Sales and Inventories |
The year to year rate is at 3.0% and that correspond to the highest rate in nearly 2 months. Behind this good� rate is hot weather, sparking demand for summer-related goods. |
|
|
Tue |
Johnson Redbook |
The positive view and big improvement seen in ICSC index report is not being reported by Redbook. On week 28, the Redbook index� year-on-year pace is unchanged at a very soft plus 2.2%. |
|
|
|
Sales and Inventories |
Keep in mind that July doesn't usually start off this strong but that the month usually ends very strong as back-to-school demand kicks in. |
|
|
Wed |
MBA purchase Applications |
Applications for U.S. home mortgages fell last week due to a drop in refinancing activity even as interest rates hit record lows. |
-2.1% |
|
|
Real Estate |
The MBA's seasonally adjusted index of refinancing applications fell 3.4 percent, but the gauge of loan requests for home purchases, a leading indicator of home sales, rose 3.3 percent. |
|
|
Wed |
US Trade Balance |
The U.S. trade deficit narrowed slightly in May as a rise in exports, including those bound for Europe and China, eased the pain of a slowdown in the broader economy. |
$-48.7B |
|
|
Balance of Payments |
The gap shrank 3.8% to $48.7 billion. Cheaper oil from abroad also helped shrink the trade deficit. The reading was in line with expectations, so it probably won't change analysts' views that economic growth slowed in the second quarter |
|
|
Wed |
Wholesale Trade |
Inventories at the wholesale level rose 0.3% in May, a moderate gain but one that compares negatively with a 0.8% decline in wholesale sales which is the first decline since May last year. |
0.3% |
|
|
Sales and Inventories |
The wholesale stock-to-sales ratio is up to 1.18 vs April's 1.17. The decline in sales is centered in non-durable goods including petroleum. |
|
|
Wed |
EIA Crude Oil Report |
Oil prices rallied Wednesday on bargain hunting and consider that. Prices for imported petroleum plunged 10.5 percent, also the sharpest drop since December 2008. |
N/A |
|
|
Commodity |
New York's main contract, light sweet crude for August, ended the session at $85.81 a barrel, an increase of $1.90 from Tuesday's closing level. |
|
|
Wed |
FOMC Minutes 4 for 19 June |
Minutes of their June meeting released Wednesday show that Fed officials signaled their concern that the struggling U.S. economy could worsen if Congress fails to avert tax hikes and across-the-board spending cuts that kick in at the end of the year. |
N/A |
|
|
Interest Rates |
Stocks fell in reaction to the release of the minutes. Members said the economy should continue to grow moderately. But the Fed lowered its growth forecast at the meeting after seeing the U.S. job market weaken and consumer spending slow. |
|
|
Thu |
Jobless/Initial Claims |
U.S. jobless claims fell by 26,000 last week to 350,000 the lowest in four years, but onetime factors such as fewer auto-sector layoffs than normal likely caused the sharp decline. |
350,000 |
|
|
Employment |
The level of claims is could move higher in the next few weeks as onetime seasonal factors unwind. The four-week average of claims, meanwhile, decreased by a smaller 9,750 to 376,500. |
|
|
Thu |
Import and Export Prices |
U.S. import prices fell last month by the most in more than three years mostly due to a plunge in the cost of imported oil, further icing inflation pressures. The Fed targets annual inflation is 2 %. |
-2.6%
Y/Y |
|
|
Inflation |
Overall import prices dropped 2.7 percent and Export prices fell 1.7 percent last month, the second consecutive monthly decline. That could be a sign of the recent cooling in the global economy. |
|
|
|
CHINA GDP |
China�s economy cooled to its weakest rate of growth in more than three years in the second quarter, expanding 7.6% from a year earlier, in a result that matched expectations but underscored problems faced by its export-dependent growth model. |
7.6% |
|
|
|
Growth eased from an 8.1% expansion in the first quarter, and matched expectations of economists. The growth rate was the weakest since the first quarter of 2009. For the January-to-June period, the economy grew 7.8%, compared to 9.6% in the same period a year earlier. |
|
|
Thu |
EIA Natural Gas Report |
Natural gas futures rocketed higher during week 28, coming off an almost 2-week low as forecasts showing warmer-than-normal weather across key parts of the U.S. in the coming week. |
33bcf |
|
|
Commodity |
Natural gas in storage rose 33 billion cubic feet in the July 6 week to 3,135 bcf. An injection of 30 bcf was expected. |
|
|
Thu |
Treasury Budget |
The U.S. government�s budget deficit widened in June, as spending jumped 9.3% from the same month a year ago. The month of June typically shows a surplus but in recent years has turned to deficit. Over the past 10 years, the average surplus for the month of June has been $4.2 billion. |
$-59.7B |
|
|
Government |
The deficit expanded 38.7% to $59.7 billion from a $43.1 billion shortfall in June 2011. The budget deficit is bad, but it is not as bad as the June figures suggest. |
|
|
Thu |
Fed Balance Sheet |
The Fed's asset holdings in the week ended July 12 were $2.868 trillion, total assets edged up $0.4 billion, barely changed from a week earlier |
$0.4B |
|
|
Government |
The U.S. Federal Reserve's balance sheet held steady over the last week as the central bank continued its program to extend the maturity of its debt holdings. |
|
|
Thu |
M2 Money Supply |
|
$43.2B |
|
|
Money Supply |
|
|
|
Fri |
Fixed Mortgage Rates |
The rate for a 30-year mortgage fell to 3.56%, down from 3.62% last week, Freddie Mac (FRE) said in its weekly report. The 30-year fixed rate has matched or hit a new low for 11 of the past 12 weeks. Last year, the 30-year fixed rate stood at 4.51%. |
3.56% APR |
|
|
Interest Rates |
Meanwhile, the 15-year fixed rate fell to 2.86%, down from 2.89% last week, Freddie Mac said. A year ago, the rate was 3.65%. |
|
|
Fri |
Producer Price Index |
U.S. wholesale prices rose a seasonally adjusted 0.1% in June as higher costs for food, light trucks and appliances offset another decline in energy costs. Analysts had expected U.S. PPI to fall -0.5% last month. |
0.1% |
|
|
Inflation |
U.S. producer prices unexpectedly rose in June despite big drops in energy prices, a sign that some inflation pressures could keep the Federal Reserve on guard. This is a huge miss in terms of analyst expectations |
|
|
Fri |
Consumer Sentiment |
U.S. consumer sentiment cooled again in early July to its lowest level in seven months as Americans took a dim view of their finances and job prospects, a survey released on Friday showed. |
72.0
Level |
|
|
Consumer |
The Thomson Reuters/University of Michigan's preliminary reading on the overall index on consumer sentiment fell to 72.0 from 73.2 in June, frustrating economists' expectations for a slight gain to 73.4. |
|
|
|
|
|
|
|
|
|
|
|
|
|
|
|
|
|
|
|
|
|
|
|
|
|
|
| |
|
|
|
|
|
| |
|
|
|
|
|
| |
|
|
|
|
|
|
|
|
|
|
| |
|
| WEEK 30-2012 ENDING JUL. 13 |
Reports Commentary
We find both positive and negative turns in store sales this morning, as the ICSC-Goldman reports an increase in year over year growth to 2.8%, from 2.4% Y/Y last week, and the Redbook reports a decrease in Y/Y growth down to 1.6%, from 2.3% Y/Y last wee.
us of $75 billion in September, Treasury said in its monthly budget statement, the second monthly surplus of the fiscal year and the biggest surplus since April 2008. The government’s fiscal year runs from October 1 to September 30.The full-year figure comes about a month before voters go to the polls and choose President Barack Obama or former Massachusetts Gov. Mitt Romney for the White House. Deficit reduction has been a major component of the 2012 presidential race, with Romney frequently citing Obama-era shortfalls. Both men pledge to cut the deficit but differ dramatically on how: Obama wants Bush-era tax cuts on wealthy earners to expire; Romney would attack the deficit with spending cuts. |
|
| |
|
|
|
|
|
|
|
|
|
|
|
|
|
|
|
|
|
|
|
|
|
|
|
|
|
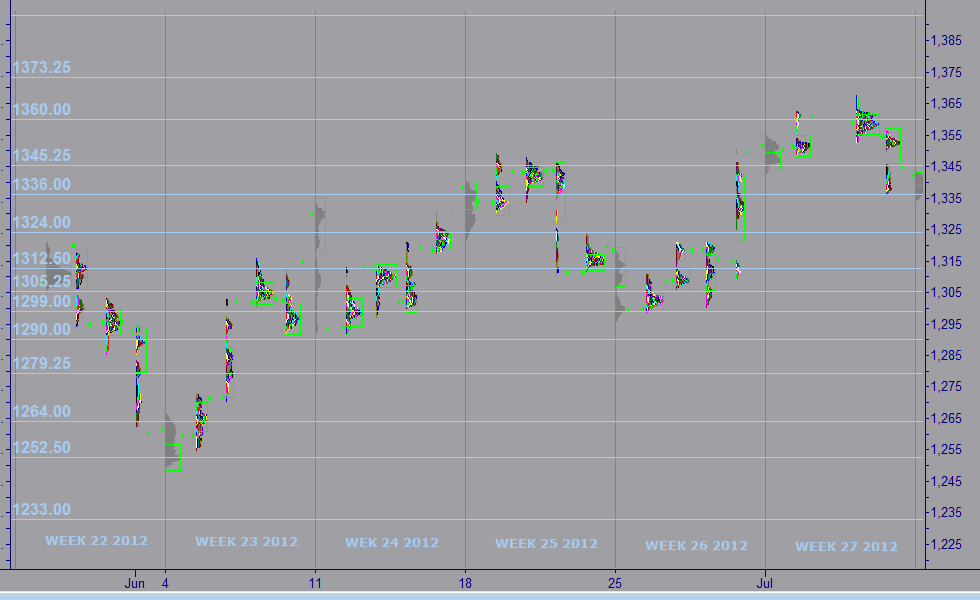
| MARKET PROFILE |
 |
WEEKS 2012 |
WEEK 28 |
% FROM CLOSE |
% FROM OPEN |
 |
RESISTANCE 1 |
1,330.25 |
1.39% |
1.35% |
|
RESISTANCE 2 |
1,326.25 |
1.08% |
1.04% |
 |
CLOSE MAR 02 |
1,350.00 |
|
|
|
OPEN MAR 04 |
1,255.00 |
0.04% |
|
 |
SUPPORT 1 |
1,289.00 |
0.66% |
0.62% |
|
SUPPORT 2 |
1,283.50 |
0.08% |
0.04% |
|
|
|
|
|
|
|
|
|
| |
|
|
|
|
|
| |
|
|
|
|
|
|
IMPORTANT NOTE: In an effort to comply with all applicable rules, regulations and disclosures please be so kind and read the "General Disclosure" below: |
| |
|
|
|
|
| GENERAL DISCLOSURE - TRADINGVESTING.COM |
- The material contained on our Website and Economic Calendar must be used at your own risk. Material is believed to be reliable, but we do not guarantee its accuracy or validity, nor is Tradingvesting.com responsible for any errors or omissions which may occur. The analysis and/or recommendations made by Tradingvesting.com do not provide, imply, or otherwise constitute a guarantee of performance. All contents and recommendations are based on data and sources believed to be reliable, but accuracy and completeness cannot be guaranteed. It should not be assumed that future results will be profitable or will equal past performance, real, indicated or implied.Tradingvesting.com website and material contained therein is not a solicitation to participate in the Futures/Stocks/Options Market. This Economic Calendar does not include Earning Releases, Announced Stock Splits, Upcoming Initial Public Offerings with Underwritings or Rating Changes. Tradingvesting.com has attempted to verify the information contained in this calendar. However, any aspect of such info may change without notice. Unless indicated otherwise: economic data is from the U.S and intraday data is at least 20 minutes delayed; all prices are in the local currency; Time is U.S. Eastern Time. Furthermore, there is a very high degree of risk involved in trading.Tradingvesting.com assumes no responsibilities for your trading and investment results, please red our Risk Disclosure.
- Tradingvesting.com does not provide investment advice, and does not represent that any of the information or related analysis is accurate or complete at any time. All information on this website are for educational purposes only and are not intended to provide financial advice. Any statements about profits or income, expressed or implied, do not represent a guarantee. Your actual trading may result in losses as no trading system is guaranteed. You accept full responsibilities for your actions, trades, profit or loss, and agree to hold Tradingvesting.com and any authorized distributors of this information harmless in any and all ways. We respect your right to privacy, please click here to view our privacy policy.
- U.S. Government Required Disclaimer - Commodity Futures Trading Commission.
Futures and options trading has large potential rewards, but also large potential risk. You must be aware of the risks and be willing to accept them in order to invest in the futures and options markets. Don't trade with money you can't afford to lose. This website is neither a solicitation nor an offer to Buy/Sell futures or options. No representation is being made that any account will or is likely to achieve profits or losses similar to those discussed on this website. The past performance of any trading system or methodology is not necessarily indicative of future results.
- CFTC rule 4.41:Hypothetical or simulated performance results have certain limitations. Unlike an actual performance record, simulated results do not represent actual trading. Also, since the trades have not been executed, the results may have under-or-over compensated for the impact, if any, of certain market factors, such as lack of liquidity. Simulated trading programs in general are also subject to the fact that they are designed with the benefit of hindsight. No representation is being made that any account will or is likely to achieve profit or losses similar to those shown.
- Risk Warning: Trading foreign exchange on margin carries a high level of risk, and may not be suitable for all investors. The high degree of leverage can work against you as well as for you. Before deciding to invest in foreign exchange you should carefully consider your investment objectives, level of experience, and risk appetite. The possibility exists that you could sustain a loss of some or all of your initial investment and therefore you should not invest money that you cannot afford to lose. You should be aware of all the risks associated with foreign exchange trading, and seek advice from an independent financial advisor if you have any doubts. Our linking to these sites does not constitute an endorsement of any products, services or the information found on them. Once you link to another site you are subject to the policies of the new site. By using this site, you agree to the Terms of Service, Privacy Policy and Risk Disclosure. Copyright � 2012 Tradingvesting, LLC. All rights reserved. If you have any questions regarding the Online Economic Calendar application, please contact us: click here.
THIS BRIEF STATEMENT CANNOT, OF COURSE, DISCLOSE ALL THE RISKS AND OTHER ASPECTS OF THE COMMODITY MARKETS AND EQUITY MARKETS. PLEASE READ MORE AT: TERMS OF SERVICE.
|
|
|
| |
|
|
|
|
|
| |
|
|
|
|
|