|
 |
|
 |
Construction Spending | Growth |
|
 |
|
An economic indicator that measures the amount of spending towards new construction activity on residential, non-residential, and public projects. The monthly changes are both volatile and subject to huge revision. .→ Read more
|
|
|
|
|
|
|
| |
|
| |
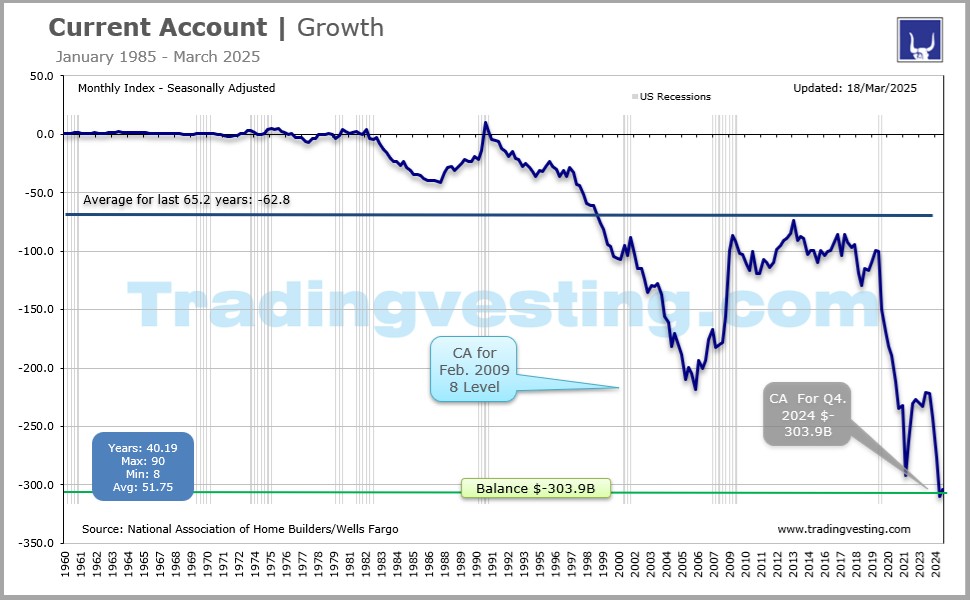
 4. Construction Spending (4 of 6) 4. Construction Spending (4 of 6) 4. Construction Spending Y/Y (4 of 6) 4. Construction Spending Y/Y (4 of 6) 5. Corporate Profit (5 of 6) 5. Corporate Profit (5 of 6)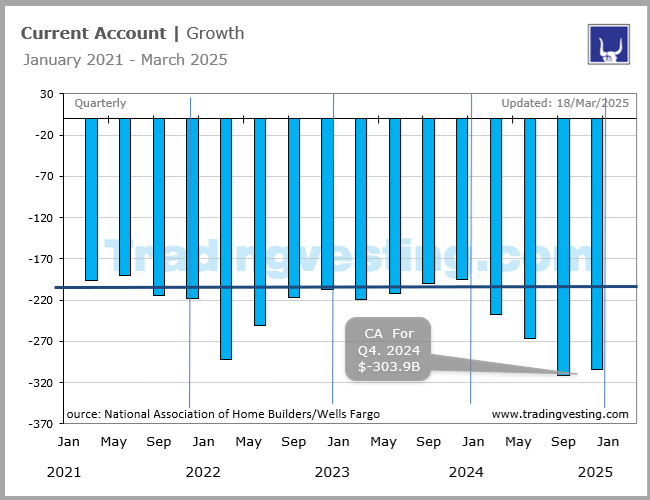 6. Current Account (6 of 6) 6. Current Account (6 of 6) 1. Real GDP (1 of 6) 1. Real GDP (1 of 6) 2. US Trade Balance (2 of 6) 2. US Trade Balance (2 of 6) 3. US Trade in Goods (3 of 6) 3. US Trade in Goods (3 of 6)
|
 |
|
|
|
|
| |
|
→ Big Chart |
|
→ Release |
|
| |
|
|
|
|
|
|
|
|
|
|
|
|
|
|
|
|
|
|
|
 |
|
Big Chart | Large Data |
 |
|
Construction Spending | Growth |
|
Today's Week |
 |
|
|
|
|
|
|
|
|
|
|
|
|
|
| |
|
|
|
|
|
|
|
|
|
|
|
|
|
| |
|
|
|
|
|
|
|
|
|
|
|
|
|
|
|
|
|
|
|
|
|
Release Schedule | 2026 |
|
|
Construction Spending | Growth |
|
Today's Week |
|
|
|
|
|
|
|
|
|
|
|
|
|
Construction Spending (At 10:00 a.m ET)
| SCHEDULE 2026 |
No 1 |
No 2 |
No 3 |
No 4 |
No 5 |
No 6 |
No 7 |
No 8 |
No 9 |
No 10 |
No 11 |
No 12 |
| Release | Week |
|
|
|
|
|
|
|
|
|
|
|
|
| Release | Date |
|
|
|
|
|
|
|
|
|
|
|
|
| Release | Day |
|
|
|
|
|
|
|
|
|
|
|
|
 |
|
|
|
|
|
|
|
|
|
|
|
|
| Prior |
0.5% |
-0.2% |
0.3% |
-0.3% |
-0.2% |
0.6% |
... |
... |
... |
... |
... |
... |
| Prior Revised |
-0.1% |
... |
0.8% |
-1.9% |
... |
0.2% |
... |
... |
... |
... |
... |
... |
| CONSENSUS |
0.0% |
0.3% |
0.3% |
0.2% |
0.4% |
0.3% |
... |
... |
... |
... |
... |
... |
| Consensus Low |
0.0% |
0.1% |
0.1% |
0.1% |
-0.1% |
0.1% |
... |
... |
... |
... |
... |
... |
| Consensus High |
0.1% |
0.3% |
0.7% |
0.3% |
0.6% |
0.4% |
... |
... |
... |
... |
... |
... |
| CONS SPENDING |
-0.2% |
0.3% |
-0.3% |
-0.2% |
0.6% |
0.4% |
... |
... |
... |
... |
... |
... |
|
|
|
|
|
|
|
|
|
|
|
|
|
| YEAR / YEAR |
No 1 |
No 2 |
No 3 |
No 4 |
No 5 |
No 6 |
No 7 |
No 8 |
No 9 |
No 10 |
No 11 |
No 12 |
| Y/Y Prior |
-1.6% |
... |
-0.4% |
... |
... |
... |
... |
... |
... |
... |
... |
... |
| Y/Y Revised |
... |
... |
... |
... |
... |
... |
... |
... |
... |
... |
... |
... |
| Y/Y Consensu |
... |
... |
... |
... |
... |
... |
... |
... |
... |
... |
... |
... |
| Y/Y Actual |
... |
-0.4% |
1.0% |
... |
... |
0.9% |
... |
... |
... |
... |
... |
... |
| RATING |
|
|
|
|
|
|
|
|
|
|
|
|
| Release For |
Nov-25 |
Dec-25 |
Jan-26 |
Feb-26 |
Mar-26 |
Apr-26 |
May-26 |
Jun-26 |
Jul-26 |
Aug-26 |
Sep-26 |
Oct-26 |
|
|
| |
|
| |
|
|
|
|
|
|
|
|
|
|
|
Release Schedule | 2025 |
|
|
Construction Spending | Growth |
|
Today's Week |
|
|
|
|
|
|
|
|
|
|
|
|
|
Construction Spending (At 10:00 a.m ET)
| SCHEDULE 2025 |
No 1 |
No 2 |
No 3 |
No 4 |
No 5 |
No 6 |
No 7 |
No 8 |
No 9 |
No 10 |
No 11 |
No 12 |
| Release | Week |
|
|
|
|
|
|
|
|
|
|
|
|
| Release | Date |
|
|
|
|
|
|
|
|
|
|
|
|
| Release | Day |
|
|
|
|
|
|
|
|
|
|
|
|
|
|
|
|
|
|
|
|
|
|
|
|
|
| Prior |
0.4% |
0.0% |
0.5% |
-0.2% |
0.7% |
-0.5% |
-0.4% |
-0.3% |
-0.4% |
... |
0.2% |
-0.6% |
| Prior Revised |
0.5% |
0.2% |
... |
-0.5% |
0.6% |
-0.8% |
-0.2% |
... |
... |
0.2% |
0.4% |
... |
| CONSENSUS |
0.3% |
0.3% |
0.0% |
0.4% |
0.2% |
0.4% |
0.1% |
0.1% |
0.1% |
-0.1% |
-0.1% |
0.1% |
| Consensus Low |
0.0% |
-0.1% |
-0.3% |
0.1% |
-0.4% |
-0.5% |
-0.3% |
-0.4% |
-0.3% |
-0.2% |
-0.1% |
0.0% |
| Consensus High |
0.4% |
1.1% |
0.3% |
0.5% |
0.4% |
0.4% |
0.3% |
0.2% |
0.6% |
0.2% |
0.2% |
0.1% |
| CONS SPENDING |
0.0% |
0.5% |
-0.2% |
0.7% |
-0.5% |
-0.4% |
-0.3% |
-0.4% |
-0.1% |
0.2% |
-0.6% |
0.5% |
|
|
|
|
|
|
|
|
|
|
|
|
|
| YEAR / YEAR |
No 1 |
No 2 |
No 3 |
No 4 |
No 5 |
No 6 |
No 7 |
No 8 |
No 9 |
No 10 |
No 11 |
No 12 |
| Y/Y Prior |
5.0% |
3.0% |
4.3% |
3.3% |
2.9% |
2.8% |
-0.5% |
-3.5% |
-3.5% |
... |
... |
... |
| Y/Y Revised |
3.9% |
... |
... |
... |
3.4% |
1.2% |
-2.8% |
... |
... |
... |
... |
... |
| Y/Y Consensu |
... |
... |
... |
... |
... |
... |
... |
... |
... |
... |
... |
... |
| Y/Y Actual |
3.0% |
4.3% |
3.3% |
2.9% |
2.8% |
-0.5% |
-3.5% |
-2.9% |
-2.8% |
-1.6% |
... |
-1.0% |
| RATING |
|
|
|
|
|
|
|
|
|
|
|
|
| Release For |
Nov-24 |
Dec-24 |
Jan-25 |
Feb-25 |
Mar-25 |
Apr-25 |
May-25 |
Jun-25 |
Jul-25 |
Aug-25 |
Sep-25 |
Oct-25 |
|
|
| |
|
| |
|
|
|
|
|
|
|
|
|
|
|
Release Schedule | 2024 |
|
|
Construction Spending | Growth |
|
Today's Week |
|
|
|
|
|
|
|
|
|
|
|
|
|
Construction Spending (At 10:00 a.m ET)
| SCHEDULE 2024 |
No 1 |
No 2 |
No 3 |
No 4 |
No 5 |
No 6 |
No 7 |
No 8 |
No 9 |
No 10 |
No 11 |
No 12 |
| Release | Week |
|
|
|
|
|
|
|
|
|
|
|
|
| Release | Date |
|
|
|
|
|
|
|
|
|
|
|
|
| Release | Day |
|
|
|
|
|
|
|
|
|
|
|
|
|
|
|
|
|
|
|
|
|
|
|
|
|
| Prior |
0.6% |
0.4% |
0.9% |
-0.2% |
-0.3% |
-0.2% |
-0.1% |
-0.1% |
-0.3% |
-0.3% |
-0.1% |
0.1% |
| Prior Revised |
1.2% |
0.9% |
1.1% |
... |
0.0% |
... |
0.3% |
-0.4% |
0.0% |
-0.5% |
0.1% |
... |
| CONSENSUS |
0.6% |
0.5% |
0.2% |
0.5% |
0.3% |
0.2% |
0.3% |
0.2% |
0.1% |
-0.3% |
0.1% |
0.2% |
| Consensus Low |
-0.1% |
0.2% |
0.0% |
0.3% |
-0.2% |
-0.1% |
-0.1% |
0.0% |
-0.2% |
-0.1% |
-0.2% |
-0.3% |
| Consensus High |
0.9% |
0.7% |
0.7% |
1.0% |
0.7% |
0.5% |
0.4% |
0.3% |
0.2% |
0.3% |
0.5% |
0.5% |
| CONS SPENDING |
0.4% |
0.9% |
-0.2% |
-0.3% |
-0.2% |
-0.1% |
-0.1% |
-0.3% |
-0.3% |
-0.1% |
0.1% |
0.4% |
|
|
|
|
|
|
|
|
|
|
|
|
|
| Y/Y Prior |
... |
11.3% |
13.9% |
11.7% |
10.7% |
9.6% |
10.0% |
6.4% |
6.2% |
6.7% |
4.1% |
4.6% |
| Y/Y Revised |
11.6% |
12.8% |
14.4% |
11.4% |
10.5% |
10.5% |
7.6% |
9.8% |
7.2% |
5.3% |
4.8% |
5.3% |
| Y/Y Consensu |
... |
... |
... |
... |
... |
... |
... |
... |
... |
... |
... |
... |
| Y/Y Actual |
11.3% |
13.9% |
11.7% |
10.7% |
9.6% |
10.0% |
6.4% |
6.2% |
6.7% |
4.1% |
4.6% |
5.0% |
| RATING |
|
|
|
|
|
|
|
|
|
|
|
|
| Release For |
Nov-23 |
Dec-23 |
Jan-24 |
Feb-24 |
Mar-24 |
Apr-24 |
May-24 |
Jun-24 |
Jul-24 |
Aug-24 |
Sep-24 |
Oct-24 |
|
|
| |
|
| |
|
|
|
|
|
|
|
|
|
|
|
Release Schedule | 2023 |
|
|
Construction Spending | Growth |
|
Today's Week |
|
|
|
|
|
|
|
|
|
|
|
|
|
Construction Spending (At 10:00 a.m ET)
| SCHEDULE 2023 |
No 1 |
No 2 |
No 3 |
No 4 |
No 5 |
No 6 |
No 7 |
No 8 |
No 9 |
No 10 |
No 11 |
No 12 |
| Release | Week |
|
|
|
|
|
|
|
|
|
|
|
|
| Release | Date |
|
|
|
|
|
|
|
|
|
|
|
|
| Release | Day |
|
|
|
|
|
|
|
|
|
|
|
|
|
|
|
|
|
|
|
|
|
|
|
|
|
| Prior |
-0.3% |
0.2% |
-0.4% |
-0.1% |
-0.1% |
0.3% |
1.2% |
0.9% |
0.5% |
0.7% |
0.5% |
0.4% |
| Prior Revised |
-0.2% |
0.5% |
-0.7% |
0.4% |
-0.3% |
... |
0.4% |
1.1% |
0.6% |
0.9% |
1.0% |
0.2% |
| CONSENSUS |
-0.4% |
-0.1% |
0.2% |
0.0% |
0.1% |
0.2% |
0.5% |
0.6% |
0.5% |
0.5% |
0.4% |
0.3% |
| Consensus Low |
-0.5% |
-0.6% |
-0.5% |
-0.2% |
-0.1% |
0.1% |
0.2% |
-0.5% |
-0.4% |
-1.1% |
0.3% |
-0.1% |
| Consensus High |
-0.3% |
0.4% |
1.0% |
0.3% |
0.2% |
0.3% |
0.8% |
1.0% |
0.8% |
0.8% |
0.7% |
0.5% |
| CONS SPENDING |
0.2% |
-0.4% |
-0.1% |
-0.1% |
0.3% |
1.2% |
0.9% |
0.5% |
0.7% |
0.5% |
0.4% |
0.6% |
|
|
|
|
|
|
|
|
|
|
|
|
|
| Y/Y Prior |
9.2% |
8.5% |
7.7% |
5.7% |
5.2% |
3.8% |
7.2% |
2.4% |
3.5% |
5.5% |
7.4% |
... |
| Y/Y Revised |
9.7% |
9.1% |
8.7% |
6.9% |
4.4% |
6.6% |
1.4% |
2.6% |
4.6% |
5.6% |
7.6% |
... |
| Y/Y Consensus |
... |
... |
... |
... |
... |
... |
... |
... |
... |
... |
... |
... |
| Y/Y Actual |
8.5% |
7.7% |
5.7% |
5.2% |
3.8% |
7.2% |
2.4% |
3.5% |
5.5% |
7.4% |
8.7% |
... |
| RATING |
|
|
|
|
|
|
|
|
|
|
|
|
| Release For |
Nov-22 |
Dec-22 |
Jan-23 |
Feb-23 |
Mar-23 |
Apr-23 |
May-23 |
Jun-23 |
Jul-23 |
Aug-23 |
Sep-23 |
Oct-23 |
|
|
|
|
|
|
|
|
|
|
|
|
|
|
|
| |
|
| |
|
|
|
|
|
|
|
|
|
|
|
Release Schedule | 2022 |
|
|
Construction Spending | Growth |
|
Today's Week |
|
|
|
|
|
|
|
|
|
|
|
|
|
Construction Spending (At 10:00 a.m ET)
| SCHEDULE 2022 |
No 1 |
No 2 |
No 3 |
No 4 |
No 5 |
No 6 |
No 7 |
No 8 |
No 9 |
No 10 |
No 11 |
No 12 |
| Release | Week |
|
|
|
|
|
|
|
|
|
|
|
|
| Release | Date |
|
|
|
|
|
|
|
|
|
|
|
|
| Release | Day |
|
|
|
|
|
|
|
|
|
|
|
|
|
|
|
|
|
|
|
|
|
|
|
|
|
| Prior |
0.2% |
0.4% |
0.2% |
1.3% |
0.5% |
0.1% |
0.2% |
-0.1% |
-1.1% |
-0.4% |
-0.7% |
0.2% |
| Prior Revised |
0.4% |
0.6% |
0.8% |
1.6% |
... |
0.3% |
0.8% |
0.1% |
-0.5% |
-0.6% |
-0.6% |
0.1% |
| CONSENSUS |
0.6% |
0.7% |
-0.2% |
0.9% |
0.8% |
0.4% |
0.5% |
0.2% |
0.0% |
-0.1% |
-0.5% |
-0.1% |
| Consensus Low |
0.5% |
0.3% |
-0.6% |
0.5% |
0.4% |
-0.1% |
-0.2% |
-0.4% |
-0.7% |
-0.5% |
-0.6% |
-0.8% |
| Consensus High |
1.0% |
0.7% |
0.4% |
1.2% |
0.9% |
0.7% |
0.7% |
0.5% |
0.5% |
0.4% |
0.2% |
1.1% |
| CONS SPENDING |
0.4% |
0.2% |
1.3% |
0.5% |
0.1% |
0.2% |
-0.1% |
-1.1% |
-0.4% |
-0.7% |
0.2% |
-0.3% |
|
|
|
|
|
|
|
|
|
|
|
|
|
| Prior Rev |
... |
10.0% |
... |
... |
12.7% |
12.4% |
... |
... |
9.6% |
9.5% |
10.1% |
10.2% |
| Y OVER Y |
9.3% |
9.0% |
8.2% |
11.2% |
11.7% |
12.3% |
9.7% |
8.3% |
8.5% |
8.5% |
10.9% |
9.2% |
| RATING |
|
|
|
|
|
|
|
|
|
|
|
|
| Release For |
Nov-21 |
Dec-21 |
Jan-22 |
Feb-22 |
Mar-22 |
Apr-22 |
May-22 |
Jun-22 |
Jul-22 |
Aug-22 |
Sep-22 |
Oct-22 |
|
|
| |
|
| |
|
|
|
|
|
|
|
|
|
|
|
Release Schedule | 2021 |
|
|
Construction Spending | Growth |
|
Today's Week |
|
|
|
|
|
|
|
|
|
|
|
|
|
Construction Spending (At 10:00 a.m ET)
| SCHEDULE 2021 |
No 1 |
No 2 |
No 3 |
No 4 |
No 5 |
No 6 |
No 7 |
No 8 |
No 9 |
No 10 |
No 11 |
No 12 |
| Release | Week |
|
|
|
|
|
|
|
|
|
|
|
|
| Release | Date |
|
|
|
|
|
|
|
|
|
|
|
|
| Release | Day |
|
|
|
|
|
|
|
|
|
|
|
|
|
|
|
|
|
|
|
|
|
|
|
|
|
| Prior |
1.3% |
0.9% |
1.0% |
1.7% |
-0.8% |
0.2% |
0.2% |
-0.3% |
0.1% |
0.3% |
0.0% |
-0.5% |
| Prior Revised |
1.6% |
1.1% |
1.1% |
1.2% |
-0.6% |
1.0% |
0.1% |
0.3% |
0.2% |
... |
0.1% |
-0.1% |
| CONSENSUS |
1.0% |
0.8% |
0.8% |
-0.8% |
2.0% |
0.6% |
0.5% |
0.3% |
0.2% |
0.4% |
0.5% |
0.6% |
| Consensus Low |
0.5% |
0.6% |
0.3% |
-3.0% |
1.0% |
0.2% |
0.1% |
-1.0% |
0.1% |
0.2% |
0.2% |
0.0% |
| Consensus High |
1.5% |
1.7% |
1.0% |
0.3% |
4.9% |
1.5% |
1.1% |
0.6% |
0.8% |
0.9% |
1.0% |
1.1% |
| CONS SPENDING |
0.9% |
1.0% |
1.7% |
-0.8% |
0.2% |
0.2% |
-0.3% |
0.1% |
0.3% |
0.0% |
-0.5% |
0.2% |
| Y OVER Y |
5.0% |
5.7% |
5.8% |
5.8% |
5.3% |
9.8% |
7.5% |
8.2% |
9.0% |
8.9% |
7.8% |
8.6% |
| RATING |
|
|
|
|
|
|
|
|
|
|
|
|
| Release For |
Nov-20 |
Dec-20 |
Jan-21 |
Feb-21 |
Mar-21 |
Apr-21 |
May-21 |
Jun-21 |
Jul-21 |
Aug-21 |
Sep-21 |
Oct-21 |
|
|
| |
|
| |
|
Legends: |
 |
Delayed |
 |
Positive View |
 |
Negative View |
 |
Neutral View |
 |
Non Available |
|
|
|
|
|
|
|
|
|
|
|
|
|
|
|
|
|
|
|
|
| |
|
|
|
|
|
|
|
|
|
|
|
|
|
|
|
|
|
|
|
|
|
Brief News | 2026 |
|
|
Construction Spending | Growth |
|
Today's Week |
|
|
|
|
|
|
|
|
|
|
|
|
|
Construction Spending (At 10:00 a.m ET)
| DATE/WEEK |
HIGHLIGHTS |
FOR |
ISM |
|
Const Spending |
No 12 |
... |
|
Nov-2026 |
|
| |
|
|
|
Const Spending |
No 11 |
... |
|
Oct-2026 |
|
| |
|
|
|
Const Spending |
No 10 |
... |
|
Sep-2026 |
|
| |
|
|
|
Const Spending |
No 9 |
... |
|
Aug-2026 |
|
| |
|
|
|
Const Spending |
No 8 |
... |
|
Jul-2026 |
|
| |
|
|
|
Const Spending |
No 7 |
... |
|
Jun-2026 |
|
| |
|
|
|
Const Spending |
No 6 |
... |
|
May-2026 |
|
| |
|
|
|
Const Spending |
No 5 |
... |
|
Apr-2026 |
|
| |
|
|
|
Const Spending |
No 4 |
... |
|
Mar-2026 |
|
| |
|
|
|
Const Spending |
No 3 |
... |
|
Feb-2026 |
|
| |
|
|
|
US construction spending declined 0.3% month-over-month in January 2026, reaching a seasonally adjusted annual rate of $2.19 trillion, following a revised 0.8% increase in December 2025 and missing market expectations of a 0.1% rise. Private construction fell 0.6% to $1.66 trillion, with residential construction down 0.8% and nonresidential construction slipping 0.4%. In contrast, public construction spending rose 0.6% to $529.2 billion, led by a 3.3% surge in highway construction, while public educational construction dipped 0.2%. |
No 2 |
-0.3% |
|
Jan-2026 |
|
| |
|
|
|
Construction spending in the US rose by 0.3% month-over-month in December 2025, following a 0.2% decrease in November, in line with market forecasts, delayed data due to govdernment shutdown. |
No 3 |
0.3% |
|
Dec-2025 |
|
| |
|
|
|
US construction spending dipped 0.2% in November 2025, reversing October's 0.5% increase and signaling weaker monthly momentum. |
No 2 |
-0.2% |
|
Nov-2025 |
|
| |
|
|
|
Construction Spending Sep 2025 -0.6% and Oct 2025 0.5%. The data was delayed by the 43-day government shutdown. Spending on private construction projects increased 0.6% in October after declining 0.9% in September. U.S. construction spending increased more than expected in October, likely reflecting home renovations, with activity elsewhere weak. The Commerce Department's Census Bureau said on Wednesday that construction spending rose 0.5% after falling 0.6% in September. Economists polled by Reuters had forecast construction spending gaining 0.1% in October. Spending dropped 1.0% year-on-year in October. |
No 1 |
0.5% |
|
Oct-2025 |
|
| |
|
|
|
Construction Spending Sep 2025 -0.6% and Oct 2025 0.5%. The data was delayed by the 43-day government shutdown. Spending on private construction projects increased 0.6% in October after declining 0.9% in September. U.S. construction spending increased more than expected in October, likely reflecting home renovations, with activity elsewhere weak. The Commerce Department's Census Bureau said on Wednesday that construction spending rose 0.5% after falling 0.6% in September. Economists polled by Reuters had forecast construction spending gaining 0.1% in October. Spending dropped 1.0% year-on-year in October. |
No 1 |
0.6% |
|
Sep-2025 |
|
| |
|
|
|
Construction Spending Nov 2025 Delayed due to the government shut down, |
No 1 |
... |
|
Nov-2025 |
|
| |
|
|
|
|
|
|
|
|
| |
|
|
|
|
|
| |
|
|
|
|
|
|
|
|
|
|
|
|
|
|
|
Brief News | 2025 |
|
|
Construction Spending | Growth |
|
Today's Week |
|
|
|
|
|
|
|
|
|
|
|
|
|
Construction Spending (At 10:00 a.m ET)
| DATE/WEEK |
HIGHLIGHTS |
FOR |
ACTUAL |
|
Construction Spending: Delayed due to the government shut down, |
No 12 |
|
|
Oct-2025 |
|
| |
|
|
|
U.S. construction spending unexpectedly rebounded in August, likely lifted by home renovations as higher mortgage rates continued to weigh on single-family homebuilding. The Commerce Department's Census Bureau said on Monday that construction spending increased 0.2% after an upwardly revised 0.2% gain in July. Economists polled by Reuters had forecast construction spending would ease 0.1% after a previously reported 0.1% dip in July. |
No 11 |
0.2% |
|
Aug-2025 |
|
| |
|
|
|
Construction Spending: Delayed due to the government shut down, |
No 11 |
... |
|
Sep-2025 |
|
| |
|
|
|
Construction Spending: Delayed due to the government shut down, |
No 10 |
... |
|
Aug-2025 |
|
| |
|
|
|
U.S. construction spending fell in July 2025 as high mortgage rates continued to constrain the housing market. The Commerce Department's Census Bureau said on Tuesday that construction spending slipped 0.1% after an unrevised 0.4% drop in June. The decline was in line with economists' expectations. Spending dropped 2.8% on a year-over-year basis in July. High mortgage rates have undercut the housing market. Though mortgage rates have eased from this year's lofty levels on expectations that the Federal Reserve would resume cutting interest rates in September, they remain elevated. A slowing labor market is also becoming a constraint for home sales. |
No 9 |
-0.1% |
|
Jul-2025 |
|
| |
|
|
|
U.S. construction spending dropped further in June amid a sharp decline in outlays on single-family housing projects because of higher mortgage rates and rising inventory. The Commerce Department's Census Bureau said on Friday that construction spending fell 0.4% after a revised 0.4% decrease in May. Economists polled by Reuters had forecast construction spending unchanged after a previously reported 0.3% drop in May. Spending fell 2.9% on a year-over-year basis in June. |
No 8 |
-0.4% |
|
Jun-2025 |
|
| |
|
|
|
US construction spending falls again in May 2025. U.S. construction spending fell in May as higher mortgage rates and rising inventory weighed on single-family housing projects. The Commerce Department's Census Bureau said on Tuesday that construction spending dropped 0.3% after an upwardly revised 0.2% decline in April.Economists polled by Reuters had forecast construction spending would fall 0.2% after a previously reported 0.4% decrease in April. Spending fell 3.5% on a year-over-year basis in May. |
No 7 |
-0.3% |
|
May-2025 |
|
| |
|
|
|
In April 2025, U.S. construction spending was estimated at a seasonally adjusted annual rate of $2,152.4 billion, a 0.4% decrease from the revised March estimate, according to the Census Bureau. This represents a 0.5% decrease compared to April 2024. The decline was primarily driven by a decrease in private sector spending, particularly in residential construction, while public construction spending saw a modest increase. |
No 6 |
-0.4% |
|
Apr-2025 |
|
| |
|
|
|
In March 2025, US construction spending experienced a 0.5% decrease, reaching a seasonally adjusted annual rate of $2,196.1 billion, according to the ABA Banking Journal. This decline follows a revised 0.6% increase in February. Despite the monthly decrease, spending remained 2.8% above the March 2024 level. The decline in March comes amidst a broader trend of slowing construction spending growth, with some experts predicting a potential downturn in activity as current projects are completed. |
No 5 |
-0.5% |
|
Mar-2025 |
|
| |
|
|
|
In February 2025, U.S. construction spending reached a seasonally adjusted annual rate of $2,195.8 billion, a 0.7% increase from January. This figure is also 2.9% higher than the February 2024 estimate. Both private and public construction spending saw increases, with residential construction experiencing the largest gains. Monthly increase: 0.7% compared to January. Year-over-year increase: 2.9% compared to February 2024. |
No 4 |
0.7% |
|
Feb-2025 |
|
| |
|
|
|
Total construction spending fell 0.2% in January 2025, according to a report released by the U.S. Census Bureau, with year-over-year spending up 3.3%. Monthly residential spending fell 0.5%, while non-residential rose 0.1% in the same time period. The decline in spending in January is likely to worsen, as uncertainty about tariffs, interest rates and inflation is causing investors and developers to delay or scale back projects. |
No 3 |
-0.2% |
|
Jan-2025 |
|
| |
|
|
|
U.S. construction spending increased more than expected in December 2024, boosted by single-family homebuilding, but high mortgage rates could curb further gains in new residential construction.
The Commerce Department's Census Bureau said on Monday that construction rose 0.5% after an upwardly revised 0.2% increase in November. Economists polled by Reuters had forecast construction spending would advance 0.2% after being previously reported as unchanged in November. Construction spending increased 4.3% on a year-on-year basis in December. It advanced 6.5% in 2024. Spending |
No 2 |
0.5% |
|
Dec-2024 |
|
| |
|
|
|
US reports construction spending unchanged in November 2024. U.S. construction spending was unchanged in November as a moderate rise in single-family homebuilding was offset by a sharp decline in outlays on multi-family housing projects. The Commerce Department's Census Bureau said on Thursday the unchanged reading in construction spending forn Nov 20204 followed an upwardly revised 0.5% rise in October. Economists polled by Reuters had forecast construction spending would gain 0.3% in November after a previously reported 0.4% rise in October. Construction spending increased 3.0% on a year-on-year basis in November. Spending on private construction projects edged up 0.1% after increasing 0.6% in October. Investment in residential construction nudged up 0.1%, with outlays on new single-family projects rising 0.3%. |
No 1 |
0.0% |
|
Nov-2024 |
|
| |
|
|
|
|
|
|
|
|
| |
|
|
|
|
|
| |
|
|
|
|
|
|
|
|
|
|
|
|
|
|
|
Brief News | 2024 |
|
|
Construction Spending | Growth |
|
Today's Week |
|
|
|
|
|
|
|
|
|
|
|
|
|
Construction Spending (At 10:00 a.m ET)
| DATE/WEEK |
HIGHLIGHTS |
FOR |
ACTUAL |
|
Data-center and manufacturing booms credited as U.S. construction spending hits record high in October. Spending up 0.4%, doubling the forecast increase of 0.2%. U.S. Construction Spending Climbs More Than Expected In October 2024. Construction spending in the U.S. increased more than expected in the month of October, according to a report released by the Commerce Department on Monday. The Commerce Department said construction spending climbed by 0.4 percent to an annual rate of $2.174 trillion in October after inching up by 0.1 percent to a rate of $2.165 trillion in September. Economists had expected construction spending to rise by 0.2 percent. The bigger than expected increase by total construction spending came as spending on private construction grew by 0.7 percent to an annual rate of $1.676 trillion. |
No 12 |
0.4% |
|
Oct-2024 |
|
| |
|
|
|
U.S. Construction Spending Edged Higher in September A second straight monthly increase put the total at a healthy increase both year-over-year and year-to-date. Total U.S. construction spending had a modest increase for a second straight month in September, according to figures shared Nov. 1 by the U.S. Census Bureau. Spending in September was estimated at a seasonally adjusted annual rate of $2.148 trillion, 0.1% above the revised August estimate. Economists at the Wall Street Journal had forecast no growth spending in September. |
No 11 |
0.1% |
|
Sep-2024 |
|
| |
|
|
|
US construction spending falls in August 2024 on single-family homebuilding. U.S. construction spending unexpectedly fell in August amid a sharp drop in outlays on single-family housing projects, but declining borrowing costs could stimulate activity in the months ahead. The Commerce Department's Census Bureau said on Tuesday construction spending dipped 0.1% after a downwardly revised 0.5% drop in July. Economists polled by Reuters had forecast construction spending would edge up 0.1% after a previously reported 0.3% decrease. Construction spending increased 4.1% on a year-on-year basis in August. |
No 10 |
-0.1% |
|
Aug-2024 |
|
| |
|
|
|
US construction spending falls more than expected in July 2024. U.S. construction spending fell more than expected in July as higher mortgages and increased supply weighed on single-family homebuilding. The Commerce Department's Census Bureau said on Tuesday that construction spending dropped 0.3% after being unchanged in June. Economists polled by Reuters had forecast construction spending dipping 0.1%. Construction spending increased 6.7% year-on-year in July. Spending on private construction projects decreased 0.4% in July. Investment in residential construction also fell 0.4%. |
No 9 |
-0.3% |
|
Jul-2024 |
|
| |
|
|
|
US construction spending extends decline in June 2024. U.S. construction spending unexpectedly fell in June and the prior month's data was revised lower as higher mortgage rates weighed on single-family homebuilding. The Commerce Department's Census Bureau said on Thursday that construction spending dropped 0.3% after a downwardly revised 0.4% decline in May. Economists polled by Reuters had forecast construction spending rising 0.2% after a previously reported 0.1% dip in May. Construction spending advanced 6.2% year-on-year in June. |
No 8 |
-0.3% |
|
Jun-2024 |
|
| |
|
|
|
US construction spending unexpectedly falls in May 2024. U.S. construction spending unexpectedly fell in May as higher mortgage rates depressed single-family homebuilding, and recovery is likely to be muted by improving housing supply. The Commerce Department's Census Bureau said on Monday that construction spending dipped 0.1% after an upwardly revised 0.3% increase in April. Economists polled by Reuters had forecast construction spending rebounding 0.2% after a previously reported 0.1% fall in April. Construction spending increased 6.4% year-on-year in May. |
No 7 |
-0.1% |
|
May-2024 |
|
| |
|
|
|
Construction spending, not adjusted for inflation, totalled US$2.099 trillion at a seasonally adjusted annual rate in April. That figure is 0.1 per cent below the upwardly revised March rate, but 10.0 per cent above the April 2023 level.Total U.S. construction spending inched down from March to April with declines in public projects and a mixed pattern among private residential and nonresidential categories, according to an analysis of a new government report released by the Associated General Contractors of America. Association officials noted in a release, however, that construction spending levels remain well above where they were a year ago. |
no 6 |
-0.1% |
|
Apr-2024 |
|
| |
|
|
|
U.S. construction spending unexpectedly fell in March 2024 likely as a resurgence in mortgage rates weighed on homebuilding, but activity remains supported by an acute housing shortage. The Commerce Department's Census Bureau said on Wednesday that construction spending slipped 0.2% after being unchanged in February. Economists polled by Reuters had forecast construction spending gaining 0.3%. Construction spending increased 9.6% year-on-year in March. |
No 5 |
-0.2% |
|
Mar-2024 |
|
| |
|
|
|
Construction Spending Slips 0.3 Percent in February as Declines in Private and Public Nonresidential Projects Outweigh Growth in Homebuilding. Total construction spending declined from January to February to an annual rate of nearly $2.1 trillion, but all categories posted year-over-year gains, according to an analysis of a new government report that the Associated General Contractors of America released today. Association officials noted, however, that the monthly decline could have been caused by changes in winter weather patterns, including heavy rain and snow in the west, during February. |
No 4 |
-0.3% |
|
Feb-2024 |
|
| |
|
|
|
Total construction spending slipped from December to January amid widespread severe weather, but outlays climbed strongly compared to January 2023, with year-over-year gains in every category, according to an analysis of a new government report that the Associated General Contractors of America released today. Association officials noted, however, that some construction segments appear to be impacted by broader economic conditions. |
No 3 |
-0.2% |
|
Jan-2024 |
|
| |
|
|
|
US construction spending experienced an increase during December 2023, according to the latest data released by the country’s Census Bureau. The seasonally adjusted annual rate of construction spending in the month reached $2.09tn, a 0.9% rise above the revised November 2023 estimate of $2.07tn. This figure also represents a year-on-year (YoY) 13.9% increase from the December 2022 estimate of $1.84tn. The total value of construction for 2023 in the US was $1.97tn, a 7.0% growth rise compared to $1.84tn spent in 2022. |
No 2 |
0.9% |
|
Dec-2023 |
|
| |
|
|
|
Total construction spending increased by 0.4 percent in November, as a pickup in homebuilding and some private nonresidential markets offset a downturn in public spending, according to an analysis of federal spending data the Associated General Contractors of America released today. Association officials said the new spending data comes as they and Sage are getting set to release the 2024 Construction Hiring & Business Outlook this Thursday that includes the industry’s predictions for spending trends for the year. |
No 1 |
0.4% |
|
Nov-2023 |
|
| |
|
|
|
|
|
|
|
|
| |
|
|
|
|
|
| |
|
|
|
|
|
|
|
|
|
|
|
|
|
|
|
Brief News | 2023 |
|
|
Construction Spending | Growth |
|
Today's Week |
|
|
|
|
|
|
|
|
|
|
|
|
|
Construction Spending (At 10:00 a.m ET)
| DATE/WEEK |
HIGHLIGHTS |
FOR |
M/M |
|
US construction spending rises in October 2023. U.S. construction spending increased more than expected in October amid strong gains in single-family homebuilding, but data for the prior month was revised lower. The Commerce Department said on Friday that construction spending rose 0.6%. Data for September was revised down to show construction spending climbing 0.2% instead of 0.4% as previously reported. Economists polled by Reuters had forecast construction spending climbing 0.4%. Construction spending accelerated 10.7% on a year-on-year basis in October. |
Oct |
0.6% |
|
2023 |
|
| |
|
|
|
September Construction Spending Up 0.4%, Meeting Economists' Expectations. Total construction spending in September 2023 was 0.4% higher than in August and 8.7% higher than a year earlier. The housing shortage is boosting new construction, but high interest rates may hamper further gains. Public construction is also up, with highway construction down slightly. |
Sep |
0.4% |
|
2023 |
|
| |
|
|
|
U.S. construction spending increased in August, lifted by outlays on single- and multi-family housing, though mortgage rates at nearly 23-year highs could slow momentum. The Commerce Department said on Monday that construction spending rose 0.5%. Data for July was revised higher to show construction spending advancing 0.9% instead of 0.7% as previously reported. The increase in spending in August was in line with economists' expectations. Construction spending jumped 7.4% on a year-on-year basis in August. Spending on private construction projects rose 0.5%, with investment in residential construction rising 0.6% after increasing 1.6% in the prior month. Private construction spending gained 1.2% in July. |
Aug |
0.5% |
|
2023 |
|
| |
|
|
|
US construction spending rises strongly in July on single-family housing. U.S. construction spending increased solidly in July as a shortage of houses on the market boosted outlays on single-family housing projects. The Commerce Department said on Friday that construction spending rose 0.7%. Data for June was revised slightly higher to show construction spending increasing 0.6% instead of 0.5% as previously reported. Economists polled by Reuters had forecast construction spending increasing 0.5%. Construction spending increased 5.5% on a year-on-year basis in July. Spending on private construction projects rose 1.0%, with investment in residential construction advancing 1.4% after increasing 1.5% in the prior month. Private construction spending rose 0.6% in June. |
Jul |
0.7% |
|
2023 |
|
| |
|
|
|
US construction spending rises strongly in June 2023. U.S. construction spending increased solidly in June and the prior month's data was revised higher, boosted by outlays in both single and multifamily housing projects. The Commerce Department said on Tuesday that construction spending rose 0.5%. Data for May was revised higher to show construction spending surging 1.1% instead of 0.9% as previously reported. Economists polled by Reuters had forecast construction spending increasing 0.6%. Construction spending advanced 3.5% on a year-on-year basis in June. Spending on private construction projects increased 0.5%, with investment in residential construction rising 0.9% after rebounding 2.9% in the prior month. |
Jun |
0.5% |
|
2023 |
|
| |
|
|
|
US construction spending beats expectations in May 2023 on housing. U.S. construction spending increased more than expected in May as a severe shortage of houses for sale boosted outlays on single-family homebuilding. The Commerce Department said on Monday that construction spending rose 0.9% after gaining 0.4% in April. Economists polled by Reuters had forecast construction spending increasing 0.6%. Construction spending advanced 2.4% on a year-on-year basis in May. |
May |
0.9% |
|
2023 |
|
| |
|
|
|
U.S. construction spending surged in April 2023, boosted by investment in nonresidential structures, but higher mortgage rates continued to depress single-family homebuilding. The Commerce Department said on Thursday that construction spending jumped 1.2% after rising 0.3% in March. |
Apr |
1.2% |
|
2023 |
|
| |
|
|
|
US construction spending rebounds in March 2023 on nonresidential structures. U.S. construction spending increased more than expected in March, boosted by investment in nonresidential structures, but single-family homebuilding remained depressed amid higher mortgage rates. The Commerce Department said on Monday that construction spending rose 0.3% in March after declining 0.3% in February. Economists polled by Reuters had forecast construction spending gaining 0.1%. Construction spending increased 3.8% on a year-on-year basis in March. |
Mar |
0.3% |
|
2023 |
|
| |
|
|
|
U.S. construction spending dipped in February as investment in single-family homebuilding maintained its downward trend amid higher mortgage costs. The Commerce Department said on Monday that construction spending slipped 0.1% in February after increasing 0.4% in January. Economists polled by Reuters had forecast construction spending would be unchanged. Construction spending increased 5.2% on a year-on-year basis in February. Spending on private construction projects was unchanged after gaining 0.2% in January.Investment in residential construction fell 0.6%, with spending on single-family housing projects plunging 1.8%. Outlays on multi-family housing projects rose 1.4%, continuing to be supported by demand for rental housing. |
Feb |
-0.1% |
|
2023 |
|
| |
|
|
|
Other data from the Commerce Department showed construction spending dipping 0.1% in January as investment in single-family homebuilding continued to decline. The housing market has been hammered by the Fed's aggressive monetary policy tightening. U.S. construction spending unexpectedly fell in January as investment in single-family homebuilding continued to decline. The Commerce Department said on Wednesday that construction spending dipped 0.1% in January after dropping 0.7% in December. Economists polled by Reuters had forecast construction spending rising 0.2%. Construction spending increased 5.7% on a year-on-year basis in January. Spending on private construction projects was unchanged after decreasing 0.8% in December. Investment in residential construction fell 0.6%, with spending on single-family housing projects dropping 1.7%. Outlays on multi-family housing projects rose 0.4%, boosted by strong demand for rental housing. The housing market has been hammered by the Federal Reserve's aggressive monetary policy tightening, with residential investment contracting for seven straight quarters, the longest such stretch since 2009. |
Jan |
-0.1% |
|
2023 |
|
| |
|
|
|
U.S. construction spending unexpectedly fall in December 2022. U.S. construction spending unexpectedly fell in December as investment in single-family homebuilding continued to slump amid higher mortgage rates. The Commerce Department said on Wednesday that construction spending dropped 0.4% in December. Economists polled by Reuters had forecast construction spending unchanged. Construction spending increased 7.7% on a year-on-year basis in November. It jumped 10.2% in 2022. |
Dec |
-0.4% |
|
2022 |
|
| |
|
|
|
U.S. construction spending unexpectedly rebounded in November, lifted by gains in nonresidential structures, but single-family homebuilding continued to be hammered by higher mortgage rates. The Commerce Department said on Tuesday that construction spending climbed 0.2% in November after falling 0.2% in October. Economists polled by Reuters had forecast construction spending would decrease 0.4%. Construction spending increased 8.5% on a year-on-year basis in November.Spending on private construction projects advanced 0.3% after declining 0.7% in October. Investment in private non-residential structures like gas and oil well drilling jumped 1.7%. But outlays on residential construction fell 0.5%, with spending on single-family housing projects plunging 2.9%. Outlays on multi-family housing projects increased 2.4%, benefiting from strong demand for rental housing. |
Nov |
0.2% |
|
2022 |
|
| |
|
|
|
|
|
|
|
|
| |
|
|
|
|
|
| |
|
|
|
|
|
|
|
|
|
|
|
|
|
|
|
Brief News | 2022 |
|
|
Construction Spending | Growth |
|
Today's Week |
|
|
|
|
|
|
|
|
|
|
|
|
|
Construction Spending (At 10:00 a.m ET)
| DATE/WEEK |
HIGHLIGHTS |
FOR |
M/M |
|
U.S. construction spending fell in October 2022, pulled down by continued weakness in single-family homebuilding amid higher mortgage rates. The Commerce Department said on Thursday that construction spending dropped 0.3% in October 2022 after gaining 0.1% in September. The decrease was in line with economists' expectations. Construction spending increased 9.2% on a year-on-year basis in October. Spending on private construction projects dropped 0.5% after being unchanged in September. Investment in residential construction slipped 0.3%, with spending on single-family housing projects tumbling 2.6%. Outlays on multi-family housing projects rose 0.6%. The housing market is reeling from the Federal Reserve's fastest rate-hiking cycle since the 1980s as it battles inflation. The 30-year fixed mortgage rate breached 7% in October for the first time since 2002, data from mortgage finance agency Freddie Mac showed. |
No 12 |
-0.3% |
|
Oct-2022 |
|
| |
|
|
|
U.S. construction spending unexpectedly rebounded in September 2022, amid a surge in investment in nonresidential structures that offset a further decline in outlays on single-family homebuilding. The Commerce Department said on Tuesday that construction spending rose 0.2% in September 2022 after declining 0.6% in August. Economists polled by Reuters had forecast construction spending would decrease 0.5%. Construction spending advanced 10.9% on a year-on-year basis in September |
No 11 |
0.2% |
|
Sep-2022 |
|
| |
|
|
|
U.S. construction spending fell by the most in 1-1/2 years in August 2022, pulled down by a sharp decline in outlays on single-family homebuilding amid surging mortgage rates. The Commerce Department said on Monday that construction spending dropped 0.7% in August, the largest decline since February 2021, after decreasing 0.6% in July. Economists polled by Reuters had forecast construction spending would slip 0.3%. Construction spending increased 8.5% on a year-on-year basis in August. |
No 10 |
-0.7% |
|
Aug-2022 |
|
| |
|
|
|
The Commerce Department said on Thursday that construction spending fell 0.4% in July 2022 after decreasing 0.5% in June. July's decline was in line with economists' expectations. Construction spending increased 8.5% on a year-on-year basis in July. Construction spending dipped in July, as residential construction fell amid rising mortgage rates and declining home affordability. The U.S. Census Bureau said Thursday that total construction spending during July 2022 was estimated at a seasonally adjusted annual rate of $1.777 trillion, down 0.4% from the revised June estimate of $1.784 trillion. The July figure, however, was still 8.5% above the July 2021 estimate of $1.64 trillion. Through the first seven months of 2022, total construction spending was $1.01 triillion, 10.8% above the $915.2 billion for the same period in 2021, the report said. Spending on private construction was at a seasonally adjusted annual rate of $1.42 trillion, 0.8% below the revised June estimate of $1.44 trillion. Decline in single- and multifamily home construction helped offset increase in public construction. |
No 9 |
-0.4% |
|
Jul-2022 |
|
| |
|
|
|
U.S. construction spending tumbled in June as outlays on single-family homebuilding declined sharply amid rising mortgage rates. The Commerce Department said on Monday that construction spending dropped 1.1% in June 2022 after gaining 0.1% in May. Economists polled by Reuters had forecast construction spending would rise 0.1%. Construction spending increased 8.3% on a year-on-year basis in June. Spending on private construction projects decreased 1.3% after increasing 0.2% in May. Investment in residential construction dropped 1.6%, with spending on single-family projects plunging 3.1%. Outlays on multi-family housing projects increased 0.4%. |
Np 8 |
-1.1% |
|
Jun-2022 |
|
| |
|
|
|
U.S. construction spending unexpectedly fell in May 2022 as single-family homebuilding stalled, more evidence that the Federal Reserve's aggressive monetary policy tightening was slowing the economy. The Commerce Department said on Friday that construction spending slipped 0.1% in May 2022 after increasing 0.8% in April. Economists polled by Reuters had forecast construction spending would rise 0.4%. Construction spending increased 9.7% on a year-on-year basis in May. Spending on private construction projects was unchanged in May after advancing 1.1% in April. Investment in residential construction rose 0.2%, though spending on both single-family and multi-family housing projects was flat. The average contract rate on a 30-year fixed-rate mortgage has jumped close to 6% as the Fed raises interest rates to tame inflation. |
No 7 |
-0.1% |
|
May-2022 |
|
| |
|
|
|
U.S. Construction Spending Rises Less Than Expected In April 2022. Construction spending in the U.S. increased by less than expected in the month of April 2022, according to a report released by the Commerce Department on Wednesday. The report showed construction spending edged up by 0.2 percent to an annual rate of $1.745 trillion in April after rising by 0.3 percent to a revised rate of $1.741 trillion in March. Economist had expected construction spending to climb by 0.5 percent compared to the 0.1 percent uptick originally reported for the previous month. The modest increase in construction spending came as spending on private construction rose by 0.5 percent to an annual rate of $1.395 trillion. A 0.9 percent advance in spending on residential construction was partly offset by a 0.2 percent dip in spending on non-residential construction.. |
No 6 |
0.2% |
|
Apr-2022 |
|
| |
|
|
|
U.S. construction spending barely rose in March 2022 as a moderate increase in outlays on private projects was partially offset by a further decline in public spending.The Commerce Department said on Monday that construction spending edged up 0.1% after increasing 0.5% in February. Economists polled by Reuters had forecast construction spending would accelerate 0.7%. Construction spending increased 11.7% on a year-on-year basis in March. |
No 5 |
0.1% |
|
Mar-2022 |
|
| |
|
|
|
U.S. construction spending rose less than expected in February 2022 as an increase in outlays on private projects was partially offset by a decline in government spending. The Commerce Department said on Friday that construction spending climbed 0.5%. Data for January was revised higher to show construction outlays advancing 1.6% instead of 1.3% as previously reported. Economists polled by Reuters had forecast construction spending rising 1.0%. Construction spending soared 11.2% on a year-on-year basis in February. Construction spending during February 2022 was estimated at a seasonally adjusted annual rate of $1,704.4 billion, 0.5% above the revised January estimate of $1,695.5 billion, according to the U.S. Census Bureau. The February figure is 11.2% above the February 2021 estimate of $1,533.3 billion. During the first two months of this year, construction spending amounted to $237.8 billion, 10.4% above the $215.4 billion for the same period in |
No 4 |
0.5% |
|
Feb-2022 |
|
| |
|
|
|
U.S. construction spending surged in January, boosted by strong outlays on single-family homebuilding and private nonresidential structures. The Commerce Department said on Tuesday that construction spending increased 1.3%. Data for December was revised higher to show construction outlays rising 0.8% instead of 0.2% as previously reported. Economists polled by Reuters had forecast construction spending gaining 0.2%. Construction spending increased 8.2% on a year-on-year basis in January. Spending on private construction projects shot up 1.5% in January. Outlays on residential construction increased 1.3%. |
No 3 |
1.3% |
|
Jan-2022 |
|
| |
|
|
|
U.S. construction spending increased less than expected in December as a solid rise in private projects was partially offset by a sharp decline in outlays on public projects. The Commerce Department said on Tuesday that construction spending rose 0.2% after advancing 0.6% in November. Economists polled by Reuters had forecast construction spending gaining 0.6%. Construction spending increased 9.0% on a year-on-year basis in December. It rose 8.2% in 2021. |
No 2 |
0.2% |
|
Dec-2021 |
|
| |
|
|
|
U.S. construction spending increased in November amid strong gains in single-family homebuilding, but outlays on public projects were weak.The Commerce Department said on Monday that construction spending rose 0.4% after a similar advance in October.Economists polled by Reuters had forecast construction spending climbing 0.6%. Construction spending increased 9.3% on a year-on-year basis in November. |
No 1 |
0.4% |
|
Nov-2021 |
|
| |
|
|
|
|
|
|
|
|
| |
|
|
|
|
|
| |
|
|
|
|
|
|
|
|
|
|
|
|
|
|
|
Brief News | 2021 |
|
|
Construction Spending | Growth |
|
Today's Week |
|
|
|
|
|
|
|
|
|
|
|
|
|
Construction Spending (At 10:00 a.m ET)
| DATE/WEEK |
HIGHLIGHTS |
FOR |
M/M |
|
U.S. construction spending rebounded less than expected in October as a decline in homebuilding blunted a surge in outlays on public projects. The Commerce Department said on Wednesday that construction spending gained 0.2% after dipping 0.1% in September. Economists polled by Reuters had forecast construction spending rising 0.4%. Construction spending increased 8.6% on a year-on-year basis in September. |
No 12 |
0.2% |
|
Oct-2021 |
|
| |
|
|
|
U.S. construction spending unexpectedly fell in September amid declines in outlays on both private and public projects. The Commerce Department said on Monday that construction spending dropped 0.5% after edging up 0.1% in August. Economists polled by Reuters had forecast construction spending gaining 0.4%. Construction spending increased 7.8% on a year-on-year basis in September. The government reported last week that gross domestic product increased at a 2.0% annualized rate, stepping down from the April-June's robust 6.7% pace. |
No 11 |
-0.5% |
|
Sep-2021 |
|
| |
|
|
|
U.S. construction spending was unexpectedly flat in August as an increase in public sector projects was offset by weakness in the private sector. The Commerce Department said on Friday that the unchanged reading in construction spending followed a 0.3% gain in July. Construction spending increased 8.9% on a year-on-year basis in August. Economists polled by Reuters had forecast construction spending gaining 0.3%. |
No 10 |
0.0% |
|
Aug-2021 |
|
| |
|
|
|
Construction spending was estimated at $1,568.8 billion on a seasonally adjusted annual basis in July 2021, up 0.3 percent (1.2 percent) from the revised June estimate of $1,563.4 billion. The July estimate is 9.0% (1.5%) higher than the July 2020 estimate of $1,439.6 billion. Construction spending totaled $883.2 billion in the first seven months of this year, up 6.2 percent (1.0 percent) from $831.5 billion in the same period in 2020.Residential construction saw gigantic increases year over year compared to that of Infrastructure which has remained stagnant. |
No 9 |
0.3% |
|
Jul-2021 |
|
| |
|
|
|
U.S. construction spending rose by 0.1% in June, the Commerce Department said on Monday, as an increase in private projects was offset by a fall in public sector building. Construction spending, which accounts for less than 4% of U.S. gross domestic product, increased by 8.2% on a year-on-year basis in June after falling 0.2% in May, data showed. Economists polled by Reuters had forecast construction spending rising by 0.4% in June. |
No 8 |
0.1% |
|
Jun-2021 |
|
| |
|
|
|
U.S. construction spending unexpectedly fell in May as gains in private homebuilding were offset by persistent weakness in outlays on nonresidential structures and public projects. The Commerce Department said on Thursday that construction spending dropped 0.3% after edging up 0.1% in April. Economists polled by Reuters had forecast construction spending rising 0.4%. Construction spending, which accounts for about 3.6% of gross domestic product, increased 7.5% on a year-on-year basis in May. |
No 7 |
-0.3% |
|
May-2021 |
|
| |
|
|
|
U.S. Census Bureau: April Construction Spending Up 9.8% Year-Over-Year. Construction spending for the fourth month of 2021 was up 0.2% from the previous month of March. Construction spending during April was estimated at a seasonally adjusted annual rate of $1,524.2 billion, 0.2% above the March 2020 estimate of $1,521 billion, but 9.8% above the April 2020 estimate of $1,387.9 billion, according to the U.S. Census Bureau. |
No 6 |
0.2% |
|
Apr-2021 |
|
| |
|
|
|
U.S. construction spending rebounded far less than expected in March as strength in housing was offset by continued weakness in outlays on nonresidential structures and public projectsThe Commerce Department said on Monday that construction spending gained 0.2% after falling 0.6% in February. Economists polled by Reuters had forecast construction spending surging 1.9%. Construction spending, which accounts for about 4% of gross domestic product, increased 5.3% on a year-on-year basis in March. |
No 5 |
0.2% |
|
Mar-2021 |
|
| |
|
|
|
National nonresidential construction spending declined 1.3% in February, according to an Associated Builders and Contractors analysis of data published today by the U.S. Census Bureau. On a seasonally adjusted annualized basis, nonresidential spending totaled $789.5 billion for the month. On a monthly basis, spending was down in 13 of 16 nonresidential subcategories. Private nonresidential spending was down 1.0%, while public nonresidential construction spending fell 1.8% in February. Nonresidential construction spending has declined by 6.1% from the same time last year. |
No 4 |
-0.8% |
|
Feb-2021 |
|
| |
|
|
|
Construction spending increased by 1.7% to $1.521 trillion, according to the Commerce Department's monthly report for January, with that level marking the greatest since the start of the government series in 2002. December's construction outlays were revised up to show a 1.1% increase, from the 1.0% rise previously reported. The January jump was more than double the 0.8% rise expected.
Residential projects were an exceptional contributor to the January gain, with spending on these projects rising by 2.5% following a 3.8% jump in December. |
No 3 |
1.7% |
|
Jan-2021 |
|
| |
|
|
|
Despite the pandemic, construction spending for 2020 wound up at $1,429.7 billion, up 4.7% from 2019.
Construction spending during December 2020 was estimated at a seasonally adjusted annual rate of $1,490.4 billion, 5.7% above the December 2019 estimate of $1,410.3 billion and 1% above the revised November estimate of $1,475.6 billion, according to the U.S. Census Bureau. |
No 2 |
1.0% |
|
Dec-2020 |
|
| |
|
|
|
U.S. Construction Spending Actual 0.9% frm Previous 1.6% and forecast 1.0%. Construction spending during November 2021 was estimated at a seasonally adjusted annual rate of $1,625.9 billion, 0.4% above the revised October estimate of $1,618.8 billion, according to the U.S. Census Bureau. The November figure is 9.3% above the November 2020 estimate of $1,487.2 billion. During the first eleven months of this year, construction spending amounted to $1,463.2 billion, 7.9% above the $1,355.6 billion for the same period in 2020. |
No 1 |
0.9% |
|
Nov-2020 |
|
| |
|
|
|
|
|
|
|
|
| |
|
|
|
|
|
| |
|
Legends: |
|
Delayed |
|
Positive View |
|
Negative View |
|
Neutral View |
|
Non Available |
|
|
|
|
|
|
|
|
|
|
|
|
|
|
|
|
|
|
|
|
| |
|
|
|
|
|
|
|
|
|
|
|
|
|
|
|
|
|
|
|
|
|
Definitions | Explain |
|
|
Construction Spending | Growth |
|
Today's Week |
|
|
|
|
|
|
|
|
|
|
|
|
| |
|
|
|
|
| |
|
| CONSTRUCTION SPENDING |
What is Construction Spending?
Construction spending gauges the level of construction activity in the United States. The Construction Spending report looks at both residential and non-residential construction.
Construction spending data can be a meaningful tool for taking the pulse of the real estate market as well as the overall economy. The data, which is also called Value of Construction Put In Place, is released at 10 a.m. Eastern Time on the first business day of the month. It’s released by the U.S. Census Bureau and seeks to estimate how much has been spent on construction. It includes both private projects as well as government construction. The construction spending costs include labor, materials, overhead, interest, taxes, contractors’ profits and professional fees, such as engineering or architectural services. It includes the value of work done on new structures as well as improvements to existing structures.
Construction spending represents about 20% of the gross domestic product (GDP), making it a very important source of information. Thus, the reason to be categorized as "Growth"
The data covers three important areas:
1. Private construction: residential
The residential category includes single family homes and apartments.
2. Private construction: Non-residential
Nonresidential construction includes factories, offices, hotels, motels, churches, hospitals, and private schools.
3. Public construction:
Finally, the public sector covers highways, streets, military reservations, water supply
facilities, public school buildings, housing projects, and sewer systems.
Disadvantages
The construction spending data has two problems:
1) It is late in coming and not particularly accurate when it arrives.
2) It is published two months out from the reported month, making it one of the last pieces of information reported on the state of the economy.
Construction Spending and GDP
The report was started in 1964 and is used along with other data by the Bureau of Economic Analysis to produce GDP statistics. The data is also used by other government agencies while businesses, including construction companies, use it for making economic forecasts, financial decisions and conducting market research. In a similar manner, the data can be used when assessing capital expenditures that can expand the economy’s production capability, which can help curtail inflationary pressures by increasing supply of goods and services. From a broader perspective, the construction spending report can provide insight into the overall economy. Increased construction activity is often associated with economic growth and since the data is included in GDP calculations, it can point to if the economy is expanding or contracting.
Construction Spending and Real Estate
Perhaps more specifically, when the economy is strengthening, unemployment declines and wages improve, which means more individuals can afford housing, so demand for homes increases. Homebuilders respond to this increased demand by building more homes and may have to hire additional employees, which in turn supports economic growth as these new employees generate income to spend on goods and services. An increase in new homes can also drive an increase in demand for consumer goods as new homeowners need furniture, kitchen items, tools and other items.
Increased construction spending on apartments and decreased spending on single-family homes can imply that builders believe fewer individuals can afford homeownership and instead need to rent apartments. The data can also help assess the impact of rising interest rates on affordability. When mortgage interest rates increase and single-family home construction declines, builders may be concerned that the higher interest rates are pushing the cost of home ownership beyond the reach of Americans. Low interest rates, understandably, have just the opposite effect.
ver |
|
|
| |
|
|
|
|
|
|
|
|
|
|
|
| |
|
|
|
|
|
|
| DATA INFORMATION |
CONSTRUCTION SPENDING |
| SOURCE |
Bureau of Economic Analysis (BEA), U.S. Department of Commerce. |
| WEB |
www.bea.gov |
| FREQUENCY |
Quarterly |
| AVAILABILITY |
Usually during the fourth week of the month. |
| COVERAGE |
Data are for the previous quarter. |
| REVISIONS |
Yes |
| IMPORTANCE |
Growth - Very Important |
|
| |
|
|
|
|
|
|
|
|
|
|
|
|