|
 |
|
 |
Consumer Price Index (CPI) | Inflation |
|
 |
|
The Consumer Price Index (CPI), is a measure of the average change over time in the prices paid by urban consumers for a market basket of consumer goods and services in a country. It does not include stocks and Bonds or Real Estate. Read More
|
|
|
|
|
|
|
| |
|
| |
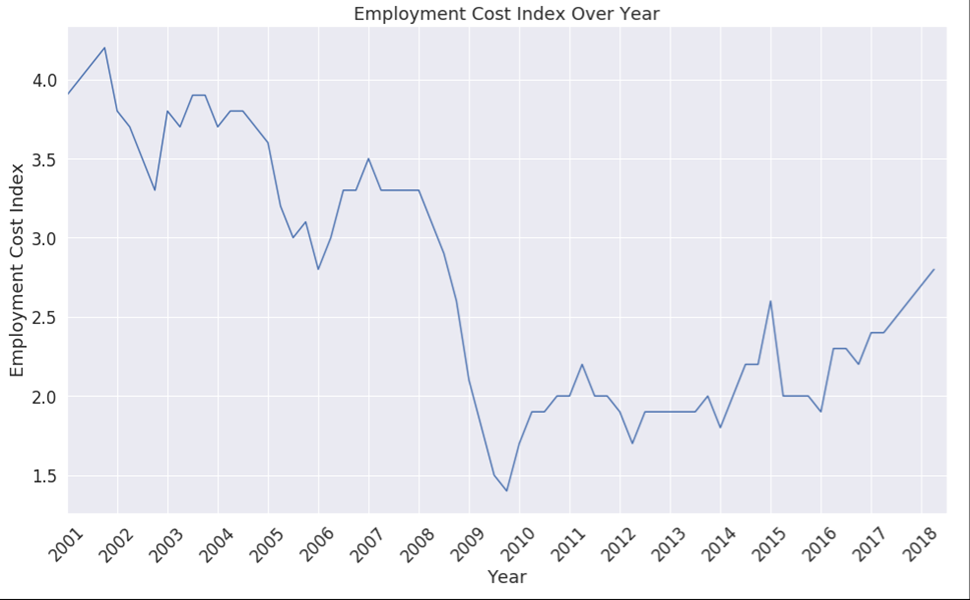
 1. Consumer Price Index CPI (1 of 5) 1. Consumer Price Index CPI (1 of 5) 2. Core PCE (2 of 5) 2. Core PCE (2 of 5) 3. Producer Price Index PPI (3 of 5) 3. Producer Price Index PPI (3 of 5) 4. Import and Exports Prices (4 of 5) 4. Import and Exports Prices (4 of 5) 5. Employment Cost Index ECI (5 of 5) 5. Employment Cost Index ECI (5 of 5)
|
 |
|
|
|
|
| |
|
→ Big Chart |
|
→ Release |
|
| |
|
|
|
|
|
|
|
|
|
|
|
|
|
|
|
|
|
|
|
 |
|
Big Chart | Large Data |
 |
|
Consumer Price Index (CPI) | Inflation |
|
Today's Week |
 |
|
|
|
|
|
|
|
|
|
|
|
|
|
| |
|
|
|
|
|
|
|
|
|
|
|
|
|
|
|
|
|
|
|
|
|
Slides | Five 5 |
|
|
Consumer Price Index (CPI) | Inflation |
|
Today's Week |
|
|
|
|
|
|
|
|
|
|
|
|
|
|
| |
|
|
|
|
|
|
|
|
|
|
|
|
|
|
|
|
|
|
|
|
|
Release Schedule | 2026 |
|
|
Consumer Price Index (CPI) | Inflation |
|
Today's Week |
|
|
|
|
|
|
|
|
|
|
|
|
| |
Consumer Price Index CPI (At 8:30 a.m ET)
| SCHEDULE 2026 |
No 1 |
No 2 |
No 3 |
No 4 |
No 5 |
No 6 |
No 7 |
No 8 |
No 9 |
No 10 |
No 11 |
No 12 |
| Release | Week |
|
|
|
|
|
|
|
|
|
|
|
|
| Release | Date |
|
|
|
|
|
|
|
|
|
|
|
|
| Release | Day |
|
|
|
|
|
|
|
|
|
|
|
|
 |
|
|
|
|
|
|
|
|
|
|
|
|
| Prior |
0.2% |
0.3% |
0.2% |
0.3% |
0.9% |
0.6% |
... |
... |
... |
... |
... |
... |
| Prior Revised |
0.3% |
... |
... |
... |
... |
... |
... |
... |
... |
... |
... |
... |
| CONSENSUS |
0.3% |
0.3% |
0.3% |
0.9% |
0.6% |
0.5% |
... |
... |
... |
... |
... |
... |
| Consensus Low |
0.2% |
0.1% |
0.2% |
0.8% |
0.4% |
0.3% |
... |
... |
... |
... |
... |
... |
| Consensus High |
0.4% |
0.3% |
0.3% |
1.3% |
0.9% |
0.7% |
... |
... |
... |
... |
... |
... |
| CPI M/M |
0.3% |
0.2% |
0.3% |
0.9% |
0.6% |
0.5% |
... |
... |
... |
... |
... |
... |
|
|
|
|
|
|
|
|
|
|
|
|
|
| YEAR/YEAR |
No 1 |
No 2 |
No 3 |
No 4 |
No 5 |
No 6 |
No 7 |
No 8 |
No 9 |
No 10 |
No 11 |
No 12 |
| Prior Y/Y |
2.7% |
2.7% |
2.4% |
2.4% |
3.3% |
3.8% |
... |
... |
... |
... |
... |
... |
| Consensus Y/Y |
2.6% |
2.5% |
2.4% |
3.4% |
3.8% |
4.2% |
... |
... |
... |
... |
... |
... |
|
|
|
|
|
|
|
|
|
|
|
|
|
| CPI Y/Y |
2.7% |
2.4% |
2.4% |
3.3% |
3.8% |
4.2% |
... |
... |
... |
... |
... |
... |
| RATING |
|
|
|
|
|
|
|
|
|
|
|
|
| Month For |
Dec 25 |
Jan-26 |
Feb-26 |
Mar-26 |
Apr-26 |
May-26 |
Jun-26 |
Jul-26 |
Aug-26 |
Sep-26 |
Oct-26 |
Nov-26 |
|
|
|
|
|
|
|
|
|
|
|
|
|
|
| |
if inflation remains above the central bank's 2% target |
|
Core Consumer Price Index - Excludes food and energy (At 8:30 a.m ET)
| SCHEDULE 2026 |
No 1 |
No 2 |
No 3 |
No 4 |
No 5 |
No 6 |
No 7 |
No 8 |
No 9 |
No 10 |
No 11 |
No 12 |
| Release | Week |
|
|
|
|
|
|
|
|
|
|
|
|
| Release | Date |
|
|
|
|
|
|
|
|
|
|
|
|
| Release | Day |
|
|
|
|
|
|
|
|
|
|
|
|
|
|
|
|
|
|
|
|
|
|
|
|
|
| Prior |
0.2% |
0.2% |
0.3% |
0.2% |
0.2% |
... |
... |
... |
... |
... |
... |
... |
| Prior Revised: |
... |
... |
... |
... |
... |
... |
... |
... |
... |
... |
... |
... |
| Consensus M/M |
0.3% |
0.3% |
0.2% |
0.3% |
0.3% |
... |
... |
... |
... |
... |
... |
... |
| Consensus Low: |
0.2% |
0.2% |
0.2% |
0.2% |
0.2% |
... |
... |
... |
... |
... |
... |
... |
| Consensus High: |
0.4% |
0.4% |
0.3% |
0.4% |
0.5% |
... |
... |
... |
... |
... |
... |
... |
| Core CPI M/M: |
0.2% |
0.3% |
0.2% |
0.2% |
0.4% |
... |
... |
... |
... |
... |
... |
... |
|
|
|
|
|
|
|
|
|
|
|
|
|
| PriorY/Y: |
2.7% |
2.6% |
2.5% |
2.5% |
2.6% |
... |
... |
... |
... |
... |
... |
... |
| Consensus Y/Y: |
2.7% |
2.5% |
2.5% |
2.7% |
2.7% |
... |
... |
... |
... |
... |
... |
... |
|
|
|
|
|
|
|
|
|
|
|
|
|
| Core CPI Y/Y: |
2.6% |
2.5% |
2.5% |
2.6% |
2.8% |
... |
... |
... |
... |
... |
... |
... |
| RATING: |
|
|
|
|
|
|
|
|
|
|
|
|
| Month For: |
Dec 25 |
Jan-26 |
Feb-26 |
Mar-26 |
Apr-26 |
May-26 |
Jun-26 |
Jul-26 |
Aug-26 |
Sep-26 |
Oct-26 |
Nov-26 |
|
|
|
|
|
|
|
|
|
|
|
|
|
|
|
| |
|
| |
|
|
|
|
|
|
|
|
|
|
|
Release Schedule | 2025 |
|
|
Consumer Price Index (CPI) | Inflation |
|
Today's Week |
|
|
|
|
|
|
|
|
|
|
|
|
| |
Consumer Price Index CPI (At 8:30 a.m ET)
| SCHEDULE 2025 |
No 1 |
No 2 |
No 3 |
No 4 |
No 5 |
No 6 |
No 7 |
No 8 |
No 9 |
No 10 |
No 11 |
No 12 |
| Release | Week |
|
|
|
|
|
|
|
|
|
|
|
|
| Release | Date |
|
|
|
|
|
|
|
|
|
|
|
|
| Release | Day |
|
|
|
|
|
|
|
|
|
|
|
|
|
|
|
|
|
|
|
|
|
|
|
|
|
| Prior |
0.3% |
0.4% |
0.5% |
0.2% |
-0.1% |
0.2% |
0.1% |
0.3% |
0.2% |
... |
3.0% |
... |
| Prior Revised |
... |
... |
... |
... |
... |
... |
... |
... |
... |
... |
... |
... |
| CONSENSUS |
0.3% |
0.3% |
0.3% |
0.1% |
0.3% |
0.2% |
0.3% |
0.2% |
0.3% |
... |
... |
... |
| Consensus Low |
0.2% |
0.2% |
0.2% |
0.1% |
0.2% |
0.1% |
-0.2% |
0.1% |
0.3% |
... |
... |
... |
| Consensus High |
0.4% |
0.4% |
0.4% |
0.3% |
0.6% |
0.3% |
0.4% |
0.3% |
0.4% |
... |
... |
... |
| CPI M/M |
0.4% |
0.5% |
0.2% |
-0.1% |
0.2% |
0.1% |
0.3% |
0.2% |
0.4% |
... |
... |
... |
|
|
|
|
|
|
|
|
|
|
|
|
|
| YEAR/YEAR |
No 1 |
No 2 |
No 3 |
No 4 |
No 5 |
No 6 |
No 7 |
No 8 |
No 9 |
No 10 |
No 11 |
No 12 |
| Prior Y/Y |
2.7% |
2.9% |
3.0% |
2.8% |
2.4% |
2.3% |
2.4% |
2.7% |
2.7% |
2.9% |
3.0% |
3.0% |
| Consensus Y/Y |
2.9% |
2.9% |
2.9% |
2.6% |
2.4% |
2.5% |
2.6% |
2.8% |
2.9% |
... |
... |
... |
|
|
|
|
|
|
|
|
|
|
|
|
|
| CPI Y/Y |
2.9% |
3.0% |
2.8% |
2.4% |
2.3% |
2.4% |
2.7% |
2.7% |
2.9% |
3.0% |
3.0% |
2.7% |
| RATING |
|
|
|
|
|
|
|
|
|
|
|
|
| Month For |
Dec 24 |
Jan-25 |
Feb-25 |
Mar-25 |
Apr-25 |
May-25 |
Jun-25 |
Jul-25 |
Aug-25 |
Sep-25 |
Oct-25 |
Nov-25 |
|
|
|
|
|
|
|
|
|
|
|
|
|
|
| |
|
|
Core Consumer Price Index - Excludes food and energy (At 8:30 a.m ET)
| SCHEDULE 2025 |
No 1 |
No 2 |
No 3 |
No 4 |
No 5 |
No 6 |
No 7 |
No 8 |
No 9 |
No 10 |
No 11 |
No 12 |
| Released Week |
|
|
|
|
|
|
|
|
|
|
|
|
| Released Date |
|
|
|
|
|
|
|
|
|
|
|
|
| Released Day |
|
|
|
|
|
|
|
|
|
|
|
|
|
|
|
|
|
|
|
|
|
|
|
|
|
| Prior |
0.3% |
0.2% |
0.4% |
0.2% |
0.1% |
0.2% |
0.1% |
0.2% |
0.3% |
... |
... |
... |
| Prior Revised: |
... |
... |
... |
... |
... |
... |
... |
... |
... |
... |
... |
... |
| Consensus M/M |
0.3% |
0.3% |
0.3% |
0.3% |
0.3% |
0.3% |
0.3% |
0.3% |
0.3% |
... |
... |
... |
| Consensus Low: |
-0.1% |
0.2% |
0.3% |
0.2% |
0.2% |
0.0% |
0.2% |
0.2% |
0.3% |
... |
... |
... |
| Consensus High: |
0.3% |
0.3% |
0.4% |
0.5% |
0.6% |
0.5% |
0.4% |
0.4% |
0.4% |
... |
... |
... |
| Core CPI M/M: |
0.2% |
0.4% |
0.2% |
0.1% |
0.2% |
0.1% |
0.2% |
0.3% |
0.3% |
... |
... |
... |
|
|
|
|
|
|
|
|
|
|
|
|
|
| PriorY/Y: |
3.3% |
3.2% |
3.3% |
3.1% |
2.8% |
2.8% |
2.8% |
2.9% |
3.1% |
... |
... |
... |
| Consensus Y/Y: |
3.3% |
3.1% |
3.2% |
3.0% |
2.8% |
2.9% |
2.9% |
3.0% |
3.1% |
... |
... |
... |
|
|
|
|
|
|
|
|
|
|
|
|
|
| Core CPI Y/Y: |
3.2% |
3.3% |
3.1% |
2.8% |
2.8% |
2.8% |
2.8% |
3.1% |
3.1% |
... |
... |
... |
| RATING: |
|
|
|
|
|
|
|
|
|
|
|
|
| Month For: |
Dec 24 |
Jan-25 |
Feb-25 |
Mar-25 |
Apr-25 |
May-25 |
Jun-25 |
Jul-25 |
Aug-25 |
Sep-25 |
Oct-25 |
Nov-25 |
|
|
|
|
|
|
|
|
|
|
|
|
|
|
|
| |
|
| |
|
|
|
|
|
|
|
|
|
|
|
Release Schedule | 2024 |
|
|
Consumer Price Index (CPI) | Inflation |
|
Today's Week |
|
|
|
|
|
|
|
|
|
|
|
|
| |
Consumer Price Index CPI (At 8:30 a.m ET)
| SCHEDULE 2024 |
No 1 |
No 2 |
No 3 |
No 4 |
No 5 |
No 6 |
No 7 |
No 8 |
No 9 |
No 10 |
No 11 |
No 12 |
| Release | Week |
|
|
|
|
|
|
|
|
|
|
|
|
| Release | Date |
|
|
|
|
|
|
|
|
|
|
|
|
| Release | Day |
|
|
|
|
|
|
|
|
|
|
|
|
|
|
|
|
|
|
|
|
|
|
|
|
|
| Prior |
0.1% |
0.3% |
0.3% |
0.4% |
0.4% |
0.3% |
0.0% |
-0.1% |
0.2% |
0.2% |
0.2% |
0.2% |
| Prior Revised |
... |
0.2% |
... |
... |
... |
... |
... |
... |
... |
... |
... |
... |
| CONSENSUS |
0.2% |
0.2% |
0.4% |
0.3% |
0.3% |
0.1% |
0.1% |
0.2% |
0.2% |
0.1% |
0.2% |
0.3% |
| Consensus Low |
0.1% |
0.1% |
0.3% |
0.2% |
0.3% |
0.1% |
0.0% |
0.0% |
0.0% |
0.0% |
0.2% |
0.2% |
| Consensus High |
0.3% |
0.2% |
0.4% |
0.4% |
0.5% |
0.3% |
0.2% |
0.3% |
0.2% |
0.2% |
0.3% |
0.3% |
| CPI M/M |
0.3% |
0.3% |
0.4% |
0.4% |
0.3% |
0.0% |
-0.1% |
0.2% |
0.2% |
0.2% |
0.2% |
0.3% |
|
|
|
|
|
|
|
|
|
|
|
|
|
| YEAR/YEAR |
No 1 |
No 2 |
No 3 |
No 4 |
No 5 |
No 6 |
No 7 |
No 8 |
No 9 |
No 10 |
No 11 |
No 12 |
| Prior Y/Y |
3.1% |
3.4% |
3.1% |
3.2% |
3.5% |
3.4% |
3.3% |
3.0% |
2.9% |
2.5% |
2.4% |
2.6% |
| Consensus Y/Y |
3.2% |
3.0% |
3.1% |
3.5% |
3.4% |
3.4% |
3.1% |
3.0% |
2.6% |
2.3% |
2.6% |
2.7% |
|
|
|
|
|
|
|
|
|
|
|
|
|
| CPI Y/Y |
3.4% |
3.1% |
3.2% |
3.5% |
3.4% |
3.3% |
3.0% |
2.9% |
2.5% |
2.4% |
2.6% |
2.7% |
| RATING |
|
|
|
|
|
|
|
|
|
|
|
|
| Month For |
Dec 23 |
Jan-24 |
Feb-24 |
Mar-24 |
Apr-24 |
May-24 |
Jun-24 |
Jul-24 |
Aug-24 |
Sep-24 |
Oct-24 |
Nov-24 |
|
|
|
|
|
|
|
|
|
|
|
|
|
|
| |
|
|
Core Consumer Price Index - Excludes food and energy (At 8:30 a.m ET)
| SCHEDULE 2024 |
No 1 |
No 2 |
No 3 |
No 4 |
No 5 |
No 6 |
No 7 |
No 8 |
No 9 |
No 10 |
No 11 |
No 12 |
| Released Week: |
|
|
|
|
|
|
|
|
|
|
|
|
| Released Date: |
|
|
|
|
|
|
|
|
|
|
|
|
| Released Day: |
|
|
|
|
|
|
|
|
|
|
|
|
|
|
|
|
|
|
|
|
|
|
|
|
|
| Prior: |
0.3% |
0.3% |
0.4% |
0.4% |
0.4% |
0.3% |
0.2% |
0.1% |
0.2% |
0.3% |
0.3% |
0.3% |
| Prior Revised: |
... |
... |
... |
... |
... |
... |
... |
... |
... |
... |
... |
... |
| Consensus M/M |
0.2% |
0.3% |
0.3% |
0.3% |
0.3% |
0.3% |
0.2% |
0.2% |
0.2% |
0.2% |
0.3% |
... |
| Consensus Low: |
0.2% |
0.2% |
0.3% |
0.2% |
0.2% |
0.2% |
0.1% |
0.1% |
0.1% |
0.2% |
0.2% |
.... |
| Consensus High: |
0.3% |
0.3% |
0.4% |
0.4% |
0.4% |
0.3% |
0.3% |
0.3% |
0.3% |
0.3% |
0.3% |
... |
| Core CPI M/M: |
0.3% |
0.4% |
0.4% |
0.4% |
0.3% |
0.2% |
0.1% |
0.2% |
0.3% |
0.3% |
0.3% |
0.1% |
|
|
|
|
|
|
|
|
|
|
|
|
|
| PriorY/Y: |
4.0% |
3.9% |
3.9% |
3.8% |
3.8% |
3.6% |
3.4% |
3.3% |
3.2% |
3.2% |
3.3% |
3.3% |
| Consensus Y/Y: |
3.8% |
3.7% |
3.7% |
3.7% |
3.6% |
3.5% |
3.5% |
3.2% |
3.2% |
3.2% |
3.3% |
... |
|
|
|
|
|
|
|
|
|
|
|
|
|
| Core CPI Y/Y: |
3.9% |
3.9% |
3.8% |
3.8% |
3.6% |
3.4% |
3.3% |
3.2% |
3.2% |
3.3% |
3.3% |
3.1% |
| RATING: |
|
|
|
|
|
|
|
|
|
|
|
|
| Month For: |
Dec 23 |
Jan-24 |
Feb-24 |
Mar-24 |
Apr-24 |
May-24 |
Jun-24 |
Jul-24 |
Aug-24 |
Sep-24 |
Oct-24 |
Nov-24 |
|
|
|
|
|
|
|
|
|
|
|
|
|
|
|
| |
|
| |
|
|
|
|
|
|
|
|
|
|
|
Release Schedule | 2023 |
|
|
Consumer Price Index (CPI) | Inflation |
|
Today's Week |
|
|
|
|
|
|
|
|
|
|
|
|
| |
Consumer Price Index CPI (At 8:30 a.m ET)
| SCHEDULE 2023 |
No 1 |
No 2 |
No 3 |
No 4 |
No 5 |
No 6 |
No 7 |
No 8 |
No 9 |
No 10 |
No 11 |
No 12 |
| Released Week: |
|
|
|
|
|
|
|
|
|
|
|
|
| Released Date: |
|
|
|
|
|
|
|
|
|
|
|
|
| Released Day: |
|
|
|
|
|
|
|
|
|
|
|
|
| Prior: |
0.1% |
-0.1% |
0.5% |
0.4% |
0.1% |
0.4% |
0.1% |
0.2% |
0.2% |
0.6% |
0.4% |
0.0% |
| Prior Revised: |
... |
0.1% |
... |
... |
... |
... |
... |
... |
... |
... |
... |
... |
| Consensus M/M |
0.0% |
0.4% |
0.4% |
0.3% |
0.4% |
0.2% |
0.3% |
0.1% |
0.6% |
0.3% |
0.1% |
0.0% |
| Consensus Low: |
-0.2% |
0.3% |
0.3% |
0.2% |
0.2% |
0.0% |
0.1% |
0.1% |
0.4% |
0.3% |
0.0% |
0.0% |
| Consensus High: |
0.3% |
0.6% |
0.5% |
0.4% |
0.5% |
0.3% |
0.4% |
0.4% |
0.7% |
0.4% |
0.2% |
0.2% |
| CPI M/M: |
-0.1% |
0.5% |
0.4% |
0.1% |
0.4% |
0.1% |
0.2% |
0.2% |
0.6% |
0.4% |
0.0% |
0.1% |
|
|
|
|
|
|
|
|
|
|
|
|
|
| YEAR/YEAR |
No 1 |
No 2 |
No 3 |
No 4 |
No 5 |
No 6 |
No 7 |
No 8 |
No 9 |
No 10 |
No 11 |
No 12 |
| Prior Y/Y: |
7.1% |
6.5% |
6.4% |
6.0% |
5.0% |
4.9% |
4.0% |
3.0% |
3.2% |
3.6% |
3.7% |
3.2% |
| Consensus Y/Y: |
6.6% |
6.2% |
6.0% |
5.2% |
5.0% |
4.1% |
3.1% |
3.3% |
3.6% |
3.6% |
3.3% |
3.1% |
|
|
|
|
|
|
|
|
|
|
|
|
|
| CPI Y/Y: |
6.5% |
6.4% |
6.0% |
5.0% |
4.9% |
4.0% |
3.0% |
3.2% |
3.7% |
3.7% |
3.2% |
3.1% |
| RATING |
|
|
|
|
|
|
|
|
|
|
|
|
| Month For: |
Dec 22 |
Jan-23 |
Feb-23 |
Mar-23 |
Apr-23 |
May-23 |
Jun-23 |
Jul-23 |
Aug-23 |
Sep-23 |
Oct-23 |
Nov-23 |
|
|
|
|
|
|
|
|
|
|
|
|
|
|
| |
|
|
Core Consumer Price Index - Excludes food and energy (At 8:30 a.m ET)
| SCHEDULE 2023 |
No 1 |
No 2 |
No 3 |
No 4 |
No 5 |
No 6 |
No 7 |
No 8 |
No 9 |
No 10 |
No 11 |
No 12 |
| Released Week: |
|
|
|
|
|
|
|
|
|
|
|
|
| Released Date: |
|
|
|
|
|
|
|
|
|
|
|
|
| Released Day: |
|
|
|
|
|
|
|
|
|
|
|
|
| Prior: |
0.2% |
0.3% |
0.4% |
0.5% |
0.4% |
0.4% |
0.4% |
0.2% |
0.2% |
0.3% |
0.3% |
0.2% |
| Prior Revised: |
... |
0.4% |
... |
... |
... |
... |
... |
... |
... |
... |
... |
... |
| Consensus M/M |
0.3% |
0.3% |
0.4% |
0.4% |
0.4% |
0.4% |
0.3% |
0.2% |
0.2% |
0.3% |
0.3% |
0.3% |
| Consensus Low: |
0.2% |
0.3% |
0.3% |
0.3% |
0.3% |
0.1% |
0.2% |
0.1% |
0.1% |
0.2% |
0.2% |
0.2% |
| Consensus High: |
0.4% |
0.4% |
0.5% |
0.4% |
0.4% |
0.4% |
0.4% |
0.4% |
0.3% |
0.3% |
0.3% |
0.3% |
| Core CPI M/M: |
0.3% |
0.4% |
0.5% |
0.4% |
0.4% |
0.4% |
0.2% |
0.2% |
0.3% |
0.3% |
0.2% |
0.3% |
|
|
|
|
|
|
|
|
|
|
|
|
|
| PriorY/Y: |
6.0% |
5.7% |
5.6% |
5.5% |
5.6% |
5.5% |
5.3% |
4.8% |
4.7% |
4.3% |
4.1% |
4.0% |
| Consensus Y/Y: |
5.7% |
5.5% |
5.5% |
5.6% |
5.5% |
5.3% |
5.0% |
4.8% |
4.3% |
4.1% |
4.1% |
4.0% |
|
|
|
|
|
|
|
|
|
|
|
|
|
| Core CPI Y/Y: |
5.7% |
5.6% |
5.5% |
5.6% |
5.5% |
5.3% |
4.8% |
4.7% |
4.3% |
4.1% |
4.0% |
4.0% |
| RATING: |
|
|
|
|
|
|
|
|
|
|
|
|
| Month For: |
Dec 22 |
Jan-23 |
Feb-23 |
Mar-23 |
Apr-23 |
May-23 |
Jun-23 |
Jul-23 |
Aug-23 |
Sep-23 |
Oct-23 |
Nov-23 |
|
|
|
|
|
|
|
|
|
|
|
|
|
|
|
| |
|
| |
|
|
|
|
|
|
|
|
|
|
|
Release Schedule | 2022 |
|
|
Consumer Price Index (CPI) | Inflation |
|
Today's Week |
|
|
|
|
|
|
|
|
|
|
|
|
|
Consumer Price Index CPI (At 8:30 a.m ET)
| SCHEDULE 2022 |
No 1 |
No 2 |
No 3 |
No 4 |
No 5 |
No 6 |
No 7 |
No 8 |
No 9 |
No 10 |
No 11 |
No 12 |
| Released Week: |
|
|
|
|
|
|
|
|
|
|
|
|
| Released Date: |
|
|
|
|
|
|
|
|
|
|
|
|
| Released Day: |
|
|
|
|
|
|
|
|
|
|
|
|
| Prior: |
0.8% |
0.5% |
0.6% |
0.8% |
1.2% |
0.3% |
1.0% |
1.3% |
0.0% |
0.1% |
0.4% |
0.4% |
| Prior Revised: |
... |
0.6% |
... |
... |
... |
... |
... |
... |
... |
... |
... |
... |
| CONSENSUS M/M |
0.4% |
0.5% |
0.7% |
1.1% |
0.2% |
0.7% |
1.1% |
0.2% |
-0.1% |
... |
0.7% |
0.3% |
| Consensus Low: |
0.2% |
0.3% |
0.5% |
0.6% |
0.1% |
0.6% |
0.9% |
0.0% |
-0.3% |
... |
0.5% |
0.2% |
| Consensus High: |
0.5% |
0.6% |
0.9% |
1.4% |
0.6% |
0.8% |
1.3% |
0.4% |
0.2% |
... |
0.8% |
0.5% |
| CPI M/M: |
0.5% |
0.6% |
0.8% |
1.2% |
0.3% |
1.0% |
1.3% |
0.0% |
0.1% |
0.4% |
0.4% |
0.1% |
|
|
|
|
|
|
|
|
|
|
|
|
|
| CONSENSUS Y/Y: |
7.1% |
7.3% |
7.9% |
8.4% |
8.1% |
8.2% |
8.8% |
8.7% |
8.1% |
... |
8.0% |
7.3% |
|
|
|
|
|
|
|
|
|
|
|
|
|
| CPI Y/Y: |
7.0% |
7.5% |
7.9% |
8.5% |
8.3% |
8.6% |
9.1% |
8.5% |
8.3% |
8.2% |
7.7% |
7.1% |
| RATING: |
|
|
|
|
|
|
|
|
|
|
|
|
| Month For: |
Dec 21 |
Jan-22 |
Feb-22 |
Mar-22 |
Apr-22 |
May-22 |
Jun-22 |
Jul-22 |
Aug-22 |
Sep-22 |
Oct-22 |
Nov-22 |
|
|
|
|
|
|
|
|
|
|
|
|
|
|
|
| |
|
| |
|
|
|
|
|
|
|
|
|
|
|
Release Schedule | 2021 |
|
|
Consumer Price Index (CPI) | Inflation |
|
Today's Week |
|
|
|
|
|
|
|
|
|
|
|
|
|
Consumer Price Index CPI (At 8:30 a.m ET)
| SCHEDULE 2021 |
No 1 |
No 2 |
No 3 |
No 4 |
No 5 |
No 6 |
No 7 |
No 8 |
No 9 |
No 10 |
No 11 |
No 12 |
| Released Week: |
|
|
|
|
|
|
|
|
|
|
|
|
| Released Date: |
|
|
|
|
|
|
|
|
|
|
|
|
| Released Day: |
|
|
|
|
|
|
|
|
|
|
|
|
| Prior: |
-0.3% |
0.4% |
0.3% |
0.4% |
0.6% |
0.8% |
0.5% |
0.5% |
0.5% |
0.3% |
0.4% |
0.9% |
| Prior Revised: |
... |
0.2% |
... |
... |
... |
... |
... |
... |
... |
... |
... |
... |
| CONSENSUS: |
1.5% |
0.3% |
0.4% |
0.5% |
0.2% |
0.4% |
0.5% |
0.5% |
0.4% |
0.3% |
0.5% |
... |
| Consensus Low: |
-0.1% |
0.1% |
0.1% |
0.4% |
0.1% |
0.3% |
0.4% |
0.3% |
0.3% |
0.3% |
0.4% |
... |
| Consensus High: |
0.3% |
0.4% |
0.6% |
0.6% |
0.5% |
0.6% |
0.6% |
0.7% |
0.5% |
0.5% |
0.7% |
... |
| CPI M/M: |
0.4% |
0.3% |
0.4% |
0.6% |
0.8% |
0.5% |
0.9% |
0.5% |
0.3% |
0.4% |
0.9% |
0.8% |
|
|
|
|
|
|
|
|
|
|
|
|
|
| CPI Y/Y: |
1.6% |
1.4% |
1.7% |
2.6% |
4.2% |
5.0% |
5.4% |
5.4% |
5.3% |
5.4% |
6.2% |
6.8% |
| RATING |
|
|
|
|
|
|
|
|
|
|
|
|
| Month For: |
Dec 20 |
Jan-21 |
Feb-21 |
Mar-21 |
Apr-21 |
May-21 |
Jun-21 |
Jul-21 |
Aug-21 |
Sep-21 |
Oct-21 |
Nov-21 |
|
|
|
|
|
|
|
|
|
|
|
|
|
|
|
| Note: CPI takes Year over Year into main consideration. On the other hand, PPI takes month over month for reporting purposes. |
|
|
| |
|
|
|
|
|
|
|
|
|
|
|
|
|
|
|
|
|
|
|
|
|
Brief News | 2025 |
|
|
Consumer Price Index (CPI) | Inflation |
|
Today's Week |
|
|
|
|
|
|
|
|
|
|
|
|
|
Consumer Price Index CPI (At 8:30 a.m ET)
| DATE/WEEK |
HIGHLIGHTS |
FOR |
CPI Y/Y |
|
Consumer Price Index CPI |
No 12 |
... |
|
Nov-2025 |
|
| |
|
|
|
Consumer Price Index CPI |
No 11 |
... |
|
Oct-2025 |
|
| |
|
|
|
Consumer Price Index CPI |
No 10 |
... |
|
Sep-2025 |
|
| |
|
|
|
Prices consumers pay for a variety of goods and services moved higher than expected in August while jobless claims accelerated, providing challenging economic signals for the Federal Reserve before its meeting next week. The consumer price index posted a seasonally adjusted 0.4% increase for the month, double the prior month, putting the annual inflation rate at 2.9%. Economists surveyed by Dow Jones had been looking for respective readings of 0.3% and 2.9%. For the vital core reading that excludes food and energy, the August gain was 0.3%, putting the 12-month figure at 3.1%, both as forecast. Fed officials consider core to be a better gauge of long-run trends. |
No 9 |
2.9% |
|
Aug-2025 |
|
| |
|
|
|
Consumer prices rise 2.7% annually in July, less than expected amid tariff worries The consumer price index increased a seasonally adjusted 0.2% for the month and 2.7% on a 12-month basis, the Bureau of Labor Statistics reported Tuesday. Excluding food and energy, the core CPI increased 0.3% for the month and 3.1% from a year ago, compared with the forecasts for 0.3% and 3%. Following the report, traders ramped up bets that the Federal Reserve would start reducing rates again in September. |
No 8 |
2.70% |
|
Jul-2025 |
|
| |
|
|
|
The consumer price index rose 2.7% on an annual basis in June 2025, up from 2.4% in May, according to the Bureau of Labor Statistics. However, the full impact of President Donald Trump’s tariffs is still to come, according to economists. The annual inflation rate ticked higher in June, in line with expectations, as lower prices at the gasoline pump somewhat offset higher prices at the grocery store. |
No 7 |
2.70% |
|
Jun-2025 |
|
| |
|
|
|
The consumer price index increased 0.1% for the month, putting the annual inflation rate at 2.4%.. Consumer prices rose less than expected in May as President Donald Trump’s tariffs had yet to show significant impact on inflation, the Bureau of Labor Statistics reported Wednesday.The consumer price index, a broad-based measure of goods and services across the sprawling U.S. economy, increased 0.1% for the month, putting the annual inflation rate at 2.4%. Economists surveyed by Dow Jones had been looking for respective readings of 0.2% and 2.4%. |
No 6 |
2.4% |
|
May-2025 |
|
| |
|
|
|
Annual inflation rate hit 2.3% in April, less than expected and lowest since 2021.Inflation was slightly lower than expected in April as President Donald Trump’s tariffs just began hitting the slowing U.S. economy, according to a Labor Department report Tuesday. The consumer price index, which measures the costs for a broad range of goods and services, rose a seasonally adjusted 0.2% for the month, putting the 12-month inflation rate at 2.3%, its lowest since February 2021, the Bureau of Labor Statistics said. The monthly reading was in line with the Dow Jones consensus estimate while the 12-month was a bit below the forecast for 2.4%. Excluding volatile food and energy prices, the core CPI also increased 0.2% for the month, while the year-over-year level was 2.8%. The forecast was for 0.3% and 2.8%, respectively. |
No 5 |
2.3% |
|
Apr-2025 |
|
| |
|
|
|
Consumer Price Index CPI |
No 4 |
2.4% |
|
Mar-2025 |
|
| |
|
|
|
Consumer Price Index CPI |
No 3 |
2.8% |
|
Feb-2025 |
|
| |
|
|
|
Consumer prices rise 0.5% in January, higher than expected as annual rate rises to 3%. The CPI accelerated a seasonally adjusted 0.5% for the month, putting the annual inflation rate at 3%, both higher than expected. The core CPI ran at 0.4% and 3.3% respectively, also above forecast. Shelter costs continued to be a problem for inflation, rising 0.4% on the month. Food prices jumped 0.4% and energy prices climbed 1.1% as gasoline prices increased 1.8%. Markets largely expect the Fed to stay on hold for an extended time and pushed the next rate cut probability out to September following the CPI report. Inflation perked up more than anticipated in January, providing further incentive for the Federal Reserve to hold the line on interest rates.The consumer price index, a broad measure of costs in goods and services across the U.S. economy, accelerated a seasonally adjusted 0.5% for the month, putting the annual inflation rate at 3%, the Bureau of Labor Statistics reported Wednesday. They were higher than the respective Dow Jones estimates for 0.3% and 2.9%. The annual rate was 0.1 percentage point higher than December. |
No 2 |
3.0% |
|
Jan-2025 |
|
| |
|
|
|
The consumer price index increased a seasonally adjusted 0.4% on the month, putting the 12-month inflation rate at 2.9%. The annual number was in line with forecasts. Core CPI annual rate was 3.2%, a notch down from the month before and slightly better than the 3.3% outlook. The consumer price index increased a seasonally adjusted 0.4% on the month, putting the 12-month inflation rate at 2.9%, the Bureau of Labor Statistics reported Wednesday. Economists surveyed by Dow Jones had been looking for respective readings of 0.3% and 2.9%. Core CPI rises less than expected year over year. Core inflation unexpectedly slowed in December, giving investors hope of Federal Reserve rate cuts later this year. The so-called core consumer price index, which strips out volatile food and energy prices, rose 3.2% in December year over year. Economists polled by Dow Jones expected a gain of 3.3%. Overall CPI increased 2.9% year on year, in line with expectations. |
CNo 1 |
2.9% |
|
Dec-2024 |
|
| |
|
|
|
|
|
|
|
|
|
| |
|
|
|
|
|
| |
|
|
|
|
|
|
|
|
|
|
|
|
|
|
|
Brief News | 2024 |
|
|
Consumer Price Index (CPI) | Inflation |
|
Today's Week |
|
|
|
|
|
|
|
|
|
|
|
|
|
Consumer Price Index CPI (At 8:30 a.m ET)
| DATE/WEEK |
HIGHLIGHTS |
FOR |
CPI Y/Y |
|
The consumer price index showed a 12-month inflation rate of 2.7% after increasing 0.3% on the month, the Bureau of Labor Statistics reported Wednesday. The annual rate was 0.1 percentage point higher than October. Excluding food and energy costs, the core CPI was at 3.3% on an annual basis and 0.3% monthly. The 12-month core reading was unchanged from a month ago. Annual inflation rate accelerates to 2.7% in November, as expected. The consumer price index showed a 12-month inflation rate of 2.7% after increasing 0.3% on the month. Excluding food and energy costs, the core CPI was at 3.3% on an annual basis and 0.3% monthly. All of the figures were in line with forecasts. The report further solidified the market outlook for a cut, with traders raising the odds to 99%, according to the CME Group’s FedWatch measure. |
No 12 |
2.7% |
|
Nov-2024 |
|
| |
|
|
|
Annual inflation rate hit 2.6% in October, meeting expectations. The consumer price index increased 0.2% in October, taking the 12-month inflation rate up to 2.6%. Both numbers were in line with expectations. The core CPI accelerated 0.3% for the month and was at 3.3% annually, also meeting forecasts. Despite signs of inflation moderating elsewhere, shelter prices continued to be a major contributor to the CPI move. Inflation-adjusted average hourly earnings for workers increased 0.1% for the month and 1.4% from a year ago. |
No 11 |
2.6% |
|
Oct-2024 |
|
| |
|
|
|
The consumer price index increased a seasonally adjusted 0.2% for the month, putting the annual inflation rate at 2.4%. Both were 0.1 percentage point higher than forecast. Excluding food and energy, core prices rose 0.3% on the month, putting the annual rate at 3.3%. Both core readings also were 0.1 percentage point above forecast. The consumer price index, a broad gauge measuring the costs of goods and services across the U.S. economy, increased a seasonally adjusted 0.2% for the month, putting the annual inflation rate at 2.4%. Both readings were 0.1 percentage point above the Dow Jones consensus. The annual inflation rate was 0.1 percentage point lower than August and is the lowest since February 2021. Excluding food and energy, core prices increased 0.3% on the month, putting the annual rate at 3.3%. Both core readings also were 0.1 percentage point above forecast. |
No 10 |
2.4% |
|
Sep-2024 |
|
| |
|
|
|
Consumer prices rose 0.2% in August as annual inflation rate hits lowest since early 2021. The CPI, a broad measure of goods and services costs across the U.S. economy, increased 0.2% in August, in line with the Dow Jones consensus. That put the 12-month inflation rate at 2.5%, down 0.4 percentage point from the July level and the lowest since February 2021. Traders priced in an 85% chance that the Fed will approve a quarter percentage point, or 25 basis point, interest rate reduction when its meeting concludes Sept. 18. Real earnings also rose for the month, with average hourly earnings outpacing the monthly CPI increase by 0.2%. |
No 9 |
2.5% |
|
Aug-2024 |
|
| |
|
|
|
US annual consumer price increase slows to below 3% as inflation ebbs. Consumer price index increases 0.2% in July. CPI rises 2.9% year-on-year, smallest gain since 2021. Core CPI advances 0.2%; up 3.2% year-on-year. U.S. consumer prices rose moderately in July and the annual increase in inflation slowed to below 3% for the first time in nearly 3-1/2 years, opening the door wider for the Federal Reserve to cut interest rates next month. The report from the Labor Department on Wednesday marked the third straight month of tame consumer price readings and added to a mild rise in producer prices last month in suggesting that inflation was firmly back on a downward trend. Ebbing inflation aligns with anecdotes from businesses that consumers are pushing back against high prices, through bargain hunting, cutting back on purchases and trading down to lower-priced substitutes. |
No 8 |
2.9% |
|
Jul-2024 |
|
| |
|
|
|
Inflation falls 0.1% in June from prior month, helping case for lower rates. The CPI, a broad measure of costs for goods and services, declined 0.1% from May, putting the 12-month rate at 3%, around its lowest level in more than three years. Excluding volatile food and energy costs, the so-called core CPI increased 0.1% monthly and 3.3% from a year ago. The annual increase for the core rate was the smallest since April 2021. A 3.8% slide in gasoline prices held back inflation for the month, offsetting 0.2% increases in both food prices and shelter. The consumer price index, a broad measure of costs for goods and services across the U.S. economy, declined 0.1% from May, putting the 12-month rate at 3%, around its lowest level in more than three years, the Labor Department reported Thursday. The all-items index rate fell from 3.3% in May, when it was flat on a monthly basis. |
No 7 |
3.0% |
|
Jun-2024 |
|
| |
|
|
|
The consumer price index, a key inflation gauge, rose 3.3% in May from a year ago, the U.S. Labor Department reported Wednesday. That’s down from 3.4% in April. Inflation fell slightly in May, as positive trends such as lower gasoline prices were counteracted by others including stubbornly high costs for housing. Trends under the surface suggest the fight against inflation continues to bear fruit, albeit slowly, economists said. Inflation pulled back in May 2024. The consumer price index declined to a 3.3% annual rate, down from 3.4% in April. Prices have eased for consumer staples such as gasoline and groceries. Housing inflation has been stubbornly high, though it’s falling slowly. The CPI data is likely welcome news for Federal Reserve officials, who may see it as evidence they can soon cut interest rates. |
No 6 |
3.3% |
|
May-2024 |
|
| |
|
|
|
CPI report shows inflation easing in April, with consumer prices still rising 3.4% from a year ago. The CPI report showed an increase of 0.3% from March. Inflation eased slightly in April, providing some relief for consumers. On a 12-month basis, however, the CPI increased 3.4%, in line with expectations. Core inflation was at 3.6%, the lowest reading ex-food and energy since April 2021.The consumer price index, a broad measure of how much goods and services cost at the cash register, increased 0.3% from March, the Labor Department’s Bureau of Labor Statistics reported Wednesday. That was slightly below the Dow Jones estimate for 0.4%. |
No 5 |
3.4% |
|
Apr-2024 |
|
| |
|
|
|
The consumer price index increased 0.4% in March, the Labor Department reported last week in data that also was higher than the Wall Street outlook. That means consumers more than kept up with the pace of inflation, which ran at a 3.5% annual rate for the month, below the 4% retail sales increase. |
No 4 |
3.5% |
|
Mar-2024 |
|
| |
|
|
|
Inflation pressures remained persistent in February, as prices for shelter and gas rose, according to the latest data from the Bureau of Labor Statistics released Tuesday morning. The Consumer Price Index (CPI) showed prices rose 0.4% over the previous month and 3.2% over the prior year in February, more than forecast and an acceleration from January's 0.3% monthly increase and 3.1% annual gain. This marked the largest monthly increase since September. On a "core" basis, which strips out the more volatile costs of food and gas, prices in February climbed 0.4% over the prior month and 3.8% over last year. Both measures were higher than economist expectations of a 0.3% monthly increase and a 3.7% annual gain. The consumer price index, a broad measure of goods and services costs, increased 0.4% for the month and 3.2% from a year ago. The monthly measure was in line with expectations while the 12-month reading was slightly higher. |
No 3 |
3.2% |
|
Feb-2024 |
|
| |
|
|
|
U.S. consumer prices increased more than expected in January amid rises in the costs of shelter and healthcare, but the pick-up in inflation likely does not change expectations that the Federal Reserve will start cutting interest rates in the first half of this year. The consumer price index (CPI) increased 0.3% last month after gaining 0.2% in December, the Labor Department's Bureau of Labor Statistics said on Tuesday. Annual revisions to the CPI data published last Friday were mixed, but generally showed inflation was on a downward trend after surging in 2022. In the 12 months through January, the CPI increased 3.1%. That followed a 3.4% advance in December. Economists polled by Reuters had forecast the CPI gaining 0.2% on the month and rising 2.9% year-on-year. The annual increase in consumer prices has moderated from a peak of 9.1% in June 2022. |
No 2 |
3.1% |
|
Jan-2024 |
|
| |
|
|
|
Consumer prices rose 0.3% in December, higher than expected, pushing the annual rate to 3.4%. The prices consumers pay for goods and services rose 0.3% in December and were up 3.4% on the year. That was higher than Wall Street expectations and still a good deal away from the Fed’s 2% inflation target. The consumer price index increased 0.3% in December and 3.4% from a year ago, compared with respective estimates of 0.2% and 3.2 Excluding volatile food and energy prices, the so-called core CPI also rose 0.3% for the month and 3.9% from a year ago, compared with respective estimates of 0.3% and 3.8%. Much of the increase came due to rising shelter costs. The category rose 0.5% for the month and accounted for more than half the core CPI increase. Wages adjusted for inflation posted a 0.2% gain on the month, while rising a modest 0.8% from a year ago. |
No 1 |
3.4% |
|
Dec-2023 |
|
| |
|
|
|
|
|
|
|
|
|
| |
|
|
|
|
|
| |
|
|
|
|
|
|
|
|
|
|
|
|
|
|
|
Brief News | 2023 |
|
|
Consumer Price Index (CPI) | Inflation |
|
Today's Week |
|
|
|
|
|
|
|
|
|
|
|
|
|
Consumer Price Index CPI (At 8:30 a.m ET)
| DATE/WEEK |
HIGHLIGHTS |
FOR |
CPI Y/Y |
|
Inflation slowed to a 3.1% annual rate in November. The consumer price index, a closely watched inflation gauge, increased 0.1% in November, and was up 3.1% from a year ago. Excluding volatile food and energy prices, the core CPI increased 0.3% on the month and 4% from a year ago. A 2.3% decrease in energy prices helped keep inflation in check, as gasoline fell 6% and fuel oil was off 2.7%. Food prices increased 0.2%. |
No 12 |
3.1% |
|
Nov-2023 |
|
| |
|
|
|
Inflation was flat in October from the prior month, core CPI hits two-year low. The consumer price index was flat in October from the previous month but increased 3.2% from a year ago. Both were below Wall Street estimates, sparking a major rally on Wall Street. Excluding volatile food and energy prices, the core CPI rose 0.2% and 4%, against the forecast of 0.3% and 4.1%. The annual rate was the smallest increase since September 2021. The flat reading on the headline CPI came as energy prices declined 2.5% for the month, offsetting a 0.3% increase in the food index. Following the report, traders took any potential Fed rate hikes almost completely off the table, according to CME Group data. |
No 11 |
3.2% |
|
Oct-2023 |
|
| |
|
|
|
Consumer prices rose 0.4% in September, more than expected. The consumer price index increased 0.4% on the month and 3.7% from a year ago, above respective forecasts for 0.3% and 3.6%. Core CPI increased 0.3% on the month and 4.1% on a 12-month basis, both exactly in line with expectations. Shelter costs were the main factor in the inflation increase, accounting for more than half the rise in CPI. Real average hourly earnings fell 0.2% on the month but were up 0.5% from a year ago. |
No 10 |
3.7% |
|
Sep-2023 |
|
| |
|
|
|
The consumer-price index rose 0.6% from July, and 3.7% from a year earlier. The uptick was fueled by rising energy prices, while underlying price pressures stayed mostly mild. August core inflation, excluding food and energy, rose 0.3%, hotter than expected. The consumer price index rose 0.6% in August, its biggest monthly gain of 2023. The inflation gauge rose 3.7% from a year ago. The core CPI increased 0.3% and 4.3% respectively, against estimates for 0.2% and 4.3%. Fed officials focus more on core as it provides a better indication of where inflation is heading over the long term. Energy prices fed much of gain, rising 5.6% on the month, an increase that included a 10.6% surge in gasoline. The jump in headline inflation hit worker paychecks. Real average hourly earnings declined 0.5% for the month. |
No 9 |
3.7% |
|
Aug-2023 |
|
| |
|
|
|
July CPI report shows inflation gauge rose 3.2%, less than expected. The consumer price index rose 3.2% from a year ago in July, slightly below expectations. The core CPI ran at a 12-month rate of 4.7%, also below the estimate. Both measures were up 0.2% on the month. Almost all of the monthly inflation increase came from shelter costs, which rose 0.4% and were up 7.7% from a year ago. Real wages adjusted for inflation increased 0.3% on the month and were up 1.1% from a year ago. While inflation has come well off its 40-year highs of mid-2022, it is still considerably above the 2% level where the Federal Reserve would like it. |
No 8 |
3.2% |
|
Jul-2023 |
|
| |
|
|
|
Inflation rose just 0.2% in June, less than expected as consumers get a break from price increases. The consumer price index rose 0.2% in June and was up 3% from a year ago, the lowest level since March 2021. Excluding food and energy, core CPI increased 0.2% and 4.8%, respectively. Soft gains in food prices and declines in used vehicle and airline prices helped keep inflation down, while shelter prices continued to rise. Worker wages adjusted for inflation increased 1.2% from a year ago. |
No 7 |
3.0% |
|
Jun-2023 |
|
| |
|
|
|
The inflation rate cooled in May to its lowest annual rate in more than two years, likely taking pressure off the Federal Reserve to continue raising interest rates, the Labor Department reported Tuesday. The consumer price index, which measures changes in a multitude of goods and services, increased just 0.1% for the month, bringing the annual level down to 4% from 4.9% in April. That 12-month increase was the smallest since March 2021, when inflation was just beginning to rise to what would become the highest in 41 years. |
No 6 |
4.0% |
|
May-2023 |
|
| |
|
|
|
In a release Wednesday, the Labor Department said the consumer price index, a popular gauge of prices that consumers pay for a bevy of goods and services, increased 0.4% in April, equating to a 4.9% annual inflation rate. The latter number was the lowest reading since April 2021. inflation rate eases to 4.9% in April, less than expectations. The consumer price index rose 0.4% last month, pushed higher by rising shelter, used vehicle and gas prices. The increase was in line with Wall Street expectations. On an annual basis, the inflation rate was 4.9%, slightly less than the estimate and providing some hope that the trend is lower. For workers, real average hourly earnings, adjusted for inflation, rose 0.1% for the month but were still down 0.5% from a year ago. The consumer price index, which measures the cost of a broad swath of goods and services, increased 0.4% for the month, in line with the Dow Jones estimate, according to a Labor Department report Wednesday. However, that equated to an annual increase of 4.9%, slightly less than the 5% estimate and the lowest annual pace since April 2021. The annual rate was 5% in March. Excluding volatile food and energy categories, core CPI rose 0.4% monthly and 5.5% from a year ago, both in line with expectations. |
No 5 |
4.9% |
|
Apr-2023 |
|
| |
|
|
|
Inflation rises just 0.1% in March and 5% from a year ago as Fed rate hikes take hold. The consumer price index rose 0.1% in March and 5% from a year ago, below estimates. Excluding food and energy, the core CPI accelerated 0.4% and 5.6%, both as expected. Energy costs fell and food prices were flat. Used vehicle prices also declined. A 0.6% increase in shelter costs was the smallest gain since November, but still resulted in prices rising 8.2% on an annual basis. Inflation cooled in March as the Federal Reserve’s interest rate increases showed more impact, the Labor Department reported Wednesday. The consumer price index, a widely followed measure of the costs for goods and services in the U.S. economy, rose 0.1% for the month against a Dow Jones estimate for 0.2%, and 5% from a year ago versus the estimate of 5.1%. Excluding food and energy, the core CPI increased 0.4% and 5.6% on an annual basis, both as expected. |
No 4 |
5.0% |
|
Mar-2023 |
|
| |
|
|
|
Inflation gauge increased 0.4% in February, as expected and up 6% from a year ago. Inflation rose in February but was in line with expectations, likely keeping the Federal Reserve on track for another interest rate hike next week despite recent banking industry turmoil. The consumer price index increased 0.4% for the month, putting the annual inflation rate at 6%, the Labor Department reported Tuesday. Both readings were exactly in line with Dow Jones estimates. Excluding volatile food and energy prices, core CPI rose 0.5% in February and 5.5% on a 12-month basis. The monthly reading was slightly ahead of the 0.4% estimate, but the annual level was in line. |
No 3 |
6.0% |
|
Feb-2023 |
|
| |
|
|
|
Inflation rose 0.5% in January, more than expected and up 6.4% from a year ago. Inflation rose in January by 0.5% following a 0.1% increase in December, according to the consumer price index report released Tuesday. The CPI was up 6.4% from the same period in 2022. Both numbers were higher than expected Across-the-board increases in shelter, food and energy boosted the index after inflation had shown signs of receding in recent months “Super core” services inflation, which is key for the Fed and excludes food, energy and shelter, rose 0.2% for the month and was 4% higher than a year ago. The consumer price index, which measures a broad basket of common goods and services, rose 0.5% in January, which translated to an annual gain of 6.4%. Economists surveyed by Dow Jones had been looking for respective increases of 0.4% and 6.2%. Excluding volatile food and energy, the core CPI increased 0.4% monthly and 5.6% from a year ago, against respective estimates of 0.3% and 5.5% |
No 2 |
6.4% |
|
Jan-2023 |
|
| |
|
|
|
Consumer price index for December matches expectations. The consumer price index fell 0.1% in December, matching a Dow Jones estimate. That was the biggest monthly decline since April 2020. The so-called core CPI, which strips out volatile food and energy prices, also met expectations with a 0.3%. gain. On a year-over-year basis, the index rose 6.5%, still well above the Fed’s 2% inflation target.The CPI report came in in line with expectations. Economists expected the consumer price index to dip 0.1% for December but rise 6.5% year-over-year, compared to a 0.1% monthly gain in November and an annual pace of 7.1%, according to Dow Jones. |
No 1 |
6.5% |
|
Dec-2022 |
|
| |
|
|
|
|
|
|
|
|
|
| |
|
|
|
|
|
| |
|
|
|
|
|
|
|
|
|
|
|
|
|
|
|
Brief News | 2022 |
|
|
Consumer Price Index (CPI) | Inflation |
|
Today's Week |
|
|
|
|
|
|
|
|
|
|
|
|
|
Consumer Price Index CPI (At 8:30 a.m ET)
| DATE/WEEK |
HIGHLIGHTS |
FOR |
CPI Y/Y |
|
Consumer prices rose less than expected in November, up 7.1% from a year ago. The consumer price index rose just 0.1% from the previous month, and increased 7.1% from a year ago, compared with respective estimates of 0.3% and 7.3%. Core CPI rose 0.2% on the month and 6% on an annual basis, compared with respective estimates of 0.3% and 6.1%. Stocks roared higher following the report as investors look for signs that runaway inflation is ebbing. Inflation-adjusted average hourly earnings for workers rose 0.5% for the month, though they were still down 1.9% from a year ago. |
No 12 |
7.1% |
|
Nov-2022 |
|
| |
|
|
|
Consumer prices rose 0.4% in October, less than expected, as inflation eases. The consumer price index increased 0.4% for the month and 7.7% from a year ago, both lower than estimates. Excluding volatile food and energy costs, so-called core CPI increased 0.3% for the month and 6.3% on an annual basis, also lower than expectations. Prices declined for medical care services, used vehicles and apparel. Shelter costs posted their highest monthly gain since 1990. Markets soared on the report and Treasury yields tumbled. The consumer price index rose less than expected in October, an indication that while inflation is still a threat to the U.S. economy, pressures could be starting to cool. The index, a broad-based measure of goods and services costs, increased 0.4% for the month and 7.7% from a year ago, according to a Bureau of Labor Statistics release Thursday. Respective estimates from Dow Jones were for rises of 0.6% and 7.9%. Excluding volatile food and energy costs, so-called core CPI increased 0.3% for the month and 6.3% on an annual basis, compared with respective estimates of 0.5% and 6.5%. Markets reacted sharply to the report, with the Dow Jones Industrial Average up more than 1,000 points. Treasury yields fell sharply, with the policy-sensitive 2-year note tumbling 0.3 percentage point to 4.33%. |
No 11 |
7.7% |
|
Oct-2022 |
|
| |
|
|
|
Thursday marked the fifth largest intraday reversal from a low in the history of the S&P 500, and it was the fourth largest for the Nasdaq, according to SentimenTrader. The moves followed the release of the consumer price index, a key U.S. inflation reading that came in hotter than expected for the month of September. Initially, this weighed on markets as investors braced themselves for the Federal Reserve to continue with its aggressive rate-hiking plan. Later, however, they shrugged off those worries. Still, persistent inflation remains a problem for the Fed and for investors’ worries around the central bank’s policy tightening. |
No 10 |
8.2% |
|
Sep-2022 |
|
| |
|
|
|
The Dow sank more than 1,200 points Tuesday, or nearly 4%, while the S&P 500 lost 4.3%. The Nasdaq Composite dropped 5.2%. The market moves came after August’s consumer price index report showed headline inflation rose 0.1% on a monthly basis despite a drop in gas prices. The hot inflation report left questions over whether stocks could go back to their June lows or fall even further. It also spurred some fears that the Federal Reserve could potentially hike even higher than the 75 basis points markets are pricing in. Inflation rose 0.1% in August even with sharp drop in gas prices. The consumer price index increased 0.1% in August. Excluding food and energy, the inflation gauge rose 0.6%, both higher than expected. Costs were driven by increases in food, shelter and medical care services, offsetting a sharp decline in gasoline prices. Real average hourly earnings adjusted for inflation rose 0.2% for the month. However, they remained down 2.8% from a year ago. Inflation rose more than expected in August as rising shelter and food costs offset a drop in gas prices, the Bureau of Labor Statistics reported Tuesday. The consumer price index, which tracks a broad swath of goods and services, increased 0.1% for the month and 8.3% over the past year. Excluding volatile food and energy costs, CPI rose 0.6% from July and 6.3% from the same month in 2021. |
No 9 |
8.3% |
|
Aug-2022 |
|
| |
|
|
|
Consumer prices rose 8.5% in July, less than expected as inflation pressures ease a bit. The consumer price index rose 8.5% in July from a year ago, below expectations, due largely to slumping energy prices.Excluding volatile food and energy prices, so-called core CPI rose 5.9% annually and 0.3% monthly, compared with respective estimates of 6.1% and 0.5%. The report was good news for workers, who saw a 0.5% monthly increase in real wages. The sharp decline in yields came as data showed the consumer price index rose 8.5% in July from a year ago, lighter than a Dow Jones estimate of 8.7%. Prices were also unchanged from the previous month. Excluding volatile food and energy prices, so-called core CPI, rose 5.9% annually and 0.3% monthly, compared to respective estimates of 6.1% and 0.5%. The inflation report suggested to some that price pressures might have peaked, which could spark speculations that the Federal Reserve could conduct a smaller interest-rate hike next month. |
No 8 |
8.5% |
|
Jul-2022 |
|
| |
|
|
|
Inflation rose 9.1% in June, even more than expected, as consumer pressures intensify. The consumer price index increased 9.1% from a year ago in June, above the 8.8% Dow Jones estimate. Excluding food and energy, core CPI rose 5.9%, compared with the 5.7% estimate. Costs surged for gasoline, groceries, rent and dental care. Adjusted for inflation, workers’ hourly wages fell 1% during the month and are down 3.6% from a year ago. |
No 7 |
9.1% |
|
Jun-2022 |
|
| |
|
|
|
Inflation rose 8.6% in May, highest since 1981. The consumer price index rose 8.6% in May from a year ago, the highest increase since December 1981. Core inflation excluding food and energy rose 6%. Both were higher than expected. Surging food, gas and energy prices all contributed to the gain, with fuel oil up 106.7% over the past year. Shelter costs, which comprise about one-third of the CPI, rose at the fastest 12-month pace in 31 years. The rise in inflation meant workers lost more ground in May, with real wages declining 0.6% from April and 3% on a 12-month basis.The U.S. consumer price index, a closely watched inflation gauge, rose by 8.6% in May on a year-over-year basis, its fastest increase since 1981, the Bureau of Labor Statistics reported Friday. Economists polled by Dow Jones expected a gain of 8.3%. The so-called core CPI, which strips out volatile food and energy prices, rose 6%. That’s also above an estimate of 5.9%. “So much for the idea that inflation has peaked,” Bankrate chief financial analyst Greg McBride said. “Any hopes that the Fed can ease up on the pace of rate hikes after the June and July meetings now seems to be a longshot. Inflation continues to rear its ugly head and hopes for improvement have been dashed again.” Inflation has been surging all year, leading the Fed to raise rates in order to mitigate those pricing pressures. |
No 6 |
8.6% |
|
May-2022 |
|
| |
|
|
|
Inflation barreled ahead at 8.3% in April from a year ago, remaining near 40-year highs. The consumer price index accelerated 8.3% in April, more than the 8.1% estimate and near the highest level in more than 40 years. Core CPI, which excludes food and energy, also was higher than expected, rising 6.2%. Shelter costs, which comprise about one-third of the CPI, rose at their fastest pace since 1991. Inflation-adjusted earnings continued to decline for workers, falling 2.6% over the past year due to the surging cost of living. The consumer price index, a broad-based measure of prices for goods and services, increased 8.3% from a year ago, higher than the Dow Jones estimate for an 8.1% gain. That represented a slight ease from March’s peak but was still close to the highest level since the summer of 1982. Removing volatile food and energy prices, so-called core CPI still rose 6.2%, against expectations for a 6% gain, clouding hopes that inflation had peaked in March. The month-over-month gains also were higher than expectations — 0.3% on headline CPI versus the 0.2% estimate and a 0.6% increase for core, against the outlook for a 0.4% gain. |
No 5 |
8.3% |
|
Apr-2022 |
|
| |
|
|
|
U.S. stock-market futures jump as CPI data suggest inflation may be peaking. Stock futures jump after CPI report on hope inflation is peaking, Nasdaq-100 futures gain 1.6%. U.S. stock futures rose as the March 2022 consumer prices report showed inflation excluding volatile food and energy costs was slightly less than expected. A drop in rates helped boost stocks. Consumer prices for March 2022 increased 1.2% month-to-month and 8.5% annually, the Labor Department said on Tuesday. But traders were focusing on the core reading, which excludes food and energy prices. Core CPI in March 2022 increased 0.3%, below the consensus economist estimate from Dow Jones of 0.5%. Core prices on an annual basis were up 6.5%. The 10-year Treasury yield retreated from a three-year high following the report as traders were betting the core reading could mean inflation is showing signs of peaking. In the 12 months through March 2022, the CPI accelerated 8.5%. That was the largest year-on-year gain since December 1981 and followed a 7.9% jump in February 2022. It was the sixth straight month of annual CPI readings north of 6%. Economists expected the index to show that prices surged 8.4% in March from the previous year and 1.2% on a monthly basis. Despite the increases, markets reacted positively to the report. Stock market futures rose and government bond yields declined. The big news in the March report was that core price pressures finally appear to be moderating. Stocks give up earlier gains and turn negative as traders assess latest inflation data.. |
No 4 |
8.5% |
|
Mar-2022 |
|
| |
|
|
|
Inflation rose 7.9% in February 2022, as food and energy costs push prices to highest in more than 40 years. The consumer price index for February rose 7.9% from a year ago, the highest level since January 1982. Excluding food and energy, both of which moved sharply higher during the month, core inflation still rose 6.4%, in line with expectations but the highest since August 1982. Gas, groceries and shelter were the biggest contributors to the CPI gain. Auto prices eased. Worker paychecks fell further behind, as inflation-adjusted earnings fell 0.8% in February, contributing to a 2.6% decline over the past year.
Inflation grew worse in February amid the escalating crisis in Ukraine and price pressures that became more entrenched. On a month-over-month basis, the CPI gain was 0.8%. Economists surveyed by Dow Jones had expected headline inflation to increase 7.8% for the year and 0.7% for the month. |
No 3 |
7.9% |
|
feb-2022 |
|
| |
|
|
|
The consumer price index, which measures the costs of dozens of everyday consumer goods, rose 7.5% compared to a year ago, the Labor Department reported Thursday. That compared to Dow Jones estimates of 7.2% for the closely watched inflation gauge. It was the highest reading since February 1982. A key measure of inflation climbed to a near-40-year high last month. The consumer price index rose 7.5% in the 12 months ending January, not adjusted for seasonal swings, the Bureau of Labor Statistics said Thursday. It was the steepest annual price increase since February 1982. |
No 2 |
7.5% |
|
Jan-2022 |
|
| |
|
|
|
Stock futures moved slightly higher on Wednesday after a key inflation report showed a historic gain but largely matched expectations. The moves come after the December reading for the consumer price index, a gauge of prices across a broad spectrum of goods, showed a gain of 7% year over year. That is the biggest jump since 1982, but was in-line with expectations from economists surveyed by Dow Jones. The monthly increase was slightly hotter than expected. Fed officials are watching the inflation data closely and are widely expected to raise interest rates this year in an effort combat increasing prices and as the jobs picture approaches full employment. |
No 1 |
7.0% |
|
Dec-2021 |
|
| |
|
|
|
|
|
|
|
|
| |
|
|
|
|
|
| |
|
|
|
|
|
|
|
|
|
|
|
|
|
|
|
Brief News | 2021 |
|
|
Consumer Price Index (CPI) | Inflation |
|
Today's Week |
|
|
|
|
|
|
|
|
|
|
|
|
|
Consumer Price Index CPI (At 8:30 a.m ET)
| DATE/WEEK |
HIGHLIGHTS |
FOR |
CPI Y/Y |
|
The consumer price index, which measures the cost of a wide-ranging basket of goods and services, rose 0.8% for the month, good for a 6.8% pace on a year over year basis and the fastest rate since June 1982. Excluding food and energy prices, so-called core CPI was up 0.5% for the month and 4.9% from a year ago, which itself was the sharpest pickup since mid-1991. The Dow Jones estimate was for a 6.7% annual gain for headline CPI and 4.9% for core. |
No 12 |
6.8% |
|
Nov-2021 |
|
| |
|
|
|
Consumer prices increase 6.2 percent for the year ended October 2021. The Consumer Price Index for All Urban Consumers increased 6.2 percent from October 2020 to October 2021, the largest 12-month increase since the period ending November 1990. U.S. consumer prices jump 6.2% in October, the biggest inflation surge in more than 30 years. |
No 11 |
6.2% |
|
Oct-2021 |
|
| |
|
|
|
Consumer prices increased slightly more than expected in September as food and energy price increases offset declines in used cars, the Labor Department reported Wednesday. The consumer price index for all items rose 0.4% for the month, compared to the 0.3% Dow Jones estimate. On a year-over-year basis, prices increased 5.4% vs. the estimate for 5.3% and the highest since January 1991.However, excluding volatile food and energy prices, the CPI increased 0.2% on the month and 4% year over year, against respective estimates for 0.3% and 4%. |
No 10 |
|
|
Sep-2021 |
|
| |
|
|
|
Consumer prices post smaller-than-expected increase in August. Consumer prices in August rose 5.3% from a year ago and 0.3% from July, the Labor Department reported Tuesday. Both totals were slightly below market expectations, sending stock futures higher.Stripping out food and energy, the consumer price index was up just 0.1% for the month. |
No 9 |
5.3% |
|
Aug-2021 |
|
| |
|
|
|
Prices that Americans pay for everyday goods and services rose in July as pent-up demand for travel and restaurants kept inflation hot, but jumped about as much as economists had expected. The Labor Department reported Wednesday that its consumer price index rose 5.4% in July from a year earlier, in line with June’s figure and matching the largest jump since August 2008. The government said CPI increased 0.5% on a month-over-month basis, matching a consensus forecast from economists surveyed by Dow Jones. |
No 8 |
5.4% |
|
Jul-2021 |
|
| |
|
|
|
Inflation surged in June at its fastest pace in nearly 13 years amid a burst in used vehicle costs and price increases in food and energy, the Labor Department reported Tuesday. The consumer price index increased 5.4% from a year earlier, the largest jump since August 2008, just before the worst of the financial crisis. Economists surveyed by Dow Jones had been expecting a 5% gain. Stripping out volatile food and energy prices, the core CPI rose 4.5%, the sharpest move for that measure since September 1991 and well above the estimate of 3.8%. On a monthly basis, headline and core prices rose 0.9% against 0.5% estimates. |
No 7 |
5.4% |
|
Jun-2021 |
|
| |
|
|
|
Consumer prices for May accelerated at their fastest pace in nearly 13 years as inflation pressures continued to build in the U.S. economy, the Labor Department reported Thursday. The consumer price index, which represents a basket including food, energy, groceries, housing costs and sales across a spectrum of goods, rose 5% from a year earlier. Economists surveyed by Dow Jones had been expecting a gain of 4.7%. The reading represented the biggest CPI gain since the 5.3% increase in August 2008, just before the financial crisis sent the U.S. spiraling into the worst recession since the Great Depression. |
No 6 |
5.0% |
|
May-2021 |
|
| |
|
|
|
Inflation accelerated at its fastest pace in more than 12 years for April as the U.S. economic recovery kicked into gear and energy prices jumped higher, the Labor Department reported Wednesday. The Consumer Price Index, which measures a basket of goods as well as energy and housing costs, rose 4.2% from a year ago, compared to the Dow Jones estimate for a 3.6% increase. The monthly gain was 0.8%, against the expected 0.2%. Excluding volatile food and energy prices, the core CPI increased 3% from the same period in 2020 and 0.9% on a monthly basis. The respective estimates were 2.3% and 0.3%. The increase in the headline CPI rate was the fastest since September 2008. |
No 5 |
4.2% |
|
Apr-2021 |
|
| |
|
|
|
The Consumer Price Index for All Urban Consumers (CPI-U) increased 0.6 percent in March on a seasonally adjusted basis after rising 0.4 percent in February, the U.S. Bureau of Labor Statistics reported today. The March 1-month increase was the largest rise since a 0.6-percent increase in August 2012. Over the last 12 months, the all items index increased 2.6 percent before seasonal adjustment. |
No 4 |
2.6% |
|
Mar-2021 |
|
| |
|
|
|
The consumer price index is expected to show a moderate gain in inflation of 0.4% in February, or 0.1% when excluding food and energy. The market is closely watching the number, as debate swirls around whether a surge in the economy – boosted by fiscal stimulus – will lead to high inflation. The Federal Reserve and many Wall Street economists expect inflation to jump but just temporarily, due to base effects of last year’s low levels of inflation when the economy was shut down. Economists expect the consumer price index rose 0.4% in February, or up 1.7% from a year ago. It was 1.7% as expectation. |
No 3 |
1.7% |
|
Feb-2021 |
|
| |
|
|
|
CPI data show U.S. retail prices up 0.3% in January, unchanged at core.
U.S. consumer prices rose moderately in January 2021 and underlying inflation remained benign as the pandemic continues to be a drag on the labor market and services industry.
The Labor Department said on Wednesday its consumer price index increased 0.3% last month after climbing 0.4% in December 2020. In the 12 months through January 2021 the CPI rose 1.4% after a similar gain in December 2020. Economists polled by Reuters had forecast the CPI rising 0.3% and increasing 1.5% year-on-year. |
No 2 |
1.4% |
|
Jan- 2021 |
|
| |
|
|
|
Consumer inflation surges in December on higher gas prices, CPI finds. Prices of consumer goods and services — the cost of living — rose in December at the fastest clip since last summer as Americans paid more to fill up their gas tanks.
The consumer price index advanced 0.4% last month, the government said Wednesday, marking the largest gain since August.
Yet the pace of inflation over the past year was still quite low at 1.4%. The yearly rate increased from 1.2% in the prior month.
Before the pandemic began last spring, consumer inflation was running at a much higher 2.3% pace. |
No 1 |
1.6% |
|
Dec-2020 |
|
| |
|
|
|
|
|
|
|
|
| |
|
|
|
|
|
|
| |
|
|
|
|
|
|
|
|
|
|
|
|
|
|
|
|
|
|
|
|
|
Definitions | Explain |
|
|
Consumer Price Index (CPI) | Inflation |
|
Today's Week |
|
|
|
|
|
|
|
|
|
|
|
|
| |
|
|
|
|
| |
|
| CPI: Consumer Price Index |
How the CPI affects investors?
CPI is the most widely cited inflation indicator. The CPI affects nearly all Americans because of the many ways it is used. Following are major uses:
1. As an Economic Indicator
2. As a Deflator of other economic series.
3. As a means of adjusting US dollar values.
Is the CPI the best measure of inflation?
Inflation has been defined as a process of continuously rising prices or equivalently, of a continuously falling value of money. Various indexes have been devised to measure different aspects of inflation:
The "best" measure of inflation for a given application depends on the intended use of the data. The CPI is generally the best measure for adjusting payments to consumers when the intent is to allow consumers to purchase at today's prices, a market basket of goods and services equivalent to one that they could purchase in an earlier period.
The CPI is the broadest of three price gauges from the Labor Department because it includes goods and services. About 60% of the index covers prices consumers pay for services from medical visits to airline fares, movie tickets and rents.
Inflation Rate
A Consumer Price Index of 158 indicates 58% inflation
since 1982, the commonly quoted inflation rate of say 3% is actually the change in the Consumer Price Index from a year earlier.
By looking at the change in the index we can see that what cost an average of 9.9 cents in 1913 would cost us about $1.82 in 2003.
Is the CPI a cost-of-living index?
The CPI frequently is called a cost-of-living index, but it differs in important ways from a complete cost-of-living measure.
A cost-of-living index would measure changes over time in the amount that consumers need to spend to reach a certain utility level or standard of living.
Both the CPI and a cost-of-living index would reflect changes in the prices of goods and services, such as food and clothing, that are directly purchased in the marketplace; but a complete cost-of-living index would go beyond this role to also take into account changes in other governmental or environmental factors that affect consumers' well-being.
The annual (U.S.) cost of living
The inflation gauge most closely watched by the Fed, the Commerce Department's core personal consumption expenditures price index excluding food and energy
The Walmart Indicator
Walmart holds keys to inflation picture. Many see Walmart, the largest retailer in the United States, as a gauge for how American consumers are faring. Ninety percent of the U.S. population lives within 10 miles of a Walmart store. Walmart, the largest retailer and private employer in the U.S., will serve as a valuable tool in gauging inflation when it reports earnings Thursday. The retailer is a key indicator of how consumers are holding up, providing a sharper lens on household spending in comparison with the government's consumer price index, which showed that inflation eased slightly in April. Food and groceries remain top of mind for US consumers when it comes to spending their inflation-tinged dollars.
The 5 Year Breakeven Rate
The 5-Year, 5-Year Forward Inflation Expectation Rate (T5YIFR) measures expected inflation over the five-year period that begins five years from today. As of late March 2026, this rate hovered around 2.06%–2.13%. It is a key metric for long-term inflation expectations, derived from 5-year and 10-year TIPS and Treasury securities.
This rate (often called the 5y5y) indicates what market participants believe inflation will be, on average, in the five-year period starting five years from now. It serves as a measure of long-term inflation expectations and is often used by central banks, such as the ECB, to monitor market confidence in inflation targets.
Current 5-Year Forward Rate (T5YIFR) |
|
|
| |
|
|
|
|
|
|
|
|
|
|
|
|
|
|
|
|
|
|
|
|
|
Data | Source |
|
|
Consumer Price Index (CPI) | Inflation |
|
Today's Week |
|
|
|
|
|
|
|
|
|
|
|
|
| |
|
|
|
|
|
|
| DATA INFORMATION |
CONSUMER PRICE INDEX |
| SOURCE |
Bureau of Labor Statistics (BLS), U.S. Department of Labor
|
| WEB |
www.bls.gov |
| FREQUENCY |
Monthly |
| AVAILABILITY |
Mid-month |
| COVERAGE |
Data are for the previous month. Data for June are released in July. |
| REVISIONS |
No |
| IMPORTANCE |
Inflation - Very Important |
|
| |
|
|
|
|
|
|
|
|
|
|
|
|