|
 |
|
|
|
Week 32 -2012 | From Aug 06 to Aug 10, 2012 |
|
 |
|
|
|
|
|
|
| |
|
|
|
|
|
|
|
|
|
|
| |
Economic Data for Week 32-2012 | Global View | Week Rating
| DATE |
DAY |
REPORT/CATEGORY |
HIGHLIGHTS ON WEEK 32-2012 |
LAST |
|
Mon |
Non Reports for Our Global Vision |
There will be no Economic Reports released on Monday. |
|
|
|
No Reports |
|
|
|
Tue |
ICSC Goldman Sachs Index |
The ICSC Index was flat in the week ended Saturday from the week before on a seasonally adjusted, comparable-store basis, despite 12 states holding state sales tax holidays. |
|
|
 |
Sales and Inventories |
Consumers were not in much of a shopping mood during the first week of the August fiscal month. ICSC report notes that tax holidays in 12 states failed to spark much interest in back-to-school shopping. |
|
|
Tue |
Johnson Redbook |
The Johnson Redbook Index also showed seasonally adjusted sales for the period were up 2% from last year compared with a 1.7% targeted gain. |
|
|
|
Sales and Inventories |
Redbook said sales were helped by state tax holidays and associated extended store hours in many states and shoppers focused on summer clearance sales and began to look at freshly shelved back to school merchandise. |
|
|
Tue |
Consumer Credit |
Consumer credit posted its weakest growth in eight months in June as Americans reduced credit card debt, a potentially negative sign for an economy that has struggled to create jobs. |
|
|
|
Consumer |
Consumer credit grew by $6.46 billion in June, the Federal Reserve said on Tuesday. That was well below the $11 billion advance Wall Street economists had forecast. |
|
|
Wed |
MBA purchase Applications |
Mortgage applications decreased 1.8% from one week earlier, according to data from the MBA Weekly Mortgage Applications Survey for the week ending August 3, 2012. |
-1.8% W/W |
|
|
Real Estate |
The refinance share of mortgage activity was unchanged from last week at 81% of total applications. The adjustable-rate mortgage (ARM) share of activity decreased to 4.0% from the previous week. |
|
|
Wed |
Fixed Mortgage Rates |
Rates have remained in a narrow range between 3.34% and 3.5% for eight straight weeks. Looking to next week, we expect rates will remain in this holding pattern until markets receive more clarity about the future of the euro-zone economy. |
3.44% W/W |
|
|
Interest Rates |
The 30-year fixed mortgage rate on its Mortgage Marketplace moved up to 3.44% from 3.34% a week earlier, which was the lowest level since the Mortgage Marketplace launched in April 2008. |
|
|
Wed |
Productivity and Costs |
U.S. productivity rebounded in Q2-2012, posting a solid gain as companies generated more goods and services even though there was little change in the number of hours their employees worked. |
3.44% Q/Q |
|
|
Business Actvity |
The Labor Department said Wednesday that productivity rose 1.6% in the April-to-June period, a sharp contrast to the first quarter�s revised decline of 0.5%. Economists expected productivity to climb by 1.3%. |
|
|
Wed |
EIA Crude Oil Report |
Crude-oil futures reached their highest in more than two months, extending an advance into a fourth session as a weekly government report showed a larger-than-expected drop in U.S. supplies. |
-3.7M Barrels |
|
|
Commodity |
The Energy Information Administration reported a decline of 3.7 million barrels for crude in the week ended Aug. 3. That compared with expectations of a decline around 300,000 barrels. |
|
|
Thu |
Jobless/Initial Claims |
Jobless claims fell 6,000 to 361,000 in the week ended Aug. 4, according to the Labor Department. Economists had projected claims would rise to 370,000. |
361K |
|
|
Employment |
We do not expect that claims will move materially lower from here without a significant boost to business and consumer confidence |
|
|
Thu |
U.S. Trade Balance |
The U.S. trade deficit narrowed by 10.7% to $42.9 billion. This is the smallest trade gap since December 2010. The trade deficit in the U.S. shrank to $42.9 billion in June as imports dropped and exports climbed. Exports positive but imports negative. |
-42.9B |
|
|
Balance of Payments |
The nation�s trade deficit fell to $42.9 billion, down 10.7% from $48.0 billion in May. The one-month improvement in the deficit is the biggest since February and was much larger than expected. |
|
|
Thu |
Fixed Mortgage Rates |
|
3.59% |
|
|
Interest Rates |
|
|
|
Thu |
Wholesale Trade |
Wholesale Inventories contract -0.2% in June, instead of improving. Inventories at U.S. wholesalers unexpectedly dropped in June as distributors suffered the biggest decrease in sales in three years. |
-0.2% |
|
|
Sales and Inventories |
The 0.2% decline in stockpiles, the biggest since September, followed no change in May. Sales plunged 1.4 %, the most since March 2009. |
|
|
Thu |
EIA Natural Gas Report |
Natural gas in storage rose 24 bcf in the August 3 week to 3,241 bcf. An injection of 30 bcf was expected. |
24 bcf |
|
|
Commodity |
The US Energy Information Administration slightly trimmed its estimate for domestic natural gas production growth in 2012, but still expects output this year to be up 3.8% from 2011's record levels. |
|
|
Thu |
Fed Balance Sheet |
The U.S. Federal Reserve's balance sheet grew for a second straight week on its purchases of more federal government debt. |
$54.1B |
|
|
Government |
The Fed's balance sheet - a broad gauge of its lending to the financial system - stood at $2.839 trillion on August 8, up from $2.834 trillion on August 1. |
|
|
Thu |
M2 Money Supply |
|
$5.7B |
|
|
Money Supply |
|
|
|
Fri |
Fixed Mortgage Rates |
The 30-year fixed-rate mortgage average rose to 3.59% in the week ending Aug. 9 from 3.55% in the prior week. The 15-year fixed-rate mortgage ticked up to 2.84% from 2.83% |
3.59%
APR
|
|
|
Interest Rates |
The rate was 4.32% a year earlier, according to Freddie, a buyer of residential mortgages. Fixed mortgage rates inched up again this week following stronger-than-expected employment reports. |
|
|
Fri |
Import and Export Prices |
Import prices fell 0.6% in July for the fourth straight decline and the third straight sharp decline.�Oil Prices is a big factor to this decrease. |
-3.2%
Y/Y |
|
|
Inflation |
Exports increased 0.9% to a record $185 billion in June. There were big gains in exports of autos and consumer goods, eclipsing a drop in exports of civilian aircraft, typically a key source of strength in the data. |
|
|
Fri |
Treasury Budget |
The deficit for the first 10 months of the 2012 budget year, which ends Sept. 30, totaled $974 billion. That�s 11.5% less than the $1.1 trillion gap in the same period last year. Lowest July deficit since 2007. |
$-69.6B |
|
|
Government |
A slightly better economy has boosted income tax receipts, which have increased 6% so far this year. Corporate income tax receipts rose nearly 30% compared to a year ago. Spending has dipped 0.3%. |
|
|
|
|
|
|
|
|
|
|
|
|
|
|
|
|
|
|
|
|
|
|
|
|
|
|
| |
|
|
|
|
|
| |
|
|
|
|
|
| |
|
|
|
|
|
|
|
|
|
|
| |
|
| WEEK 32-2012 ENDING AUG. 10 |
Reports Commentary
The job market remains difficult as employers have pulled back from adding workers due to the European debt crisis and a stalemate in the U.S. over tax and spending policies. The unemployment rate ticked up to 8.3% in July. On an underlying basis, growth in both imports and exports has cooled significantly, which is hardly surprising given the state of the global economy.
Nevertheless, the data should be a boost for estimates of second-quarter growth in U.S. gross domestic product. The government only included a small narrowing of the trade gap in this estimate; the next estimate of GDP is due Aug. 29.
Meanwhile, U.S. imports fell 1.5% to $227.9 billion in June. All major categories declined except for automobiles; the biggest came in imports of industrial supplies and capital goods. Falling imports should be regarded as a worrisome signal about U.S. domestic demand.
The lion�s share of the improvement was due to a sharp decline in the cost of imported oil.
The petroleum deficit narrowed 9.1% in June to $22.5 billion, the lowest level since November 2010.
The value of U.S. crude-oil imports fell to $26.4 billion in June from $29.3 billion in May, as the price of a barrel of oil dropped to $100 from $108. The quantity of crude imports fell to 8.78 million barrels.
Despite the improvement in the overall trade gap, the U.S. trade deficit with China widened to $27.4 billion in June, up from $26.6 billion in the same month last year and $26.0 billion in May 2012.
As for the troubled euro area, the U.S. trade deficit narrowed to $7 billion from $8.7 billion in the same month last year. Year-to-date exports to the region were $100 billion, up only 2.8% from the same period last year.
The government said that wholesales prices firmed a bit in June on stronger food and auto prices |
|
| |
|
|
|
|
|
|
|
|
|
|
|
|
|
|
|
|
|
|
|
|
|
|
|
|
|
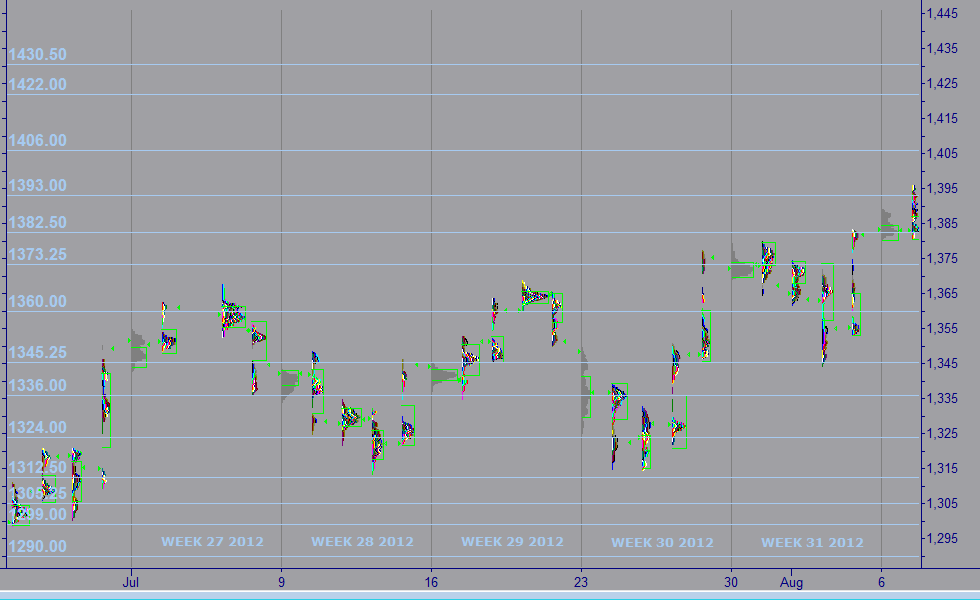
| MARKET PROFILE |
 |
WEEKS 2012 |
WEEK 32 |
% FROM CLOSE |
% FROM OPEN |
 |
RESISTANCE 1 |
1,330.25 |
1.39% |
1.35% |
|
RESISTANCE 2 |
1,326.25 |
1.08% |
1.04% |
 |
CLOSE MAR 02 |
1,350.00 |
|
|
|
OPEN MAR 04 |
1,255.00 |
0.04% |
|
 |
SUPPORT 1 |
1,289.00 |
0.66% |
0.62% |
|
SUPPORT 2 |
1,283.50 |
0.08% |
0.04% |
|
|
|
|
|
|
|
|
|
| |
|
|
|
|
|
| |
|
|
|
|
|
|
IMPORTANT NOTE: In an effort to comply with all applicable rules, regulations and disclosures please be so kind and read the "General Disclosure" below: |
| |
|
|
|
|
| GENERAL DISCLOSURE - TRADINGVESTING.COM |
- The material contained on our Website and Economic Calendar must be used at your own risk. Material is believed to be reliable, but we do not guarantee its accuracy or validity, nor is Tradingvesting.com responsible for any errors or omissions which may occur. The analysis and/or recommendations made by Tradingvesting.com do not provide, imply, or otherwise constitute a guarantee of performance. All contents and recommendations are based on data and sources believed to be reliable, but accuracy and completeness cannot be guaranteed. It should not be assumed that future results will be profitable or will equal past performance, real, indicated or implied.Tradingvesting.com website and material contained therein is not a solicitation to participate in the Futures/Stocks/Options Market. This Economic Calendar does not include Earning Releases, Announced Stock Splits, Upcoming Initial Public Offerings with Underwritings or Rating Changes. Tradingvesting.com has attempted to verify the information contained in this calendar. However, any aspect of such info may change without notice. Unless indicated otherwise: economic data is from the U.S and intraday data is at least 20 minutes delayed; all prices are in the local currency; Time is U.S. Eastern Time. Furthermore, there is a very high degree of risk involved in trading.Tradingvesting.com assumes no responsibilities for your trading and investment results, please red our Risk Disclosure.
- Tradingvesting.com does not provide investment advice, and does not represent that any of the information or related analysis is accurate or complete at any time. All information on this website are for educational purposes only and are not intended to provide financial advice. Any statements about profits or income, expressed or implied, do not represent a guarantee. Your actual trading may result in losses as no trading system is guaranteed. You accept full responsibilities for your actions, trades, profit or loss, and agree to hold Tradingvesting.com and any authorized distributors of this information harmless in any and all ways. We respect your right to privacy, please click here to view our privacy policy.
- U.S. Government Required Disclaimer - Commodity Futures Trading Commission.
Futures and options trading has large potential rewards, but also large potential risk. You must be aware of the risks and be willing to accept them in order to invest in the futures and options markets. Don't trade with money you can't afford to lose. This website is neither a solicitation nor an offer to Buy/Sell futures or options. No representation is being made that any account will or is likely to achieve profits or losses similar to those discussed on this website. The past performance of any trading system or methodology is not necessarily indicative of future results.
- CFTC rule 4.41:Hypothetical or simulated performance results have certain limitations. Unlike an actual performance record, simulated results do not represent actual trading. Also, since the trades have not been executed, the results may have under-or-over compensated for the impact, if any, of certain market factors, such as lack of liquidity. Simulated trading programs in general are also subject to the fact that they are designed with the benefit of hindsight. No representation is being made that any account will or is likely to achieve profit or losses similar to those shown.
- Risk Warning: Trading foreign exchange on margin carries a high level of risk, and may not be suitable for all investors. The high degree of leverage can work against you as well as for you. Before deciding to invest in foreign exchange you should carefully consider your investment objectives, level of experience, and risk appetite. The possibility exists that you could sustain a loss of some or all of your initial investment and therefore you should not invest money that you cannot afford to lose. You should be aware of all the risks associated with foreign exchange trading, and seek advice from an independent financial advisor if you have any doubts. Our linking to these sites does not constitute an endorsement of any products, services or the information found on them. Once you link to another site you are subject to the policies of the new site. By using this site, you agree to the Terms of Service, Privacy Policy and Risk Disclosure. Copyright � 2012 Tradingvesting, LLC. All rights reserved. If you have any questions regarding the Online Economic Calendar application, please contact us: click here.
THIS BRIEF STATEMENT CANNOT, OF COURSE, DISCLOSE ALL THE RISKS AND OTHER ASPECTS OF THE COMMODITY MARKETS AND EQUITY MARKETS. PLEASE READ MORE AT: TERMS OF SERVICE.
|
|
|
| |
|
|
|
|
|
| |
|
|
|
|
|