 |
 |
|
|
|
Week 06 -2012 | From Feb 06 to Feb 10, 2012 |
|
 |
|
|
|
|
|
|
| |
|
|
|
|
|
|
|
|
|
|
| |
Economic Data for Week 06-2012 | Global View | Week Rating
| Date |
Day |
Report/Category |
HIGHLIGHTS: WEEK 06-2012 |
Last |
|
Mon |
No Economic Data on tap for today |
|
N/A |
|
 |
No Economic Reports |
|
|
|
Tue |
ICSC Goldman Sachs Index |
Same-store sales jumped a weekly 1.8% in the February 4 week for a 3.5% year-over-year pace which lifts the 4-week average 2 tenths to 3.3%. |
1.80% W/W |
|
|
Sales and Inventories |
Unseasonably warm weather has hurt the sale of goods so far this winter but, according to ICSC-Goldman, is now helping sales of spring goods which are now appearing in stores. |
|
|
Tue |
Johnson Redbook |
Redbook's same-store sales index is at a year-on-year plus 2.5% which is also the same rate as the 4-week average. |
2.50% Y/Y |
|
|
Sales and Inventories |
Redbook has been trending at nearly one-year lows and notes that most stores in its sample are tracking slightly below trend. |
|
|
Tue |
Consumer Credit |
Consumer borrowing in the U.S. rose more than forecast in December, driven by demand for auto and student loans. |
$19.3B |
|
|
Consumer |
Credit increased by $19.3 billion to $2.5 trillion. The gain topped the $7 billion median forecast of economists surveyed by Bloomberg News and followed a $20.4 billion advance the prior month. |
|
|
Wed |
MBA purchase Applications |
Applications for home mortgages jumped last week, fueled by increased demand for refinancing as interest rates fell. |
7.50% W/W |
|
|
Real Estate |
The MBA said its seasonally adjusted index of mortgage application activity, which includes both refinancing and home purchase demand, rose 7.5% in the week ended Feb 3. |
|
|
Wed |
EIA Crude Oil Report |
US commercial crude inventories rose by 300,000 barrels last week, bringing the total US commercial crude inventory to 339.2 million barrels, around the upper limit of the five-year range. |
0.30M Barrels |
|
|
Commodity |
Light crude is down about $1 to the $98 area following today's report. Lower import levels and the decline in gasoline supplied indicate weaker US demand |
|
|
Thu |
Jobless/Initial Claims |
U.S. jobless claims fell by 15,000 to a seasonally adjusted 358,000 in the week ended Feb. 4. Continuing claims are reported with a one-week. Total claims are reported with a two-week lag |
358,000 Claims |
|
|
Employment |
Claims from two weeks ago were revised up by 6,000 to 373,000. The four-week average of claims, meanwhile, dropped by 11,000 to 366,250, the lowest level since April 2008. |
|
|
Thu |
Wholesale Trade |
Inventories at U.S. wholesalers grew 1.0% in December, suggesting the economy received a bigger boost than expected in the fourth quarter from companies restocking their shelves. |
1.0% M/M |
|
|
Sales and Inventories |
Inventories rose 1.0% in December, a strong build: 1.3% build in sales. The stock-to-sales ratio unchanged at 1.15. The gain pushed stockpiles to $473.9 billion, 22.5% above their 2009 lows. |
|
|
Thu |
EIA Natural Gas Report |
Natural gas in storage fell 78 billion cubic feet in the February 3 week to 2,888 bcf. A withdrawal of 90 bcf was expected. |
-78 bcf |
|
|
Commodity |
Chesapeake Energy Corp. told investors its production cuts are �actually higher� than the minimum of 500 million cubic feet per day it announced in January. |
|
|
Thu |
U.S. Fed Balance Sheet |
The Fed's balance sheet - a broad gauge of its lending to the financial system - stood at $2.911 trillion on Feb. 8, up from $2.907 trillion a week earlier on Feb. 1. |
|
|
|
Government |
The increase was led by a $4.3 billion rise in the value of central bank liquidity swaps with "other assets" gaining $3.4 billion. |
|
|
Thu |
M2 Money Supply |
U.S. M-2 money supply rose by $12.1 billion in the Jan. 30 week to $9,780.4 billion from $9,768.3 billion |
$4.5B W/W |
|
|
Money Supply |
The Fed said the four-week moving average of M-2 was $9,766.9 billion vs. $9,755.2 billion in the previous week. |
|
|
Fri |
Fixed Mortgage Rates |
Rate on 30-year-fixed mortgage holds at record low. Rates on 15-year fixed-rate mortgages averaged 3.16%, up from 3.14% last week and 4.29% a year ago. |
3.87%
APR
|
|
|
Interest Rates |
The 30-year fixed-rate mortgage averaged 3.87% for the week ending Feb. 9, the same record-low it hit a week ago. A year ago, that rate averaged 5.05%. |
|
|
Fri |
U.S. Trade Balance |
The overall trade deficit widened to $48.8 billion in December because imports grew at a faster pace than exports. It was the largest imbalance since June. |
$-48.8 Billions |
|
|
Balance of Payments |
In December, the U.S. trade deficit worsened. Trade deficit widens to $48.8 billion in December; exports to Europe rise after steep decline |
|
|
Fri |
Consumer Sentiment |
Confidence among U.S. consumers declined more than forecast in February as growing optimism about job prospects failed to ease concern wages will stagnate..
|
72.5
Level |
|
|
Consumer |
The preliminary consumer-sentiment gauge declined to 72.5 during February from a final reading of 75 in January, striking the highest result since February 2011 |
|
|
Fri |
Treasury Budget |
The deficit totaled $349 billion through January. That's $70 billion less than at the same point last year. January's monthly deficit was $27 billion, down from $50 billion in January 2011. |
$27.4 Billions |
|
|
Government |
The government ran an all-time record deficit of $1.41 trillion in fiscal 2009, and a $1.29 trillion imbalance in 2010. |
|
|
|
|
|
|
|
|
| |
|
|
|
|
|
|
|
|
|
|
|
|
| |
|
|
|
|
| |
|
|
|
|
 |
Glossary: |
 |
Current Week |
|
Chart View |
 |
Positive View |
 |
Negative View |
 |
Flat View |
 |
Non Available |
|
| |
|
|
|
|
| |
|
|
|
|
|
|
|
|
|
|
| |
|
| WEEK 06-2012 ENDING FEB. 10 |
Reports Commentary
Despite the fact that the groundhog predicted six more weeks of winter this past week retailers saw sales rise as abnormally warm weather across the county drove Spring-related items. Overall, for the week ending February 4, 2012, weekly retail sales rose sharply by 1.8%
Index climbed 1.8% in the week ended Saturday from the week before on a seasonally adjusted, comparable-store basis, rising for the second-straight week. ICSC noted last week was the warmest week for a comparable period in more than 20 years, which hurt the demand for some winter goods but may have gotten consumers thinking about spring fashion. On a year-on-year basis, the reading rose 3.5%.
An improving job market may be giving households the courage to take on more debt in order to sustain spending, which accounts for about 70% of the economy.
Non-revolving debt, including educational and auto loans increased by $16.6 billion in December, the biggest gain since November 2001.
Low mortgage rates are boosting demand for both purchases and refinancing with the 30-year fixed rate for conforming loans ($417,500 or less) down 4 basis points to 4.05%.
Oil inventories rose 0.3 million barrels to 339.2 million barrels. Weak demand made for another set of builds in petroleum inventories in the February 3 week.
The number of Americans applying for unemployment benefits fell again last week.
Initial claims are a good indicator of whether layoffs are rising or falling. They�ve declined sharply since last summer, meaning that more people are finding work or fewer are losing their jobs.
The four-week average of claims, meanwhile, fell by 11,000, to 366,250 to mark the lowest level since April 2008.
The monthly average smooths out seasonal quirks and provides a more accurate glimpse into labor-market trends, economists say. Hiring is generally viewed as improving when weekly claims drop below the 400,000 mark.
8.3% unemployment is painfully high. Nearly 13 million people remain unemployed. And one reason the unemployment rate has fallen for five straight months is that many people have stopped looking for work. The government only counts people as unemployed if they are actively searching for a job.
Stockpiles at the wholesale level account for about 27% of total business inventories. Stockpiles held by retailers make up about one-third of the total and manufacturing inventories represent about 41% of the total.
Companies tend to build their inventories when they expect stronger sales. Economists believe businesses will keep building inventories in 2012. But they expect the pace to slow from the fourth quarter growth.
The 30-year-fixed mortgage rate held the record low it hit a week ago, while average interest rates on the 15-year-fixed mortgage and other loan products inched higher in response to positive job-market news for January.
The economy gained 243,000 jobs last month, the largest monthly gain since April 2011, and the unemployment rate fell to 8.3%, which was the lowest since February 2009.
For the February 9 week, the Fed's balance sheet rose $3.3 billion after expanding $5.4 billion the week before.
The balance sheet of the U.S. Federal Reserve increased slightly over the last week as the central bank continued with a plan to adjust its portfolio and stimulate an economy it expects to grow only modestly this year.
benchmark crude prices rose by $1.13 to end at $99.84 per barrel in New York. Brent crude rose by $1.39 to finish $118.59 per barrel in London. Prices increased after Greece agreed on new spending cuts and other austerity measures that were necessary to receive an international bailout. The deal eased concerns of bank failures that could impact Europe�s economy and reduce petroleum demand.
Energy demand tends to rise as the economy creates jobs and more people enter the daily commute.
The shipping sector in coming months is expected to face a supply glut and glum economic outlook, including concerns over Chinese demand for raw materials, which will pressure earnings. Weather and other disruptions in Australia and Brazil last month together with slower restocking due to an earlier Lunar New Year holiday in China this year have hit cargo activity in recent weeks.�
Congress has shown little ability recently to make difficult changes to tax levels or spending programs to reduce the deficit. The federal deficit was lower through the first four months of the budget year than the same period last year. Still, the deficit is expected to top $1 trillion for the fourth year in a row, putting more pressure on Congress and President Barack Obama in an election year. |
|
| |
|
|
|
|
|
|
|
|
|
|
|
|
|
|
|
|
|
|
|
|
|
|
|
|
|
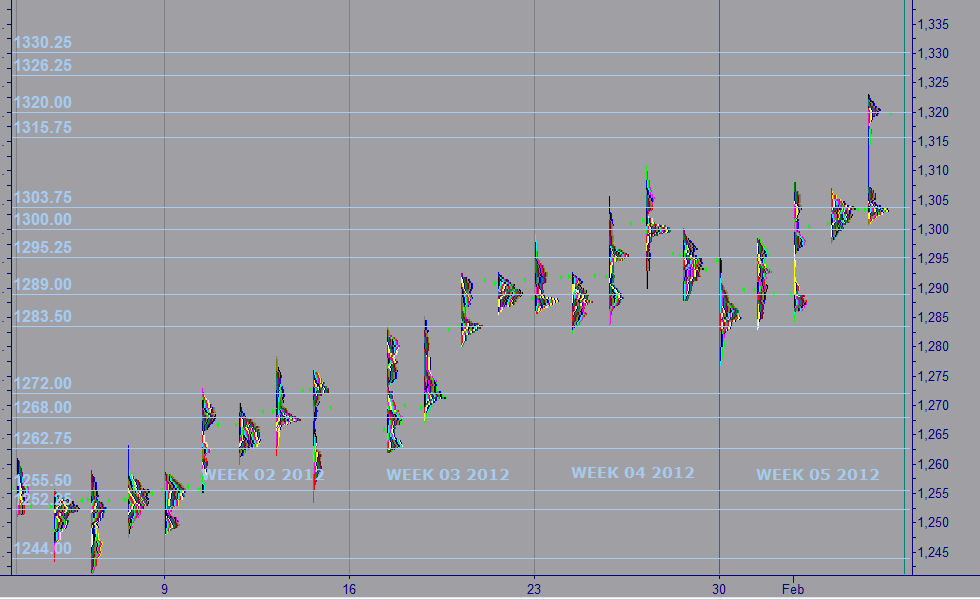
| MARKET PROFILE |
 |
WEEKS 2012 |
WEEK 06 |
% FROM CLOSE |
% FROM OPEN |
 |
RESISTANCE 1 |
1,330.25 |
0.78% |
1.14% |
|
RESISTANCE 2 |
1,326.25 |
0.47% |
0.82% |
|
CLOSE FEB 03 |
1,320.00 |
|
|
|
OPEN FEB 05 |
1,316.00 |
-0.30% |
|
 |
SUPPORT 1 |
1,303.75 |
-1.23% |
-0.98% |
|
SUPPORT 2 |
1,300.00 |
-1.52% |
-1.27% |
|
|
|
|
|
|
|
|
|
| |
|
|
|
|
|
| |
|
|
|
|
|
|
IMPORTANT NOTE: In an effort to comply with all applicable rules, regulations and disclosures please be so kind and read the "General Disclosure" below: |
| |
|
|
|
|
| GENERAL DISCLOSURE - TRADINGVESTING.COM |
- The material contained on our Website and Economic Calendar must be used at your own risk. Material is believed to be reliable, but we do not guarantee its accuracy or validity, nor is Tradingvesting.com responsible for any errors or omissions which may occur. The analysis and/or recommendations made by Tradingvesting.com do not provide, imply, or otherwise constitute a guarantee of performance. All contents and recommendations are based on data and sources believed to be reliable, but accuracy and completeness cannot be guaranteed. It should not be assumed that future results will be profitable or will equal past performance, real, indicated or implied.Tradingvesting.com website and material contained therein is not a solicitation to participate in the Futures/Stocks/Options Market. This Economic Calendar does not include Earning Releases, Announced Stock Splits, Upcoming Initial Public Offerings with Underwritings or Rating Changes. Tradingvesting.com has attempted to verify the information contained in this calendar. However, any aspect of such info may change without notice. Unless indicated otherwise: economic data is from the U.S and intraday data is at least 20 minutes delayed; all prices are in the local currency; Time is U.S. Eastern Time. Furthermore, there is a very high degree of risk involved in trading.Tradingvesting.com assumes no responsibilities for your trading and investment results, please red our Risk Disclosure.
- Tradingvesting.com does not provide investment advice, and does not represent that any of the information or related analysis is accurate or complete at any time. All information on this website are for educational purposes only and are not intended to provide financial advice. Any statements about profits or income, expressed or implied, do not represent a guarantee. Your actual trading may result in losses as no trading system is guaranteed. You accept full responsibilities for your actions, trades, profit or loss, and agree to hold Tradingvesting.com and any authorized distributors of this information harmless in any and all ways. We respect your right to privacy, please click here to view our privacy policy.
- U.S. Government Required Disclaimer - Commodity Futures Trading Commission.
Futures and options trading has large potential rewards, but also large potential risk. You must be aware of the risks and be willing to accept them in order to invest in the futures and options markets. Don't trade with money you can't afford to lose. This website is neither a solicitation nor an offer to Buy/Sell futures or options. No representation is being made that any account will or is likely to achieve profits or losses similar to those discussed on this website. The past performance of any trading system or methodology is not necessarily indicative of future results.
- CFTC rule 4.41:Hypothetical or simulated performance results have certain limitations. Unlike an actual performance record, simulated results do not represent actual trading. Also, since the trades have not been executed, the results may have under-or-over compensated for the impact, if any, of certain market factors, such as lack of liquidity. Simulated trading programs in general are also subject to the fact that they are designed with the benefit of hindsight. No representation is being made that any account will or is likely to achieve profit or losses similar to those shown.
- Risk Warning: Trading foreign exchange on margin carries a high level of risk, and may not be suitable for all investors. The high degree of leverage can work against you as well as for you. Before deciding to invest in foreign exchange you should carefully consider your investment objectives, level of experience, and risk appetite. The possibility exists that you could sustain a loss of some or all of your initial investment and therefore you should not invest money that you cannot afford to lose. You should be aware of all the risks associated with foreign exchange trading, and seek advice from an independent financial advisor if you have any doubts. Our linking to these sites does not constitute an endorsement of any products, services or the information found on them. Once you link to another site you are subject to the policies of the new site. By using this site, you agree to the Terms of Service, Privacy Policy and Risk Disclosure. Copyright � 2012 Tradingvesting, LLC. All rights reserved. If you have any questions regarding the Online Economic Calendar application, please contact us: click here.
THIS BRIEF STATEMENT CANNOT, OF COURSE, DISCLOSE ALL THE RISKS AND OTHER ASPECTS OF THE COMMODITY MARKETS AND EQUITY MARKETS. PLEASE READ MORE AT: TERMS OF SERVICE.
|
|
|
| |
|
|
|
|
|
| |
|
|
|
|
|