|
 |
|
|
|
Week 20 -2012 | From May 14 to May 18, 2012 |
|
 |
|
|
|
|
|
|
| |
|
|
|
|
|
|
|
|
|
|
| |
Economic Data for Week 20-2012 | Global View | Week Rating
| DATE |
DAY |
REPORT/CATEGORY |
HIGHLIGHTS ON WEEK 20-2012 |
Last |
|
Mon |
No Economic Data on Tap for Today |
|
N/A |
|
|
No Economic Reports |
|
|
|
Tue |
ICSC Goldman Sachs Index |
Store sales are mixed so far this month, based on ICSC-Goldman's same-store sales index where the week-on-week rate fell, down 0.8%, while the year-on-year rate rose sharply to plus 4.5%. |
-0.8% W/W |
|
 |
Sales and Inventories |
Despite the sales incentive with Mother's Day on Sunday weekly sales continued to slow this past week: ICSC/Goldman Sachs Chain Store Sales Off 0.8%. |
|
|
Tue |
Consumer Price Index |
A measure of the U.S. cost of living was unchanged in April, restrained by a drop in energy prices and supporting the view of some Federal Reserve policy makers that inflation will ease. |
0.0% |
|
|
Inflation |
U.S. Consumer-Price Index Unchanged; Core Rate Climbs 0.2%. The so-called core measure, which excludes more volatile food and energy costs, rose 0.2 % for a second month. |
|
|
Thu |
Retail Sales |
Retail sales slowed sharply in April but from a still strong March. Retail sales in April rose 0.1 %, following a 0.7 % increase the month before (originally up 0.8%). |
0.1%
M/M |
|
|
Sales and Inventories |
The bottom line is that sales held up decently in April after a robust March. The long term trend is good, but this week report is considered negative. |
|
|
Tue |
Empire State Mfg Survey |
Following is the text of the Empire State Manufacturing Index. The May Empire State Manufacturing Survey indicates that manufacturing activity expanded in New York State at a moderate pace. |
|
|
|
Manufacturing |
The general business conditions index rose eleven points to 17.1. The new orders index inched up to 8.3, and the shipments index shot up eighteen points to 24.1. |
|
|
Tue |
Johnson Redbook |
May's doing a little better so far than retailers expected according to Redbook where year-on-year same-store sales are at plus 3.7 % for the strongest rate in six weeks. |
3.7% Y/Y |
|
|
Sales and Inventories |
Despite the strength, Redbook still sees a month-to-month decline which is not a good indication for the government's May retail sales report. |
|
|
Tue |
Treasury Intal Capital |
China remains the largest foreign holder of US Treasury securities, a "safe haven" amid the eurozone crisis, but an ongoing decline in these holdings reflects the country's determination to diversify its foreign reserves. |
|
|
|
Balance of Payments |
China boosted its stockpile of the securities by $14.7 billion to $1.17 trillion in March, the US Treasury Department reported on Tuesday, widening the gap with second-place holder Japan, which cut its March holdings by 0.2% to $1.08 trillion. |
|
|
Thu |
Business Inventories |
Businesses in the U.S. rebuilt inventories in March at the slowest pace in four months as sales climbed, indicating orders to American factories will continue to increase |
|
|
|
Sales and Inventories |
Inventory swings will probably not play a big role in economic growth in coming quarters after stockpiles boosted the gain in fourth-quarter gross domestic product to the biggest in more than a year. |
|
|
Tue |
Housing Market Index |
The HMI index rose to 29 from 24 in April. The April index was initially reported to be 25. Economists polled by MarketWatch had expected a reading of 27. |
29 |
|
|
Real Estate |
Home builder sentiment improved in May to the highest reading since the recession on an upturn in sales and traffic, a trade group said Tuesday. |
|
|
Wed |
MBA purchase Applications |
The ICSC index rose a slight 0.2% from the prior week, while increasing just 1.4% over the prior-year period during the week ending June 30th, the weakest performance in over 2 years. |
9.2%
W/W
|
|
|
Real Estate |
Purchase applications remain flat, down 2.4 in the week with the four-week average up 1.8 %. These results point to little change for underlying home sales. |
|
|
Wed |
Housing Starts |
Housing starts rebounded 2.6% in April after declining 2.6% in March. The April pace of 0.717 million units posted higher than analysts' forecast for 0.690 million and is up 29.9% on a year-ago basis. |
717K |
|
|
Real Estate |
Housing permits declined in April but followed a surge in March. Permits declined 7.0%, following an 8.8% increase in March. Housing data numbers are on a modest uptrend. |
|
|
Wed |
Building Permits |
Housing permits declined in April but followed a surge in March. The April reading of 715K units came in marginally short of the consensus estimate of 725K. Weakness was seen in the multifamily component in April while the single-family component improved. |
715K |
|
|
Real Estate |
Permits declined 7.0%, following an 8.8% increase in March revised from 4.5%. �Housing data numbers are on a modest uptrend. |
|
|
Wed |
ADP Employment Report |
|
N/A |
|
|
Employment |
|
|
|
Wed |
Industrial Production |
Industrial production was better in April. While utilities played a key role, manufacturing made a nice rebound. Overall industrial production jumped 1.1%, following a decline of 0.6% in March. Market expectations were for a 0.5 % increase.� |
1.1% M/M |
|
|
Manufacturing |
Overall capacity utilization improved to 79.2 % from 78.4 % in March. The market forecast was for 79.0%.� |
|
|
Wed |
EIA Crude Oil Report |
|
N/A |
|
|
Commodity |
|
|
|
Wed |
FOMC Minutes Meeting #3 |
The latest FOMC minutes for the April 24-25 meeting indicated that there was at least incremental inclination for QE3 if the economy loses momentum. |
N/A |
|
|
Interest Rates |
The Fed still sees headwinds from Europe and a possible fiscal cliff. The staff continued to project that real GDP would accelerate gradually through 2014, supported by accommodative monetary policy. |
|
|
Thu |
Jobless/Initial Claims |
Initial claims are unchanged in the May 12 week at 370,000. The May 5 week, which is revised slightly upward, is also at 370,000 while the week before that, the April 28 week, is at 368,000. |
370,000 |
|
|
Employment |
It is the April 28 week that, after several prior weeks near 400,000, marks a return to the prior trend of 360,000 and 370,000 levels. |
|
|
Thu |
Philadelphia Fed Survey |
The regional manufacturing report from the Philly Fed points to contraction this month. The business activity index is negative, at minus 5.8 vs plus 8.5 in April. |
-5.8 |
|
|
Business Activity |
New orders are in the negative ground as is employment. Delivery times shortened dramatically to indicate slowing activity in the supply chain. Inventory accumulation slowed, unfilled orders contracted deeply, and optimism in the six-month outlook is down noticeably. |
|
|
Thu |
Leading Indicators |
LEI dipped 0.1 % during April 2012. The two biggest negatives in April are building permits, which offer a leading look at the housing sector, and initial jobless claims, which offer a leading look at the jobs market. Permits and claims were strong positives for this report through much of the first quarter. |
-0.1% |
|
|
Business Activity |
Consumer expectations are April's third biggest negative with weakness here pointing to weakness for consumer spending. |
|
|
Thu |
EIA Natural Gas Report |
|
N/A |
|
|
Commodity |
|
|
|
Thu |
Fed Balance Sheet |
|
N/A |
|
|
Government |
|
|
|
Thu |
M2 Money Supply |
|
N/A |
|
|
Money Supply |
|
|
|
Fri |
Fixed Mortgage Rates |
The average rate for conforming mortgages (under $417,500) fell five basis points to 3.79 % which is the lowest rate in the history of the survey. |
3.79%
APR
|
|
|
Interest Rates |
Rates for jumbo loans, FHA loans, as well as the 15-year rate are all at record lows. MBA attributes the drop in rates to safe-haven buying of US Treasuries tied to sovereign debt trouble in Europe. |
|
|
|
|
|
|
|
|
|
|
|
|
|
|
|
|
|
|
|
|
|
|
|
|
|
|
| |
|
|
|
|
|
| |
|
|
|
|
|
| |
|
|
|
|
|
|
|
|
|
|
| |
|
| WEEK 20-2012 ENDING MAY. 18 |
Reports Commentary
Factory orders fell in January in the typical pattern of declines in the first month of the quarter. Nevertheless, new orders have been on a rising trend since March 2009 although they remain below their pre-recession peak..
|
|
| |
|
|
|
|
|
|
|
|
|
|
|
|
|
|
|
|
|
|
|
|
|
|
|
|
|
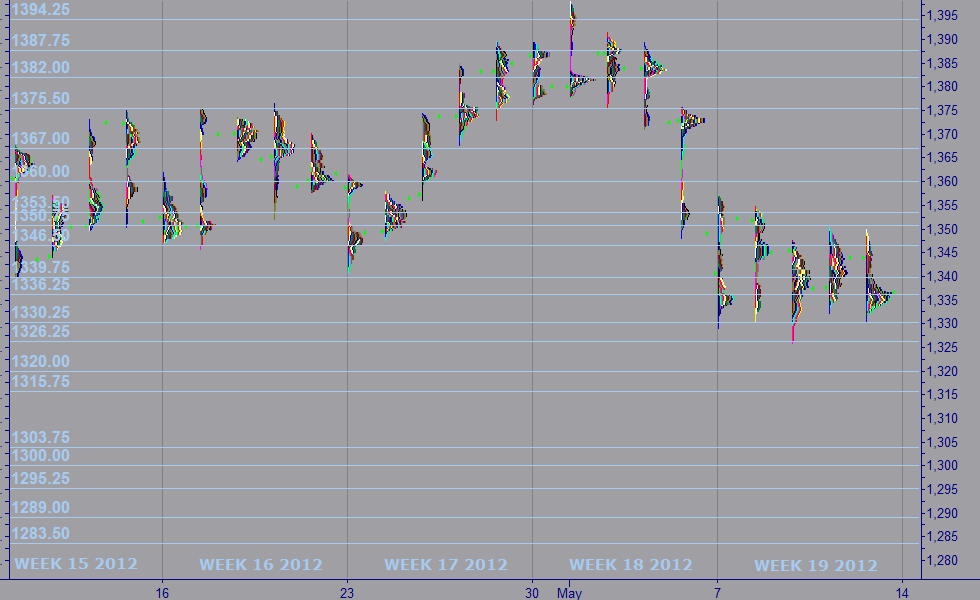
| MARKET PROFILE |
 |
WEEKS 2012 |
WEEK 20 |
% FROM CLOSE |
% FROM OPEN |
 |
RESISTANCE 1 |
1,330.25 |
1.39% |
1.35% |
|
RESISTANCE 2 |
1,326.25 |
1.08% |
1.04% |
 |
CLOSE MAR 02 |
1,350.00 |
|
|
|
OPEN MAR 04 |
1,255.00 |
0.04% |
|
 |
SUPPORT 1 |
1,289.00 |
0.66% |
0.62% |
|
SUPPORT 2 |
1,283.50 |
0.08% |
0.04% |
|
|
|
|
|
|
|
|
|
| |
|
|
|
|
|
| |
|
|
|
|
|
|
IMPORTANT NOTE: In an effort to comply with all applicable rules, regulations and disclosures please be so kind and read the "General Disclosure" below: |
| |
|
|
|
|
| GENERAL DISCLOSURE - TRADINGVESTING.COM |
- The material contained on our Website and Economic Calendar must be used at your own risk. Material is believed to be reliable, but we do not guarantee its accuracy or validity, nor is Tradingvesting.com responsible for any errors or omissions which may occur. The analysis and/or recommendations made by Tradingvesting.com do not provide, imply, or otherwise constitute a guarantee of performance. All contents and recommendations are based on data and sources believed to be reliable, but accuracy and completeness cannot be guaranteed. It should not be assumed that future results will be profitable or will equal past performance, real, indicated or implied.Tradingvesting.com website and material contained therein is not a solicitation to participate in the Futures/Stocks/Options Market. This Economic Calendar does not include Earning Releases, Announced Stock Splits, Upcoming Initial Public Offerings with Underwritings or Rating Changes. Tradingvesting.com has attempted to verify the information contained in this calendar. However, any aspect of such info may change without notice. Unless indicated otherwise: economic data is from the U.S and intraday data is at least 20 minutes delayed; all prices are in the local currency; Time is U.S. Eastern Time. Furthermore, there is a very high degree of risk involved in trading.Tradingvesting.com assumes no responsibilities for your trading and investment results, please red our Risk Disclosure.
- Tradingvesting.com does not provide investment advice, and does not represent that any of the information or related analysis is accurate or complete at any time. All information on this website are for educational purposes only and are not intended to provide financial advice. Any statements about profits or income, expressed or implied, do not represent a guarantee. Your actual trading may result in losses as no trading system is guaranteed. You accept full responsibilities for your actions, trades, profit or loss, and agree to hold Tradingvesting.com and any authorized distributors of this information harmless in any and all ways. We respect your right to privacy, please click here to view our privacy policy.
- U.S. Government Required Disclaimer - Commodity Futures Trading Commission.
Futures and options trading has large potential rewards, but also large potential risk. You must be aware of the risks and be willing to accept them in order to invest in the futures and options markets. Don't trade with money you can't afford to lose. This website is neither a solicitation nor an offer to Buy/Sell futures or options. No representation is being made that any account will or is likely to achieve profits or losses similar to those discussed on this website. The past performance of any trading system or methodology is not necessarily indicative of future results.
- CFTC rule 4.41:Hypothetical or simulated performance results have certain limitations. Unlike an actual performance record, simulated results do not represent actual trading. Also, since the trades have not been executed, the results may have under-or-over compensated for the impact, if any, of certain market factors, such as lack of liquidity. Simulated trading programs in general are also subject to the fact that they are designed with the benefit of hindsight. No representation is being made that any account will or is likely to achieve profit or losses similar to those shown.
- Risk Warning: Trading foreign exchange on margin carries a high level of risk, and may not be suitable for all investors. The high degree of leverage can work against you as well as for you. Before deciding to invest in foreign exchange you should carefully consider your investment objectives, level of experience, and risk appetite. The possibility exists that you could sustain a loss of some or all of your initial investment and therefore you should not invest money that you cannot afford to lose. You should be aware of all the risks associated with foreign exchange trading, and seek advice from an independent financial advisor if you have any doubts. Our linking to these sites does not constitute an endorsement of any products, services or the information found on them. Once you link to another site you are subject to the policies of the new site. By using this site, you agree to the Terms of Service, Privacy Policy and Risk Disclosure. Copyright � 2012 Tradingvesting, LLC. All rights reserved. If you have any questions regarding the Online Economic Calendar application, please contact us: click here.
THIS BRIEF STATEMENT CANNOT, OF COURSE, DISCLOSE ALL THE RISKS AND OTHER ASPECTS OF THE COMMODITY MARKETS AND EQUITY MARKETS. PLEASE READ MORE AT: TERMS OF SERVICE.
|
|
|
| |
|
|
|
|
|
| |
|
|
|
|
|