|
 |
|
 |
Empire State Mfg Index | Manufacturing |
|
 |
|
The Factory Orders report measures dollar volume of new orders, shipments, unfilled orders, and inventories reported by domestic manufacturers. Figures within the are reported in the billions of dollars.. Read More
|
|
|
|
|
|
|
| |
|
| |
 5. Empire State Mafg Index (5 of 9)
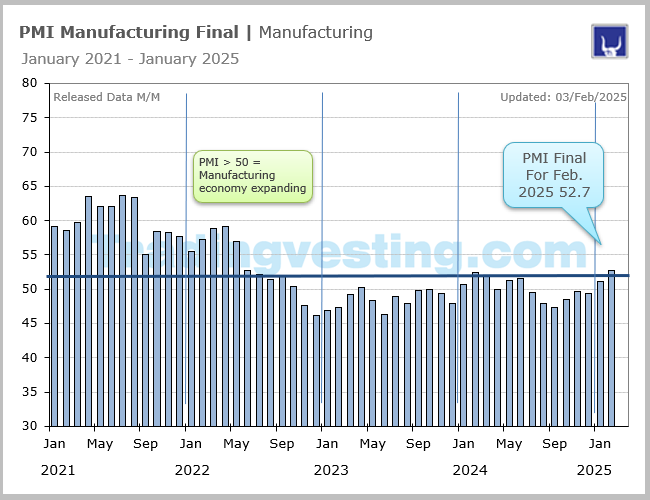 6. PMI Mfg Final (6 of 9)
 7. PMI Composite Flash (7 of 9)
 8. Chicago PMI (8 of 9)
 9. Philadelphia Mfg Index (9 of 9)
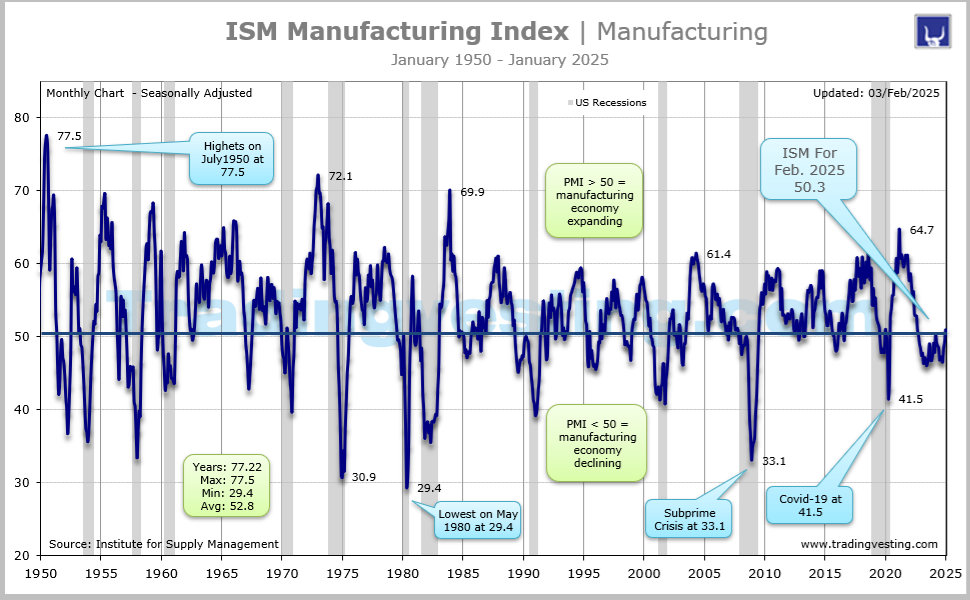
 1. ISM Manufacturing Index (1 of 9)
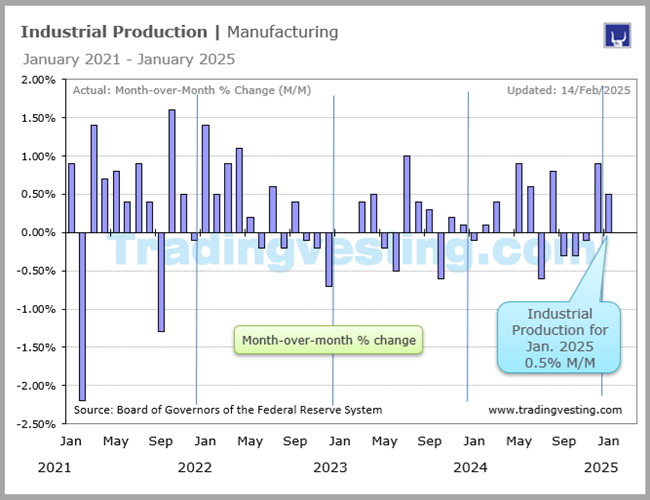 2. Industrial Production (2 of 9)
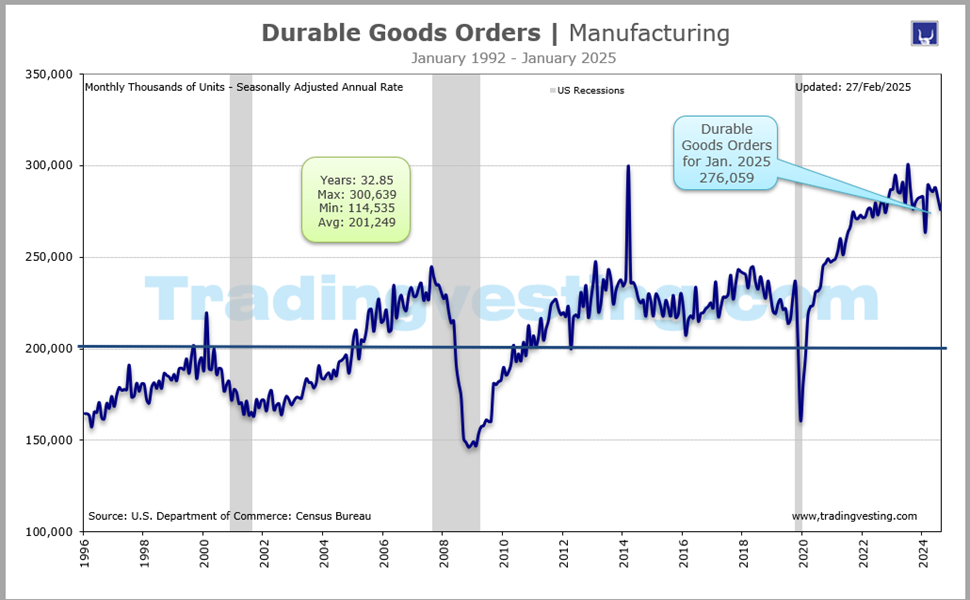
 3. Durable Goods Orders (3 of 9)
 4. Factory Orders (4 of 9)
|
 |
|
|
|
|
| |
|
→ Big Chart |
|
→ Release |
|
| |
|
|
|
|
|
|
|
|
|
|
|
|
|
|
|
|
|
|
|
 |
|
Big Chart | Large Data |
 |
|
Empire State Mfg Index| Manufacturing |
|
Today's Week |
 |
|
|
|
|
|
|
|
|
|
|
|
|
|
| |
|
|
|
|
|
|
|
|
|
|
|
|
|
|
|
|
|
|
|
|
|
Slides | Ten 10 |
|
|
Empire State Mfg Index | Manufacturing |
|
Today's Week |
|
|
|
|
|
|
|
|
|
|
|
|
|
|
| |
|
|
|
|
|
|
|
|
|
|
|
|
|
|
|
|
|
|
|
|
|
Release Schedule | 2026 |
|
|
Empire State Mfg Index | Manufacturing |
|
Today's Week |
|
|
|
|
|
|
|
|
|
|
|
|
|
Empire State Manufacturing Index (At 8:30 a.m ET)
| SCHEDULE 2026 |
No 1 |
No 2 |
No 3 |
No 4 |
No 5 |
No 6 |
No 7 |
No 8 |
No 9 |
No 10 |
No 11 |
No 12 |
| Release | Week |
|
|
|
|
|
|
|
|
|
|
|
|
| Release | Date |
|
|
|
|
|
|
|
|
|
|
|
|
| Release | Day |
|
|
|
|
|
|
|
|
|
|
|
|
 |
|
|
|
|
|
|
|
|
|
|
|
|
| Prior |
-3.9 |
7.7 |
7.1 |
-0.2 |
11.0 |
19.6 |
... |
... |
... |
... |
... |
... |
| Prior Rev |
-3.7 |
... |
... |
... |
11.0 |
... |
... |
... |
... |
... |
... |
... |
| CONSENSUS |
1.0 |
7.0 |
3.9 |
-2.0 |
7.8 |
12.5 |
... |
... |
... |
... |
... |
... |
| Consensus Low |
-5.0 |
2.0 |
-5.0 |
-3.1 |
4.0 |
9.0 |
... |
... |
... |
... |
... |
... |
| Consensus High |
4.0 |
10.1 |
5.0 |
3.3 |
9.0 |
16.0 |
... |
... |
... |
... |
... |
... |
| EMPIRE M/M |
7.7 |
7.1 |
-0.2 |
11.0 |
19.6 |
5.7 |
... |
... |
... |
... |
... |
... |
| RATING |
|
|
|
|
|
|
|
|
|
|
|
|
| Release For |
Jan-26 |
Feb-26 |
Mar-26 |
Apr-26 |
May-26 |
Jun-26 |
Jul-26 |
Aug-26 |
Sep-26 |
Oct-26 |
Nov-26 |
Dec-26 |
|
|
|
|
|
|
|
|
|
|
|
|
|
|
|
| |
|
| |
|
|
|
|
|
|
|
|
|
|
|
Release Schedule | 2025 |
|
|
Empire State Mfg Index | Manufacturing |
|
Today's Week |
|
|
|
|
|
|
|
|
|
|
|
|
|
Empire State Manufacturing Index (At 8:30 a.m ET)
| SCHEDULE 2025 |
No 1 |
No 2 |
No 3 |
No 4 |
No 5 |
No 6 |
No 7 |
No 8 |
No 9 |
No 10 |
No 11 |
No 12 |
| Release | Week |
|
|
|
|
|
|
|
|
|
|
|
|
| Release | Date |
|
|
|
|
|
|
|
|
|
|
|
|
| Release | Day |
|
|
|
|
|
|
|
|
|
|
|
|
|
|
|
|
|
|
|
|
|
|
|
|
|
| Prior |
0.2 |
-12.6 |
5.7 |
-20.0 |
-8.1 |
-9.2 |
-16.0 |
5.5 |
11.9 |
-8.7 |
10.7 |
18.7 |
| Prior Rev |
2.1 |
... |
... |
... |
... |
... |
... |
... |
... |
... |
... |
... |
| CONSENSUS |
1.0 |
-0.5 |
0.2 |
-10.0 |
-7.5 |
-7.0 |
-10.0 |
0.5 |
4.3 |
-0.9 |
5.8 |
10.0 |
| Consensus Low |
-2.0 |
-5.3 |
-2.0 |
-30.0 |
-8.0 |
-8.1 |
-13.0 |
-10.0 |
-6.0 |
-5.5 |
3.0 |
5.0 |
| Consensus High |
5.0 |
2.0 |
6.0 |
6.0 |
2.1 |
-5.0 |
-6.9 |
10.0 |
8.0 |
2.0 |
10.0 |
15.4 |
| EMPIRE M/M |
-12.6 |
5.7 |
-20.0 |
-8.1 |
-9.2 |
-16.0 |
5.5 |
11.9 |
-8.7 |
10.7 |
18.7 |
-3.9 |
| RATING |
|
|
|
|
|
|
|
|
|
|
|
|
| Release For |
Jan-25 |
Feb-25 |
Mar-25 |
Apr-25 |
May-25 |
Jun-25 |
Jul-25 |
Aug-25 |
Sep-25 |
Oct-25 |
Nov-25 |
Dec-25 |
|
|
| |
|
| |
|
|
|
|
|
|
|
|
|
|
|
Release Schedule | 2024 |
|
|
Empire State Mfg Index | Manufacturing |
|
Today's Week |
|
|
|
|
|
|
|
|
|
|
|
|
|
Empire State Manufacturing Index (At 8:30 a.m ET)
| SCHEDULE 2024 |
No 1 |
No 2 |
No 3 |
No 4 |
No 5 |
No 6 |
No 7 |
No 8 |
No 9 |
No 10 |
No 11 |
No 12 |
| Release | Week |
|
|
|
|
|
|
|
|
|
|
|
|
| Release | Date |
|
|
|
|
|
|
|
|
|
|
|
|
| Release | Day |
|
|
|
|
|
|
|
|
|
|
|
|
|
|
|
|
|
|
|
|
|
|
|
|
|
| Prior |
-14.5 |
-43.7 |
-2.4 |
-20.9 |
-14.3 |
-15.6 |
-6.0 |
-6.6 |
-4.7 |
11.5 |
-11.9 |
31.2 |
| CONSENSUS |
-4.7 |
-12.5 |
-8.0 |
-5.1 |
-10.0 |
-10.5 |
-6.0 |
-6.0 |
-3.9 |
2.7 |
0.0 |
9.1 |
| Consensus Low |
-9.0 |
-20.2 |
-13.0 |
-12.8 |
-20.0 |
-18.6 |
-15.6 |
-11.0 |
-11.3 |
-5.9 |
-5.5 |
2.3 |
| Consensus High |
-1.0 |
-8.0 |
1.5 |
1.0 |
-4.5 |
-5.0 |
-2.0 |
11.3 |
1.5 |
8.7 |
3.5 |
16.6 |
| EMPIRE M/M |
-43.7 |
-2.4 |
-20.9 |
-14.3 |
-15.6 |
-6.0 |
-6.6 |
-4.7 |
11.5 |
-11.9 |
31.2 |
0.2 |
| RATING |
|
|
|
|
|
|
|
|
|
|
|
|
| Release For |
Jan-24 |
Feb-24 |
Mar-24 |
Apr-24 |
May-24 |
Jun-24 |
Jul-24 |
Aug-24 |
Sep-24 |
Oct-24 |
Nov-24 |
Dec-24 |
|
|
|
|
|
|
|
|
|
|
|
|
|
|
|
| |
|
| |
|
|
|
|
|
|
|
|
|
|
|
Release Schedule | 2023 |
|
|
Empire State Mfg Index | Manufacturing |
|
Today's Week |
|
|
|
|
|
|
|
|
|
|
|
|
|
Empire State Manufacturing Index (At 8:30 a.m ET)
| SCHEDULE 2023 |
No 1 |
No 2 |
No 3 |
No 4 |
No 5 |
No 6 |
No 7 |
No 8 |
No 9 |
No 10 |
No 11 |
No 12 |
| Release | Week |
|
|
|
|
|
|
|
|
|
|
|
|
| Release | Date |
|
|
|
|
|
|
|
|
|
|
|
|
| Release | Day |
|
|
|
|
|
|
|
|
|
|
|
|
|
|
|
|
|
|
|
|
|
|
|
|
|
| Prior |
-11.2 |
-32.9 |
-5.8 |
-24.6 |
10.8 |
-31.8 |
6.6 |
1.1 |
-19.0 |
1.9 |
-4.6 |
9.1 |
| CONSENSUS |
-8.1 |
-18.5 |
-7.7 |
-18.3 |
-2.0 |
-15.1 |
-3.0 |
-0.4 |
-10.0 |
-5.0 |
-3.0 |
3.7 |
| Consensus Low |
-11.0 |
-23.0 |
-11.0 |
-22.0 |
-11.0 |
-23.5 |
-10.0 |
-7.3 |
-15.0 |
-10.0 |
-9.0 |
-5.0 |
| Consensus High |
-3.1 |
-12.5 |
-3.0 |
-11.5 |
9.3 |
-9.6 |
5.0 |
6.4 |
-2.9 |
0.0 |
-1.0 |
6.0 |
| EMPIRE M/M |
-32.9 |
-5.8 |
-24.6 |
10.8 |
-31.8 |
6.6 |
1.1 |
-19.0 |
1.9 |
-4.6 |
9.1 |
-14.5 |
| RATING |
|
|
|
|
|
|
|
|
|
|
|
|
| Release For |
Jan-23 |
Feb-23 |
Mar-23 |
Apr-23 |
May-23 |
Jun-23 |
Jul-23 |
Aug-23 |
Sep-23 |
Oct-23 |
Nov-23 |
Dec-23 |
|
|
|
|
|
|
|
|
|
|
|
|
|
|
|
| |
|
| |
|
|
|
|
|
|
|
|
|
|
|
Release Schedule | 2022 |
|
|
Empire State Mfg Index | Manufacturing |
|
Today's Week |
|
|
|
|
|
|
|
|
|
|
|
|
|
Empire State Manufacturing Index (At 8:30 a.m ET)
| SCHEDULE 2022 |
No 1 |
No 2 |
No 3 |
No 4 |
No 5 |
No 6 |
No 7 |
No 8 |
No 9 |
No 10 |
No 11 |
No 12 |
| Release | Week |
|
|
|
|
|
|
|
|
|
|
|
|
| Release | Date |
|
|
|
|
|
|
|
|
|
|
|
|
| Release | Day |
|
|
|
|
|
|
|
|
|
|
|
|
|
|
|
|
|
|
|
|
|
|
|
|
|
| Prior |
31.9 |
-0.7 |
3.1 |
-11.8 |
24.6 |
-11.6 |
-1.2 |
11.1 |
-31.3 |
-1.5 |
-9.1 |
4.5 |
| CONSENSUS |
26.0 |
10.0 |
8.0 |
2.0 |
15.0 |
5.5 |
-1.3 |
5.0 |
-12.8 |
-2.5 |
-7.6 |
-0.4 |
| Consensus Low |
21.0 |
3.5 |
-2.0 |
-1.5 |
5.0 |
3.0 |
-15.0 |
3.0 |
-20.0 |
-5.0 |
-15.0 |
-2.0 |
| Consensus High |
32.5 |
21.0 |
10.0 |
12.2 |
18.5 |
10.0 |
5.0 |
8.0 |
5.0 |
0.0 |
-5.0 |
5.3 |
| EMPIRE M/M |
-0.7 |
3.1 |
-11.8 |
24.6 |
-11.6 |
-1.2 |
11.1 |
-31.3 |
-1.5 |
-9.1 |
4.5 |
-11.2 |
| RATING |
|
|
|
|
|
|
|
|
|
|
|
|
| Release For |
Jan-22 |
Feb-22 |
Mar-22 |
Apr-22 |
May-22 |
Jun-22 |
Jul-22 |
Aug-22 |
Sep-22 |
Oct-22 |
Nov-22 |
Dec-22 |
|
|
|
|
|
|
|
|
|
|
|
|
|
|
|
| |
|
| |
|
|
|
|
|
|
|
|
|
|
|
Release Schedule | 2021 |
|
|
Empire State Mfg Index | Manufacturing |
|
Today's Week |
|
|
|
|
|
|
|
|
|
|
|
|
|
Empire State Manufacturing Index (At 8:30 a.m ET)
| SCHEDULE 2021 |
No 1 |
No 2 |
No 3 |
No 4 |
No 5 |
No 6 |
No 7 |
No 8 |
No 9 |
No 10 |
No 11 |
No 12 |
| Release | Week |
|
|
|
|
|
|
|
|
|
|
|
|
| Release | Date |
|
|
|
|
|
|
|
|
|
|
|
|
| Release | Day |
|
|
|
|
|
|
|
|
|
|
|
|
|
|
|
|
|
|
|
|
|
|
|
|
|
| Prior |
4.9 |
3.5 |
12.1 |
17.4 |
26.3 |
24.3 |
17.4 |
43.0 |
18.3 |
34.3 |
19.8 |
30.9 |
| CONSENSUS |
6.0 |
5.7 |
14.8 |
17.0 |
25.0 |
22.5 |
18.3 |
29.0 |
18.0 |
25.0 |
22.7 |
25.5 |
| Consensus Low |
4.5 |
4.2 |
12.1 |
14.0 |
20.0 |
20.0 |
15.0 |
18.0 |
15.0 |
20.0 |
20.5 |
15.0 |
| Consensus High |
11.0 |
10.0 |
18.0 |
21.8 |
30.0 |
25.0 |
20.0 |
38.0 |
22.0 |
34.1 |
25.0 |
30.0 |
| EMPIRE M/M |
3.5 |
12.1 |
17.4 |
26.3 |
24.3 |
17.4 |
43.0 |
18.3 |
34.3 |
19.8 |
30.9 |
31.9 |
| RATING |
|
|
|
|
|
|
|
|
|
|
|
|
| Release For |
Jan-21 |
Feb-21 |
Mar-21 |
Apr-21 |
May-21 |
Jun-21 |
Jul-21 |
Aug-21 |
Sep-21 |
Oct-21 |
Nov-21 |
Dec-21 |
|
|
|
|
|
|
|
|
|
|
|
|
|
|
|
| |
|
| |
|
Legends: |
 |
Delayed |
 |
Positive View |
 |
Negative View |
 |
Neutral View |
 |
Non Available |
|
|
|
|
|
|
|
|
|
|
|
|
|
|
|
|
|
|
|
|
| |
|
|
|
|
|
|
|
|
|
|
|
|
|
|
|
|
|
|
|
|
|
Brief News | 2026 |
|
|
Empire State Mfg Index | Manufacturing |
|
Today's Week |
|
|
|
|
|
|
|
|
|
|
|
|
|
Empire State Manufacturing Index (At 8:30 a.m ET)
| DATE/WEEK |
HIGHLIGHTS |
FOR |
ACTUAL |
|
NY Empire State Manufacturing Index |
No 12 |
... |
|
Dec-2025 |
|
| |
|
|
|
NY Empire State Manufacturing Index |
No 11 |
... |
|
Nov-2025 |
|
| |
|
|
|
NY Empire State Manufacturing Index |
No 10 |
... |
|
Oct-2025 |
|
| |
|
|
|
NY Empire State Manufacturing Index |
No 9 |
... |
|
Sep-2025 |
|
| |
|
|
|
NY Empire State Manufacturing Index |
No 8 |
... |
|
Aug-2025 |
|
| |
|
|
|
NY Empire State Manufacturing Index |
No 7 |
... |
|
Jul-2025 |
|
| |
|
|
|
NY Empire State Manufacturing Index |
No 6 |
... |
|
Jun-2025 |
|
| |
|
|
|
NY Empire State Manufacturing Index |
No 5 |
... |
|
May-2025 |
|
| |
|
|
|
NY Empire State Manufacturing Index |
No 4 |
... |
|
Apr-2025 |
|
| |
|
|
|
NY Empire State Manufacturing Index |
No 3 |
-0.2 |
|
Mar-2025 |
|
| |
|
|
|
NY Empire State Manufacturing Index. Business activity increased modestly in New York State in February 2026 according to firms responding to the Empire State Manufacturing Survey. The headline general business conditions index was little changed at 7.1, its fourth positive reading in five months. Consensus was 7.0 and prior 7.7.
|
No 2 |
7.1 |
|
Feb-2025 |
|
| |
|
|
|
NY Empire State Manufacturing Index on January 2026 data, the Empire State Manufacturing Survey indicated an increase in regional manufacturing activity, with the headline general business conditions index rising to 7.7 vs 1.0 Consensus and Prior -3.9. |
No 1 |
7.7 |
|
Jan-2025 |
|
| |
|
|
|
|
|
|
|
|
| |
|
|
|
|
|
| |
|
|
|
|
|
|
|
|
|
|
|
|
|
|
|
Brief News | 2025 |
|
|
Empire State Mfg Index | Manufacturing |
|
Today's Week |
|
|
|
|
|
|
|
|
|
|
|
|
|
Empire State Manufacturing Index (At 8:30 a.m ET)
| DATE/WEEK |
HIGHLIGHTS |
FOR |
ACTUAL |
|
NY Empire State Manufacturing Index. Based on reports from December 15, 2025, the New York Fed’s Empire State Manufacturing Index plunged to -3.9 in December 2025, missing estimates of +10.0 and falling significantly from 18.7 in November. This reading indicates that business conditions in New York State entered contraction territory (<0) during December. |
No 12 |
-3.9 |
|
Dec-2025 |
|
| |
|
|
|
The NY Empire State Manufacturing Index surged to 18.7, a significant increase from the previous reading of 10.7. This represents an 8-point rise, indicating a stronger manufacturing sector in the region. The actual result of 18.7 far exceeded the analyst estimate of 6.0, suggesting a more robust manufacturing environment than anticipated. This unexpected strength is likely to positively impact industrial and manufacturing stocks, as it signals increased production activity. The market may interpret this as a short-term boost to sentiment, with potential longer-term implications for economic growth expectations. |
No 11 |
18.7 |
|
Nov-2025 |
|
| |
|
|
|
The New York Empire State Manufacturing Index reading for October 2025 was 10.7, which indicated a modest growth in business activity in New York State's manufacturing sector. This value significantly surpassed the market expectation of a contraction (forecasts averaged around -1.8). The positive reading was driven by an increase in new orders and shipments, reversing the sharp decline seen in September. The unexpected strength of the manufacturing data challenged then-current market beliefs that the Federal Reserve would soon cut interest rates. |
No 10 |
10.7 |
|
Oct-2025 |
|
| |
|
|
|
Business activity across New York State's manufacturing region unexpectedly declined, according to a closely followed survey on Monday by the New York Federal Reserve, as new orders and shipments both fell sharply. The headline general business conditions index of the Empire State Manufacturing Survey sank 21 points to -8.7 in September 2025, marking its first negative reading since June. |
No 9 |
-8.7 |
|
Sep-2025 |
|
| |
|
|
|
Manufacturing activity in New York State picked up for a second consecutive month, according to the August survey. The general business conditions index climbed six points to 11.9, its highest level since November 2024. The new orders index rose thirteen points to 15.4, and the shipments index held steady at 12.2, pointing to increases in both orders and shipments. Unfilled orders edged lower. After rising sharply last month, the inventories index retreated twenty-two points to -6.4, indicating that business inventories shrank. Delivery times were significantly longer, and supply availability was somewhat worse. |
No 8 |
11.9 |
|
Aug-2025 |
|
| |
|
|
|
New York manufacturing index posts best reading since February. Factory activity in the New York area surged in July, posting its first positive reading since February as shipments, inventory and employment grew and optimism for the future also improved, according to the regional Federal Reserve. The New York Fed’s Empire State Manufacturing index jumped to 5.5, a nearly 22-point improvement over the prior month and much better than the -9.5 forecast from Dow Jones. The gauge measures the percentage difference between companies reporting expansion against contraction. |
No 7 |
5.5 |
|
Jul-2025 |
|
| |
|
|
|
The New York Empire State Manufacturing Index significantly weakened in June 2025, falling to -16.0 from -9.2 in May, marking the lowest reading since March 2025, which itself was a two-year low at -20.0. This decline indicates a further deterioration in business conditions within New York State's manufacturing sector, with new orders, shipments, and supply availability all showing weakness. |
No 6 |
-16.0 |
|
Jun-2025 |
|
| |
|
|
|
NY Fed's Empire State manufacturing index loses ground in May. Business activity continued to soften in the Federal Reserve Bank of New York's district during May, according to its latest Empire State Manufacturing Survey, released Thursday. The general business conditions index stood at -9.2 in May from April's -8.1, the third straight month of declining activity, the report said. The firms remained "pessimistic" about the outlook, the regional Fed bank also said in its report. |
No 5 |
-9.2 |
|
May-2025 |
|
| |
|
|
|
Empire State manufacturing reading not as bad as expected. The outlook for factory activity in the New York region dimmed to its second-lowest in the 22-year history of a Federal Reserve survey released Tuesday. Though the New York Fed’s Empire State Manufacturing index actually rose nearly 12 points, it remained negative at -8.1, representing the percentage difference between companies reporting expansion against contraction. The reading was better than the -12.4 level forecast by Dow Jones. However, the general business condition index for expected activity six months ahead tumbled 20.1 points to -7.4. New orders, shipments and inventories are all expected to decline, while the pace of price increases is expected to pick up. |
No 4 |
-8.1 |
|
Apr-2025 |
|
| |
|
|
|
The Empire State Manufacturing Index tumbled to -20.0 in March, significantly below the -1.9 consensus and compared with 5.7 in the previous month, according to a New York Federal Reserve survey released on Monday. The monthly plunge in New York State general business conditions came as input prices advanced at their fastest pace in over two years, noted Richard Deitz, economic research advisor at the NY Fed. "In addition, supply availability is expected to contract and firms continued to grow less optimistic about the future business outlook. |
No 3 |
-20.0 |
|
Mar-2025 |
|
| |
|
|
|
The New York Empire State Manufacturing Index indicated a significant shift in February 2025, with the general business conditions index climbing 18 points to 5.7, rising from -12.6 in January and reversing a previous downward trend. This suggests a rebound in manufacturing activity in New York State during February, with new orders and shipments growing moderately and delivery times slightly lengthening. |
No 2 |
5.7 |
|
Feb-2025 |
|
| |
|
|
|
NY Empire State Manufacturing Index plunges, signaling worsening conditions. The NY Empire State Manufacturing Index, a key indicator of business conditions in New York state, has taken a sharp downturn. Comparing the actual figure to the forecasted number, the drop is considerable. The actual figure released shows a reading of -12.60, a significant drop from the forecasted 2.70. This negative reading indicates worsening conditions in the manufacturing sector, a stark contrast to the forecasted improvement. The index is compiled from a survey of approximately 200 manufacturers in New York state, with a level above 0.0 indicating improving conditions and below 0.0 indicating worsening conditions. This latest figure, being well below 0.0, suggests a bearish outlook for the USD. |
No 1 |
-12.6 |
|
Jan-2025 |
|
| |
|
|
|
|
|
|
|
|
| |
|
|
|
|
|
| |
|
|
|
|
|
|
|
|
|
|
|
|
|
|
|
Brief News | 2024 |
|
|
Empire State Mfg Index | Manufacturing |
|
Today's Week |
|
|
|
|
|
|
|
|
|
|
|
|
|
Empire State Manufacturing Index (At 8:30 a.m ET)
| DATE/WEEK |
HIGHLIGHTS |
FOR |
ACTUAL |
|
NY Empire State Manufacturing Index Dips In December 2024. NY Empire State Manufacturing Index Plummets, Signaling Slowed Growth. The New York Empire State Manufacturing Index, a key indicator of general business conditions in New York state, has taken a substantial dive. The index, which is compiled from a survey of approximately 200 manufacturers in the state, fell to a mere 0.2. This dramatic drop in the index is significantly lower than the forecasted value of 6.4. The stark contrast between the actual and forecasted figures suggests that business conditions in New York state are not improving as expected. Instead, they are barely holding steady, as indicated by the index level just above 0.0, which denotes improving conditions. |
No 12 |
0.2 |
|
Dec-2024 |
|
| |
|
|
|
Empire state manufacturing survey shows steady growth in New York businesses. The Federal Reserve Bank of New York released a survey detailing manufacturing trends in New York state. The report found manufacturing activity grew in New York state in November, with sharp increases in new orders and shipments. The survey went on to say price increases remained steady, and firms remained optimistic about future conditions.Friday, import prices rose a stronger than expected 0.3% in October. Also, the Empire State Manufacturing Index soared to 31.2, its highest level since December 2021 and far better than the estimate for a flat reading. |
No 11 |
31.2 |
|
Nov-2024 |
|
| |
|
|
|
Empire State Manufacturing Index Turns Negative. The October 2024 empire state manufacturing index was -11.9 when 2.7 was expected. Business activity contracted modestly in New York State, according to firms responding to the October 2024 Empire State Manufacturing Survey. After climbing into positive territory last month, the headline general business conditions index retreated twenty-three points to -11.9. New orders fell, and shipments edged lower. Delivery times were slightly shorter, while supply availability deteriorated somewhat. Inventories shrank. |
No 10 |
|
|
Oct-2024 |
|
| |
|
|
|
Factory activity in New York State has sprung to life this month, boasting its best reading in more than two years. New York Federal Reserve's Manufacturing index unexpectedly leap-frogged into positive territory for the first time since November, surging to 11.5 from August's contractive -4.7 reading. It marks the highest level since April 2022 and defied the -4.75 consensus. An Empire State reading above zero signifies monthly expansion. |
No 9 |
11.5 |
|
Sep-2024 |
|
| |
|
|
|
Manufacturing business activity in New York State contracted this month, albeit less sharply than in July, as demand edged lower and employment remained weak, a monthly survey of firms said. The Federal Reserve Bank of New York said Thursday that its Empire State Manufacturing Survey ticked up to minus 4.7 in August from minus 6.6 last month, the ninth-straight month in contractionary territory as it came below the zero no-change mark. A consensus of economists polled by The Wall Street Journal had expected the index to be minus 6.0. |
No 8 |
-4.7 |
|
Aug-2024 |
|
| |
|
|
|
New York Empire State factory gauge contracts for eighth straight month in July. Index falls slightly to negative 6.6, slightly below forecast. The New York Fed’s Empire State business conditions index, a gauge of manufacturing activity in the state, slipped 0.6 points in July to negative 6.6, the regional Fed bank said Monday. Economists had expected the index to remain unchanged at a negative 6 reading, according to a survey by the Wall Street Journal. |
No 7 |
-6.6 |
|
Jul-2024 |
|
| |
|
|
|
New York Fed’s Empire State factory gauge contracts for 7th straight month in June. Headline index moves up 9.6 points, but only to negative 6 reading. The New York Fed’s Empire State business conditions index, a gauge of manufacturing activity in the state, rose 9.6 points in June but remained in contractionary territory at a negative 6 reading, the regional Fed bank said Monday. Economists had expected only a small improvement to negative 10.5, according to a survey by the Wall Street Journal. |
No 6 |
-6.0 |
|
Jun-2024 |
|
| |
|
|
|
May manufacturing activity sluggish in New York state. New York state continues to see deteriorating manufacturing business conditions through May, according to the latest Empire State Manufacturing Survey from the Federal Reserve Bank of New York. The General Business Conditions Index eased 1.3 points from April to -15.6 in May, the sixth consecutive negative monthly reading. |
No 5 |
-15.6 |
|
May-2024 |
|
| |
|
|
|
Manufacturing activity in New York State continued to contract in April 2024, as evidenced by the latest findings from the Empire State Manufacturing Survey. Despite a modest improvement in the headline general business conditions index, which rose by seven points, it remained entrenched below zero at -14.3, indicating persistent weakness in overall business conditions. This protracted downturn is a concerning trend for the manufacturing sector, with implications for the broader economy. |
No 4 |
-14.3 |
|
Apr-2024 |
|
| |
|
|
|
New York Manufacturing Index Contracts by More Than Projected. Empire State factory index fell 18.5 points in March to -20.9. Outlook for prices received climbed to a one-year high. New York state factory activity contracted in March by more than forecast as gauges of orders, shipments and employment all decreased, while manufacturers stayed confident in their ability to pass on costs. The Federal Reserve Bank of New York’s general business conditions index decreased 18.5 points in March to minus 20.9. A reading below zero indicates contraction, and the measure was weaker than all estimates in a Bloomberg survey of economists. |
No 3 |
-20.9 |
|
Mar-2024 |
|
| |
|
|
|
Manufacturing activity edged slightly lower in New York State, according to the Empire State Manufacturing February 2024 survey. The diffusion index for General Business Conditions rose to -2.4 from -43.7 in January. This morning's reading was better than the forecast of -13.7. Manufacturing activity edged slightly lower in New York State, according to the Empire State Manufacturing February survey. The diffusion index for General Business Conditions rose to -2.4 from -43.7 in January. This morning's reading was better than the forecast of -13.7. |
No 2 |
-2.4 |
|
Feb-2024 |
|
| |
|
|
|
The New York Fed's Empire State survey on Tuesday showed factory activity in the region slumping further into recession in January 2024, with measures of new orders, employment and hours worked all plummeting. The diffusion index for General Business Conditions rose came in -43.7 January 2024. This morning's reading was worse than the forecast of -4.7.The New York Fed's Empire State survey on Tuesday showed factory activity in the region slumping further into recession in January, with measures of new orders, employment and hours worked all plummeting. |
No 1 |
-43.7 |
|
Jan-2024 |
|
| |
|
|
|
|
|
|
|
|
| |
|
|
|
|
|
| |
|
|
|
|
|
|
|
|
|
|
|
|
|
|
|
Brief News | 2023 |
|
|
Empire State Mfg Index | Manufacturing |
|
Today's Week |
|
|
|
|
|
|
|
|
|
|
|
|
|
Empire State Manufacturing Index (At 8:30 a.m ET)
| DATE/WEEK |
HIGHLIGHTS |
FOR |
ACTUAL |
|
Empire State manufacturing index drops sharply in December. Business activity in New York's manufacturing sector declined sharply this month, according to the Empire State Manufacturing Survey by the regional Federal Reserve bank on Friday. The headline general business conditions index, which measures activity for New York's manufacturers each month, dropped 24 points to -14.5 from +9.1 in November. This was significantly lower than the drop to +2.0 expected by the market and the 12-month average level of -8.6. |
No 12 |
-14.5 |
|
Dec-2023 |
|
| |
|
|
|
New York manufacturing activity climbs to highest since April. Empire State Manufacturing Index jumps 13.7 points to 9.1 from negative. The New York Fed manufacturing index in November climbed to its highest level since April and came much higher than market estimates, according to a report released on Wednesday. The Empire State Manufacturing Index, which measures the level of general business conditions in the state of New York, jumped a massive 13.7 points to 9.1 this month, according to the Federal Reserve Bank of New York. The market expectation for the index was to come in at -2.8, while the index stood at -4.6 in October. |
No 11 |
9.1 |
|
Nov-2023 |
|
| |
|
|
|
U.S. Stocks Open Higher As Investors Weigh New York’s Fed’s Empire State Factory Gauge, Monitor Israel-Hamas War. The New York’s Fed’s Empire State business conditions index for manufacturing activity in the state fell in October, although the reading was slightly less negative than Wall Street expected. Last week the Dow rose to snap a three-week losing streak, while the S&P 500 booked back-to-back weekly gains and the Nasdaq logged a slight weekly decline amid heightened worries that the Israel-Hamas war risks broadening in the Middle East. |
No 10 |
|
|
Oct-2023 |
|
| |
|
|
|
New York manufacturing gauge tops expectations. Manufacturing activity in the New York area improved more than expected in September, according to a Federal Reserve report Friday. The Empire State Manufacturing Survey, tabulated by the New York Fed, rose to 1.9, an increase of 21 points from July and better than the Dow Jones consensus for -10. The gauge measures the difference between companies reporting expansion against contraction, so the reading indicates a barely growing sector though better than a month ago. Still, major improvements came in general business conditions, new orders and shipments, each of which improved by more than 20 points. On the inflation front, the prices paid and received indexes rose while employment was narrowly lower. |
No 9 |
1.9 |
|
Sep-2023 |
|
| |
|
|
|
New York Fed’s Empire State factory gauge falls back into negative territory in August. Headline index drops twenty points to negative 19, first negative reading since May. The New York Federal Reserve’s Empire State business conditions index, a gauge of manufacturing activity in the state, fell 20.1 points in August to negative 19, the regional Fed bank said Tuesday. This is the first negative reading since May. Economists had expected a negative 1.4 reading, according to a survey by the Wall Street Journal. |
No 8 |
-19.0 |
|
Aug-2023 |
|
| |
|
|
|
Business activity held steady in New York State, according to firms responding to the July 2023 Empire State Manufacturing Survey. The headline general business conditions index fell six points to 1.1. New orders inched up and shipments expanded. Delivery times shortened and inventories continued to decline. Employment levels edged higher, though the average workweek was little changed. Input and selling price increases continued to moderate. State |
No 7 |
1.1 |
|
Jul-2023 |
|
| |
|
|
|
NY Empire State manufacturing index unexpectedly increased to 6.6 in Jun (May: -31.8), as new orders and shipments indices climbed up by 31 and 28 points respectively to 3.1 and 22. Separately, Philadelphia Fed manufacturing index worsened to -13.7 in Jun (May: -10.4): new orders remained negative while the index for shipments turned positive and employment stayed steady. |
No 6 |
6.6 |
|
Jun-2023 |
|
| |
|
|
|
New York Empire State factory gauge plummets in May deep into negative territory. Headline index drops 42.6 points to negative 31.8 The numbers: The New York Fed's Empire State business conditions index, a gauge of manufacturing activity in the state, plunged 42.6 points in May to negative 31.8, the regional Fed bank said Monday. Economists had expected a reading of negative 5, according to a survey by the Wall Street Journal. Any reading below zero indicates deteriorating conditions. Key details: The index for new orders dropped 53.1 points to negative 28 in May, reversing completely a sharp 46.7 point gain in April. |
No 5 |
-31.8 |
|
May-2023 |
|
| |
|
|
|
The NY Empire State Manufacturing Index unexpectedly jumped to 10.8 in April of 2023 from -24.6 in March, beating market forecasts of -18. The reading pointed to the first increase in manufacturing in the NY state in five months and the strongest since July last year. The new orders index rebounded to a one-year high of 25.1 from -21.7, price pressures eased (33 vs 41.9) and employment shrank less, although it marked the third consecutive month of falls (-8 vs -10.1). Looking ahead, firms expect business conditions to improve over the next six months (6.6 vs 2.9), with measures of capital expenditures and employment also rising. |
No 4 |
10.8 |
|
Apr-2023 |
|
| |
|
|
|
New York Fed survey finds disturbing trends in manufacturing data. New orders and shipments are down, along with employment and worker hours, monthly survey shows. The Federal Reserve of New York's latest Empire State Manufacturing Survey shows a continued drop in manufacturing activity in the state, a worrisome trend amid the market turmoil hitting the tech and banking sectors. The survey's general business conditions index fell 19 points in March to -24.6 points, continuing a "see-saw pattern of ups and downs" within negative territory, the New York Fed said in its monthly report issued Wednesday. |
No 3 |
-24.6 |
|
Mar-2023 |
|
| |
|
|
|
Empire State Manufacturing Survey: Activity Continues to Decline in February. This morning we got the latest Empire State Manufacturing Survey. The diffusion index for General Business Conditions climbed 27.1 points from last month but remained negative at -5.8. This morning's reading exceeded the Investing.com forecast of -18.0. The Empire State Manufacturing Index rates the relative level of general business conditions in New York state. A level above 0.0 indicates improving conditions, and below indicates worsening conditions. The reading is compiled from a survey of about 200 manufacturers in New York state. This month's responses were collected between February 2-9th. |
No 2 |
-5.8 |
|
Feb-2023 |
|
| |
|
|
|
Business activity contracted sharply in New York State, according to firms responding to the January 2023 Empire State Manufacturing Survey. The headline general business conditions index fell twenty-two points to -32.9. New orders and shipments declined substantially.The New York Fed's "Empire State" index on current business conditions plummeted to -32.9 this month from -11.2 in December. That was the lowest level since May 2020 and the fifth worst reading in the survey's history. Economists polled by Reuters had forecast the index at -9.0. A reading below zero signals the New York manufacturing sector is contracting. Forty-four percent of respondents in the survey conducted between Jan. 3 and Jan. 10 reported that conditions had worsened, while only 11% said they had improved. A gauge of new orders tumbled 27.5 points to -31.1. The shipments index dropped 27.7 points to -22.4. Order backlogs are also drying up, while inventories are steadily rising. |
No 1 |
-32.9 |
|
Jan-2023 |
|
| |
|
|
|
|
|
|
|
|
| |
|
|
|
|
|
| |
|
|
|
|
|
|
|
|
|
|
|
|
|
|
|
Brief News | 2022 |
|
|
Empire State Mfg Index | Manufacturing |
|
Today's Week |
|
|
|
|
|
|
|
|
|
|
|
|
|
Empire State Manufacturing Index (At 8:30 a.m ET)
| DATE/WEEK |
HIGHLIGHTS |
FOR |
ACTUAL |
|
Business activity declined in New York State, according to firms responding to the December 2022 Empire State Manufacturing Survey. The headline general business conditions index fell sixteen points to -11.2. New orders moved slightly lower, while shipments edged higher. Delivery times and inventories were little changed. Labor market indicators pointed to a moderate increase in employment, but a slightly shorter average workweek. Input prices and selling prices increased at about the same pace as last month. |
No 12 |
-11.2 |
|
Dec-2022 |
|
| |
|
|
|
A barometer of manufacturing activity in New York state rebounded more than expected this month as shipments picked up and factory employment continued to grow steadily, the New York Federal Reserve said on Tuesday. The regional Fed's "Empire State" index on current business conditions rose to a reading of 4.5 in November - the highest since July - from negative 9.1 in October. That exceeded the median estimate of economists polled by Reuters for a reading of negative 5 and topped all 29 forecasts in the poll. A reading above zero signals the New York manufacturing sector is expanding. |
No 11 |
4.5 |
|
Nov-2022 |
|
| |
|
|
|
Empire State Manufacturing Survey: Activity Declined In ... forecast was for a reading of -4.0. The Empire State Manufacturing Index rates the relative level of general business ...In August 2022, the New York Empire State Manufacturing Index rose by 30 points to -1.5. According to a recent survey of businesses, firms were not optimistic that business conditions would improve over the next few months. |
No 10 |
-9.1 |
|
Oct-2022 |
|
| |
|
|
|
New York Fed manufacturing index in negative territory despite September rebound. Firms not very optimistic that business conditions would improve over next 6 months, says Federal Reserve Bank of New York. The New York Fed manufacturing index rebounded in September, but still remains in negative territory, according to a report released by the Federal Reserve Bank of New York on Thursday. The Empire State Manufacturing Index, which measures the level of general business conditions in the state of New York, climbed 30 points to minus 1.5 in September. The index stood at minus 31.30 in August, the lowest reading since May 2020 and the second-largest monthly decline on record. |
No 9 |
-1.5 |
|
Sep-2022 |
|
| |
|
|
|
The Empire State Manufacturing Index for August showed a steep fall (42 points) in its general business conditions, to -31.3. (A negative number indicates contraction.) It was the largest decline in business conditions since May 2020, during the pandemic. August marked the fifth time this year New York manufacturing executives signaled through the survey that general business conditions were worsening. In the other survey components, new orders and shipments plunged, and unfilled orders declined. Delivery times held steady for the first time in nearly two years, and business inventories increased slightly. |
No 8 |
-31.3 |
|
Aug-2022 |
|
| |
|
|
|
New York Empire State July factory activity gauge improves, but mood darkens. Sentiment about next six months moves down sharply in negative territory. The numbers: The New York Fed’s Empire State business conditions index, a gauge of manufacturing activity in the state, rose 12.3 points to 11.1 in July, the regional Fed bank said Friday. Economists had expected a third straight negative reading, according to a survey by The Wall Street Journal. |
No 7 |
11.1 |
|
Jul-2022 |
|
| |
|
|
|
Empire State Manufacturing Survey Conditions was little changed in June 2022. Business activity was little changed in New York State, according to firms responding to the June 2022 Empire State Manufacturing Survey. The headline general business conditions index rose ten points to -1.2. New orders and shipments edged slightly higher, and unfilled orders declined for the first time in over a year. Delivery times lengthened at a slower pace than in recent months, and inventories grew significantly. Labor market indicators pointed to a solid increase in employment and a longer average workweek. The prices paid index moved higher, and the prices received index edged lower, but both remained elevated. Looking ahead, optimism about the six-month outlook remained muted. |
No 6 |
-1.2 |
|
Jun-2022 |
|
| |
|
|
|
NY Empire State Manufacturing Index slumps to -11.6 in May 2022 vs. expected drop to 15.5. The headline NY Fed Manufacturing Index slumped to -11.60 in May from 24.6 in April, much bigger than the expected drop. The subindices were mixed and the US dollar seemed to weaken a tad. The headline General Business Conditions Index of the NY Fed's Empire State Manufacturing Survey slumped to -11.60 in May from 24.60 in April. That was much larger than the expected drop to 17.00 and marked the largest miss on expectations since April 2020, when the pandemic first struck the US |
No 5 |
-11.6 |
|
May-2022 |
|
| |
|
|
|
The Empire State Manufacturing Survey general business-conditions index soared in April 2022, rising 36 points to 24.6, indicating a return to expansionary business conditions in the sector. The index — the monthly gauge of New York’s manufacturing industry — had declined nearly 15 points in March to -11.8. The April reading — based on firms responding to the survey — indicates business activity “picked up significantly” in New York, the Federal Reserve Bank of New York said in its Friday report. A positive reading indicates expansion or growth in manufacturing activity, while a negative index number points to a decline in the sector. The survey found 40 percent of New York manufacturer respondents reported that conditions had improved over the month, while 15 percent said conditions had worsened, the New York Fed said. The New York Fed distributes the Empire State Manufacturing Survey on the first day of each month to the same pool of about 200 manufacturing executives in New York state. On average, about 100 executives return responses |
No 4 |
24.6 |
|
Apr-2022 |
|
| |
|
|
|
The data published by the Federal Reserve Bank of New York revealed on Tuesday that the Empire State Manufacturing Index declined to -11.8 in March 2022 from 3.1 in February 2022. This print missed the market expectation of 7.25 by a wide margin. Empire state manufacturing in March fell fifteen points, lowest level since May 2020. Empire State Manufacturing Index: -11.8 vs. 7 consensus and +3.10 prior. New orders: -11.2 vs. +1.4 prior. Shipments: -7.4 vs. +2.9 prior. The prices paid index remained very elevated, and the prices received index reached yet another record high.The unfilled orders index came in at 13.1. The delivery times index climbed eleven points to 32.7, pointing to a substantial increase in delivery times, and inventories rose at the fastest pace in years. Looking ahead, firms were slightly more optimistic than last month that conditions would improve over the next six months. |
No 3 |
-11.8 |
|
Mar-2022 |
|
| |
|
|
|
Manufacturing activity in New York state barely improved in February 2022 from a month earlier, falling short of expectations for a more robust rebound, while a measure of selling prices surged to a record high. The Federal Reserve Bank of New York’s general business conditions index increased to 3.1 from minus 0.7 a month earlier, a report showed Tuesday. Figures below zero indicate contraction, and the median projection in a Bloomberg survey of economists called for a rebound to 12. |
No 2 |
3.1 |
|
Feb-2022 |
|
| |
|
|
|
US: NY Empire State Manufacturing Index slumps to -0.70 in January vs. expected drop to 25.70. The headline General Business Conditions Index of the NY Fed's Empire State Manufacturing Survey slid to -0.70 in January, from December's 31.90 reading. That was much larger than the expected drop to 25.70 and marked the first time the reading had fallen into negative territory since June 2020. |
No 1 |
-0.70 |
|
Jan-2022 |
|
| |
|
|
|
|
|
|
|
|
| |
|
|
|
|
|
| |
|
|
|
|
|
|
|
|
|
|
|
|
|
|
|
Brief News | 2021 |
|
|
Empire State Mfg Index | Manufacturing |
|
Today's Week |
|
|
|
|
|
|
|
|
|
|
|
|
|
Empire State Manufacturing Index (At 8:30 a.m ET)
| DATE/WEEK |
HIGHLIGHTS |
FOR |
ACTUAL |
|
The New York Empire State Manufacturing Index rose to 31.9 in December of 2021 from 30.9 in November, beating forecasts of 25, pointing to strong growth in business activity in the New York State. The U.S. economy recovery continues to make progress with the New York manufacturing sector seeing strong momentum in December, according to the latest report from the New York Federal Reserve. The New York Empire State Manufacturing Index rose to 31.9 in December of 2021 from 30.9 in November, beating forecasts of 25, pointing to strong growth in business activity in the New York State. The U.S. economy recovery continues to make progress with the New York manufacturing sector seeing strong momentum in December, according to the latest report from the New York Federal Reserve. |
Dec |
31.9 |
|
Dec-2021 |
|
| |
|
|
|
The numbers: The New York Fed's Empire State manufacturing business conditions index rose 11.1 points to 30.9 in November, the regional Fed bank said Monday. Economists had expected a reading of 22, according to a survey by The Wall Street Journal. Any reading above zero indicates improving conditions. The New York Fed's Manufacturing Index for November rose to 30.9 from 19.8 in October, larger than the expected rise to 21.6. The headline was boosted by a rise in the New Orders subindex to 28.8 from 24.3 (a promising sign for manufacturing activity in the coming months), a jump in the Prices Paid subindex to 83.0 from 78.7 and a jump in the Employment subindex to 26.0 from 17.1 (a record high). The only negative spot was a decline in the six-month business conditions subindex to 36.9 from 52. FX markets did not see any notable reaction to the data. |
Nov |
30.9 |
|
nov-2021 |
|
| |
|
|
|
The New York Fed’s Empire State business conditions index fell 14.5 points to 19.8 in October 2021, the regional Fed bank said Friday. Economists had expected a reading of 25, according to a survey by The Wall Street Journal. Any reading above zero indicates improving conditions. The reading of 34.3 in September was the second highest reading in the wake of the pandemic. Key details: The new-orders index slipped 9.4 points to 24.3 in October, and the shipments index sank 18 points to 8.9. Unfilled orders inched lower by 2.4 points to 18.5. Delivery times widened a bit to a new record high and both the prices paid and prices received indexes held near record highs. Optimism increased about the outlook for the next six months. |
Oct |
|
|
Oct-2021 |
|
| |
|
|
|
This morning, we got the latest Empire State Manufacturing Survey, which rates the relative level of general business conditions in New York state. A level above 0.0 indicates improving conditions, below indicates worsening conditions. The diffusion index for General Business Conditions at 34.3 was an increase of 16 from the previous month's 18.3. |
Sep |
34.3 |
|
Sep-2021 |
|
| |
|
|
|
The New York Federal Reserve said on Monday its barometer of manufacturing business activity in New York State declined more than expected in August as shipments growth nearly stalled and new orders grew at a much softer pace than a month earlier. The regional Fed's "Empire State" index on current business conditions fell around 25 points to 18.3, lower than a reading of 29.0 forecast by analysts polled by Reuters. The index had hit a record high of 43 in July. A reading above zero signals the New York manufacturing sector is expanding. |
Aug |
18.3 |
|
Aug-2021 |
|
| |
|
|
|
New York manufacturing rises at record pace
A separate economic report Thursday showed that manufacturing and hiring are booming in the pivotal New York region. The Empire State Manufacturing Survey, conducted by the New York Federal Reserve, rose to a record 43 for July, representing the percentage difference between firms seeing expansion against those contracting. New orders and shipments surged, while the employment index increased 8.3 points to 20.6 as 29.5% of companies indicated they would be adding workers. A forward-looking index on conditions over the next six months also showed a hiring increase, with a reading of 43.9, up 2.2 points from June. |
Jul |
43.0 |
|
Jul-2021 |
|
| |
|
|
|
The regional Fed's "Empire State" index on current business conditions fell seven points to 17.4, lower than a reading of 23.0 forecast among analysts polled by Reuters. A reading above zero signals the New York manufacturing sector is expanding. NY Empire State Manufacturing Index came in lower than expected in June. US Dollar Index clings to daily gains around 90.60. The headline General Business Conditions Index of the NY Fed's Empire State Manufacturing Survey declined to 17.4 in June from 24.3 in May. This reading fell short of the market expectation of 22. |
Jun |
17.4 |
|
Jun-2021 |
|
| |
|
|
|
US: NY Empire State Manufacturing Index falls to 24.3 in May vs. 23.9 expected. The headline General Business Conditions Index of the NY Fed's Empire State Manufacturing Survey declined to 24.3 in May from 26.3 in April. This reading, however, came in better than the market expectation of 23.9. |
May |
24.3 |
|
May-2021 |
|
| |
|
|
|
The New York Federal Reserve's Empire State manufacturing index fell to 24.3 in May from 26.3 in April, compared with a larger expected decrease to a reading of 23.9 in a survey compiled by Bloomberg. The Empire State index is one of the first manufacturing sector readings for May and suggests factory activity remained brisk. The new orders, shipments, and prices paid readings all increased in the month, while the employment reading declined slightly, but remained well above the breakeven point. The prices paid reading was the highest on record. |
Apr |
26.3 |
|
Apr-2021 |
|
| |
|
|
|
Fed's Empire State manufacturing index hits eight-month high in March. NY Empire State Manufacturing Index continues to improve in March. US Dollar Index edges higher toward 92.00 after the data. The headline General Business Conditions Index of the NY Fed's Empire State Manufacturing Survey rose to 17.4 in March from 12.5 in February, the NY Fed's report revealed on Friday. This reading came in better than analysts' estimate of 14.5. |
Mar |
17.4 |
|
Mar-2021 |
|
| |
|
|
|
The New York Fed’s Empire State business conditions index rose 8.6 points to 12.1 in February, the regional Fed bank said Tuesday. This is the highest level of activity since July. Economists had expected a reading of 5.9, according to a survey by the Wall Street Journal. Any reading above zero indicates improving conditions. The new orders index rose 4.2 points to 10.8 in February, while shipments fell 3.3 points to 4. Unfilled orders rose 8.1 points to 2.6 in February. |
Feb |
12.1 |
|
Feb-2021 |
|
| |
|
|
|
Manufacturing activity in New York state expanded in January at a softer pace than that of the previous month, data from the Federal Reserve Bank of New York showed Friday.
The Empire State Manufacturing Survey's general business conditions index decreased to 3.5 in January from 4.9 in December.
The reading misses expectations from economists polled by The Wall Street Journal, who had expected the indicator to increase to 6.0. |
Jan |
3.5 |
|
Jan-2021 |
|
| |
|
|
|
|
|
|
|
|
| |
|
|
|
|
|
| |
|
Legends: |
|
Delayed |
|
Positive View |
|
Negative View |
|
Neutral View |
|
Non Available |
|
|
|
|
|
|
|
|
|
|
|
|
|
|
|
|
|
|
|
|
| |
|
|
|
|
|
|
|
|
|
|
|
|
|
|
|
|
|
|
|
|
|
Definitions | Explain |
|
|
Empire State Mfg Index | Manufacturing |
|
Today's Week |
|
|
|
|
|
|
|
|
|
|
|
|
| |
|
|
|
|
| |
|
| EMPIRE STATE MFG INDEX |
What is the Empire State Manufacturing Index?
A key barometer of future activity that asks manufacturers in the New York region about expectations six months ahead. The Empire State data is watched closely because it is the first reading of the health of the manufacturing sector in November. It is seen as one of the first monthly indicators of the health of U.S. manufacturing leading up to the national report by the Institute for Supply Management. Any reading above zero indicates expansion in the region's manufacturing.
The survey of manufacturing plants in the state is one of the earliest monthly guideposts to U.S. factory conditions. The Empire State Manufacturing Index is a crucial indicator derived from a survey of approximately 200 manufacturers in New York state. A reading above 0.0 suggests improving conditions, while a negative reading signals a deterioration.
General Business Conditions Index.
The survey's main index, general business conditions, is not a weighted average of other indicators it is a distinct question posed on the survey. Each index is seasonally adjusted when stable seasonality is detected.
The Empire State Manufacturing Survey and the Philadelphia Fed's
The Empire State Manufacturing Survey has a much shorter history than the Philadelphia Fed's business outlook survey. The two series tend to move in tandem much of the time, although not each and every month. They are both considered leading indicators for the ISM manufacturing survey.
The New York Fed gauge, like the Philadelphia Fed index due out later this week, is a diffusion index, which subtracts the percentage of respondents who say activity fell during the month from those who say it increased. Any reading above zero is considered positive.
The Empire State Manufacturing Survey has a much shorter history than the Philadelphia Fed's business outlook survey. Analysts put more weight on the Philadelphia Fed's index of current activity, which will be after the Empire State Index.
Revisions
Each January, all data undergo a benchmark revision to reflect new seasonal factors.
Seasonal Adjustment
The Empire State Manufacturing Survey seasonally adjusts data based on the Census X-12 additive procedure utilizing a logistic transformation.
The survey is put out by the New York Fed and covers a wide range of economic indicators from general business conditions to new orders, shipments, unfilled orders, delivery times, inventories, prices paid and received, headcount, and average workweek. It also asks businesses for their outlook six months out. It's a relatively comprehensive survey of business conditions, but it concentrates on New York State, which is a small subset of the population. Like most Fed surveys, it employs a diffusion index methodology, asking respondents whether a certain metric is getting better, getting worse, or staying the same. The index value is the percent of respondents who say the metric is getting better less the percent who say it's getting worse. |
|
|
| |
|
|
|
|
|
|
|
|
|
|
|
|
|
|
|
|
|
|
|
|
|
Data | Source |
|
|
Empire State Mfg Index | Manufacturing |
|
Today's Week |
|
|
|
|
|
|
|
|
|
|
|
|
| |
|
|
|
|
|
|
| DATA INFORMATION |
EMPIRE STATE MFG INDEX |
| SOURCE |
Institute for Supply Management. |
| WEB |
www.hts.com |
| FREQUENCY |
Monthly |
| AVAILABILITY |
The first business day of the month. |
| COVERAGE |
Data are for the previous month. Data for June are released in July. |
| REVISIONS |
Yes |
| IMPORTANCE |
Manufacturing - Very Important |
|
| |
|
|
|
|
|
|
|
|
|
|
|
|