 |
 |
|
 |
Leading Indicators (LEI) | Business Activity |
|
 |
|
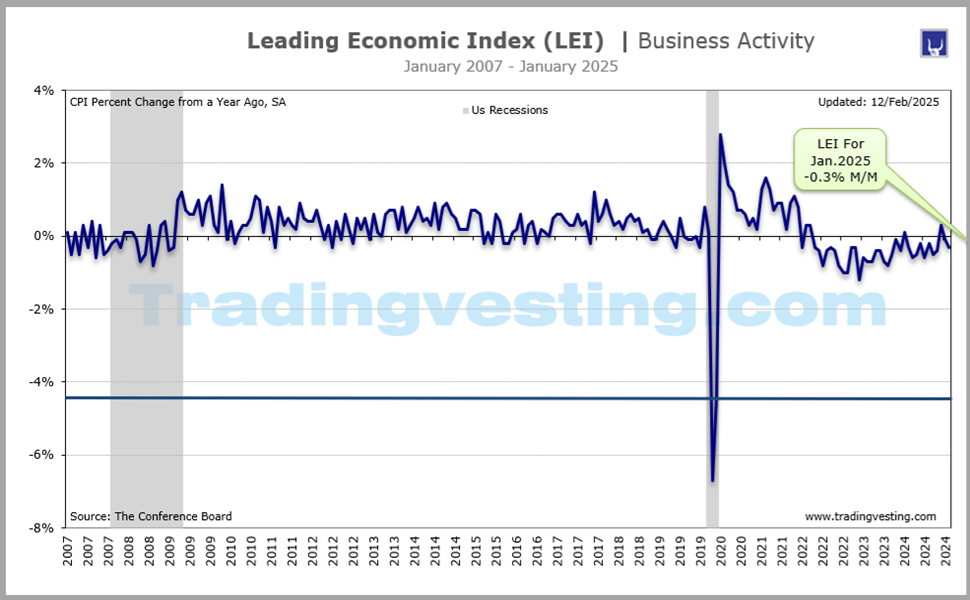
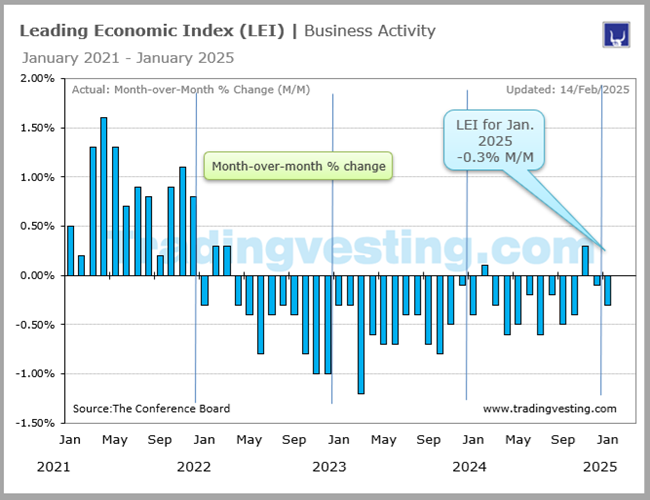
The LEI is a weighted gauge of 10 indicators that are designed to signal business cycle peaks and troughs.The Leading Indicators report is a compendium of previously announced economic indicators. Read more
|
|
|
|
|
|
|
| |
|
| |
 2. Leading Indicators ( 1 of 4 ) 2. Leading Indicators ( 1 of 4 ) 3. Chicago Fed National Activity Index ( 2 of 4 ) 3. Chicago Fed National Activity Index ( 2 of 4 ) 4. PMI Services Final (3 of 4) 4. PMI Services Final (3 of 4) 1. ISM Services Index ( 5 of 4 ) 1. ISM Services Index ( 5 of 4 )
|
 |
|
|
|
|
| |
|
→ Big Chart |
|
→ Release |
|
| |
|
|
|
|
|
|
|
|
|
|
|
|
|
|
|
|
|
|
|
 |
|
Big Chart | Large Data |
 |
|
Leading Indicators | Business Activity |
|
Today's Week |
 |
|
|
|
|
|
|
|
|
|
|
|
|
|
| |
|
|
|
|
|
|
|
|
|
|
|
|
|
|
|
|
|
|
|
|
|
Slides | Five 5 |
|
|
Leading Indicators | Business Activity |
|
Today's Week |
|
|
|
|
|
|
|
|
|
|
|
|
|
|
| |
|
|
|
|
|
|
|
|
|
|
|
|
|
|
|
|
|
|
|
|
|
Release Schedule | 2026 |
|
|
Leading Indicators | Business Activity |
|
Today's Week |
|
|
|
|
|
|
|
|
|
|
|
|
|
Leading Indicators (At 10:00 a.m ET)
| SCHEDULE 2026 |
No 1 |
No 2 |
No 3 |
No 4 |
No 5 |
No 6 |
No 7 |
No 8 |
No 9 |
No 10 |
No 11 |
No 12 |
| Release | Week |
|
|
|
|
|
|
|
|
|
|
|
|
| Release | Date |
|
|
|
|
|
|
|
|
|
|
|
|
| Release | Day |
|
|
|
|
|
|
|
|
|
|
|
|
 |
|
|
|
|
|
|
|
|
|
|
|
|
| Prior |
-0.3% |
-0.2% |
... |
... |
... |
... |
... |
... |
... |
... |
... |
... |
| Prior Revised |
... |
... |
... |
... |
... |
... |
... |
... |
... |
... |
... |
... |
| CONSENSUS |
... |
... |
... |
... |
... |
... |
... |
... |
... |
... |
... |
... |
| Consensus Low |
... |
... |
... |
... |
... |
... |
... |
... |
... |
... |
... |
... |
| Consensus High |
... |
... |
... |
... |
... |
... |
... |
... |
... |
... |
... |
... |
| LEI M/M |
-0.2% |
-0.1% |
... |
... |
... |
... |
... |
... |
... |
... |
... |
... |
| Rating |
|
|
|
|
|
|
|
|
|
|
|
|
| Month For |
Dec-25 |
Jan-26 |
Feb-26 |
Mar-26 |
Apr-26 |
May-26 |
Jun-26 |
Jul-26 |
Aug-26 |
Sep-26 |
Oct-26 |
Nov-26 |
|
|
| |
|
| |
|
|
|
|
|
|
|
|
|
|
|
Release Schedule | 2025 |
|
|
Leading Indicators | Business Activity |
|
Today's Week |
|
|
|
|
|
|
|
|
|
|
|
|
|
Leading Indicators (At 10:00 a.m ET)
| SCHEDULE 2025 |
No 1 |
No 2 |
No 3 |
No 4 |
No 5 |
No 6 |
No 7 |
No 8 |
No 9 |
No 10 |
No 11 |
No 12 |
| Release | Week |
|
|
|
|
|
|
|
|
|
|
|
|
| Release | Date |
|
|
|
|
|
|
|
|
|
|
|
|
| Release | Day |
|
|
|
|
|
|
|
|
|
|
|
|
|
|
|
|
|
|
|
|
|
|
|
|
|
| Prior |
0.3% |
-0.1% |
-0.3% |
-0.3% |
-0.7% |
-1.0% |
-0.1% |
-0.3% |
-0.1% |
-0.5% |
-0.3% |
-0.1% |
| Prior Revised |
0.4% |
0.1% |
-0.2% |
-0.2% |
-0.8% |
-1.4% |
0.0% |
... |
0.1% |
-0.1% |
-0.2% |
... |
| CONSENSUS |
-0.1% |
0.0% |
-0.2% |
-0.5% |
-0.8% |
-0.1% |
-0.2% |
-0.1% |
-0.1% |
-0.3% |
-0.3% |
... |
| Consensus Low |
-0.2% |
-0.2% |
-0.3% |
-0.7% |
-1.0% |
-0.8% |
-0.3% |
-0.2% |
-0.4% |
-0.4% |
-0.3% |
... |
| Consensus High |
0.1% |
0.1% |
-0.1% |
-0.3% |
0.1% |
0.7% |
-0.1% |
0.1% |
0.0% |
-0.3% |
-0.0% |
... |
| LEI M/M |
-0.1% |
-0.3% |
-0.3% |
-0.7% |
-1.0% |
-0.1% |
-0.3% |
-0.1% |
-0.5% |
-0.3% |
-0.1% |
-0.3% |
| Rating |
|
|
|
|
|
|
|
|
|
|
|
|
| Month For |
Dec-24 |
Jan-25 |
Feb-25 |
Mar-25 |
Apr-25 |
May-25 |
Jun-25 |
Jul-25 |
Aug-25 |
Sep-25 |
Oct-25 |
Nov-25 |
|
|
| |
|
| |
|
|
|
|
|
|
|
|
|
|
|
Release Schedule | 2024 |
|
|
Leading Indicators | Business Activity |
|
Today's Week |
|
|
|
|
|
|
|
|
|
|
|
|
|
Leading Indicators (At 10:00 a.m ET)
| SCHEDULE 2024 |
No 1 |
No 2 |
No 3 |
No 4 |
No 5 |
No 6 |
No 7 |
No 8 |
No 9 |
No 10 |
No 11 |
No 12 |
| Release | Week |
|
|
|
|
|
|
|
|
|
|
|
|
| Release | Date |
|
|
|
|
|
|
|
|
|
|
|
|
| Release | Day |
|
|
|
|
|
|
|
|
|
|
|
|
|
|
|
|
|
|
|
|
|
|
|
|
|
| Prior |
-0.5% |
-0.1% |
-0.4% |
0.1% |
-0.3% |
-0.6% |
-0.5% |
-0.2% |
-0.6% |
-0.2% |
-0.5% |
-0.4% |
| Prior Revised |
... |
-0.2% |
... |
0.2% |
... |
... |
-0.4% |
... |
... |
-0.3% |
-0.3% |
... |
| CONSENSUS |
-0.3% |
-0.3% |
-0.3% |
0.0% |
-0.3% |
-0.3% |
-0.3% |
-0.3% |
-0.3% |
-0.3% |
-0.3% |
-0.1% |
| Consensus Low |
-0.4% |
-0.3% |
-0.5% |
-0.3% |
-0.3% |
-0.5% |
-0.4% |
-0.6% |
-0.4% |
-0.4% |
-0.4% |
-0.2% |
| Consensus High |
-0.2% |
-0.2% |
-0.1% |
0.3% |
-0.2% |
-0.2% |
-0.1% |
-0.2% |
-0.2% |
0.1% |
-0.1% |
0.1% |
| LEI M/M |
-0.1% |
-0.4% |
0.1% |
-0.3% |
-0.6% |
-0.5% |
-0.2% |
-0.6% |
-0.2% |
-0.5% |
-0.4% |
0.3% |
| Rating |
|
|
|
|
|
|
|
|
|
|
|
|
| Month For |
Dec-23 |
Jan-24 |
Feb-24 |
Mar-24 |
Apr-24 |
May-24 |
Jun-24 |
Jul-24 |
Aug-24 |
Sep-24 |
Oct-24 |
Nov-24 |
|
|
| |
|
| |
|
|
|
|
|
|
|
|
|
|
|
Release Schedule | 2023 |
|
|
Leading Indicators | Business Activity |
|
Today's Week |
|
|
|
|
|
|
|
|
|
|
|
|
|
Leading Indicators (At 10:00 a.m ET)
| SCHEDULE 2023 |
No 1 |
No 2 |
No 3 |
No 4 |
No 5 |
No 6 |
No 7 |
No 8 |
No 9 |
No 10 |
No 11 |
No 12 |
| Release | Week |
|
|
|
|
|
|
|
|
|
|
|
|
| Release | Date |
|
|
|
|
|
|
|
|
|
|
|
|
| Release | Day |
|
|
|
|
|
|
|
|
|
|
|
|
|
|
|
|
|
|
|
|
|
|
|
|
|
| Prior |
-1.0% |
-1.0% |
-0.3% |
-0.3% |
-1.2% |
-0.6% |
-0.7% |
-0.7% |
-0.4% |
-0.4% |
-0.7% |
-0.8% |
| Prior Revised |
-1.1% |
-0.8% |
... |
-0.5% |
... |
... |
-0.6% |
... |
-0.3% |
-0.5% |
... |
-1.0% |
| CONSENSUS |
-0.7% |
-0.3% |
-0.2% |
-0.4% |
-0.6% |
-0.7% |
-0.6% |
-0.4% |
-0.3% |
-0.4% |
-0.6% |
-0.5% |
| Consensus Low |
-0.8% |
-0.8% |
-0.5% |
-1.1% |
-1.1% |
-0.8% |
-0.9% |
-0.7% |
-0.6% |
-0.5% |
-0.9% |
-0.6% |
| Consensus High |
-0.6% |
-0.3% |
-0.2% |
-0.2% |
-0.4% |
-0.4% |
-0.2% |
0.4% |
-0.2% |
-0.2% |
-0.3% |
-0.4% |
| LEI M/M |
-1.0% |
-0.3% |
-0.3% |
-1.2% |
-0.6% |
-0.7% |
-0.7% |
-0.4% |
-0.4% |
-0.7% |
-0.8% |
-0.5% |
| Rating |
|
|
|
|
|
|
|
|
|
|
|
|
| Month For |
Dec-22 |
Jan-23 |
Feb-23 |
Mar-23 |
Apr-23 |
May-23 |
Jun-23 |
Jul-23 |
Aug-23 |
Sep-23 |
Oct-23 |
Nov-23 |
|
|
| |
|
| |
|
|
|
|
|
|
|
|
|
|
|
Release Schedule | 2022 |
|
|
Leading Indicators | Business Activity |
|
Today's Week |
|
|
|
|
|
|
|
|
|
|
|
|
|
Leading Indicators (At 10:00 a.m ET)
| SCHEDULE 2022 |
No 1 |
No 2 |
No 3 |
No 4 |
No 5 |
No 6 |
No 7 |
No 8 |
No 9 |
No 10 |
No 11 |
No 12 |
| Release | Week |
|
|
|
|
|
|
|
|
|
|
|
|
| Release | Date |
|
|
|
|
|
|
|
|
|
|
|
|
| Release | Day |
|
|
|
|
|
|
|
|
|
|
|
|
|
|
|
|
|
|
|
|
|
|
|
|
|
| Prior |
1.1% |
0.8% |
-0.3% |
0.3% |
0.3% |
-0.3% |
-0.4% |
-0.8% |
-0.4% |
-0.3% |
-0.4% |
-0.8% |
| Prior Revised |
0.7% |
0.7% |
-0.5% |
0.6% |
0.1% |
-0.4% |
-0.6% |
-0.7% |
-0.5% |
0.0% |
-0.5% |
-0.9% |
| CONSENSUS |
0.7% |
0.3% |
0.2% |
0.3% |
0.1% |
-0.4% |
-0.5% |
-0.5% |
0.0% |
-0.3% |
-0.4% |
-0.5% |
| Consensus Low |
0.6% |
0.2% |
-0.2% |
0.1% |
-0.2% |
-0.4% |
-0.8% |
-0.5% |
-0.3% |
-0.6% |
-0.5% |
-0.6% |
| Consensus High |
0.8% |
0.8% |
0.3% |
0.4% |
0.3% |
0.2% |
-0.3% |
-0.3% |
-0.5% |
-0.2% |
0.2% |
-0.4% |
| LEI M/M |
0.8% |
-0.3% |
0.3% |
0.3% |
-0.3% |
-0.4% |
-0.8% |
-0.4% |
-0.3% |
-0.4% |
-0.8% |
-1.0% |
| Rating |
|
|
|
|
|
|
|
|
|
|
|
|
| Month For |
Dec-21 |
Jan-22 |
Feb-22 |
Mar-22 |
Apr-22 |
May-22 |
Jun-22 |
Jul-22 |
Aug-22 |
Sep-22 |
Oct-22 |
Nov-22 |
|
|
| |
|
| |
|
|
|
|
|
|
|
|
|
|
|
Release Schedule | 2021 |
|
|
Leading Indicators | Business Activity |
|
Today's Week |
|
|
|
|
|
|
|
|
|
|
|
|
|
Leading Indicators (At 10:00 a.m ET)
| SCHEDULE 2021 |
No 1 |
No 2 |
No 3 |
No 4 |
No 5 |
No 6 |
No 7 |
No 8 |
No 9 |
No 10 |
No 11 |
No 12 |
| Release | Week |
|
|
|
|
|
|
|
|
|
|
|
|
| Release | Date |
|
|
|
|
|
|
|
|
|
|
|
|
| Release | Day |
|
|
|
|
|
|
|
|
|
|
|
|
|
|
|
|
|
|
|
|
|
|
|
|
|
| Prior |
-0.2% |
0.3% |
0.5% |
0.2% |
1.3% |
1.6% |
1.3% |
0.7% |
0.9% |
0.8% |
0.2% |
0.9% |
| Prior Revised |
... |
0.4% |
0.4% |
0.1% |
... |
... |
1.2% |
0.5% |
0.8% |
0.7% |
0.1% |
0.9% |
| CONSENSUS |
0.4% |
0.3% |
0.3% |
1.0% |
1.2% |
1.3% |
1.0% |
0.8% |
0.5% |
0.5% |
0.8% |
0.8% |
| Consensus Low |
0.2% |
0.2% |
0.2% |
0.9% |
0.9% |
1.0% |
0.7% |
0.2% |
0.2% |
0.2% |
0.2% |
0.5% |
| Consensus High |
0.7% |
0.6% |
0.5% |
1.2% |
1.6% |
1.8% |
1.3% |
0.9% |
0.5% |
0.5% |
0.9% |
1.1% |
| LEI M/M |
0.3% |
0.5% |
0.2% |
1.3% |
1.6% |
1.3% |
0.7% |
0.9% |
0.8% |
0.2% |
0.9% |
1.1% |
| Rating |
|
|
|
|
|
|
|
|
|
|
|
|
| Month For |
Dec-20 |
Jan-21 |
Feb-21 |
Mar-21 |
Apr-21 |
May-21 |
Jun-21 |
Jul-21 |
Aug-21 |
Sep-21 |
Oct-21 |
Nov-21 |
|
|
| |
|
| |
|
Legends: |
 |
Delayed |
 |
Positive View |
 |
Negative View |
 |
Neutral View |
 |
Non Available |
|
|
|
|
|
|
|
|
|
|
|
|
|
|
|
|
|
|
|
|
| |
|
|
|
|
|
|
|
|
|
|
|
|
|
|
|
|
|
|
|
|
|
Brief News | 2026 |
|
|
Leading Indicators | Business Activity |
|
Today's Week |
|
|
|
|
|
|
|
|
|
|
|
|
|
Leading Indicators (At 10:00 a.m ET)
| DATE/WEEK |
HIGHLIGHTS |
FOR |
LEI |
|
LEI |
No 12 |
... |
|
Nov-2025 |
|
| |
|
|
|
LEI |
No 11 |
.... |
|
Oct-2025 |
|
| |
|
|
|
LEI |
No 10 |
... |
|
Sep-2025 |
|
| |
|
|
|
LEI |
No 9 |
-0.5% |
|
Aug-2025 |
|
| |
|
|
|
LEI |
No 8 |
-0.1 |
|
Jul-2025 |
|
| |
|
|
|
LEI |
No 7 |
-0.3% |
|
Jun-2025 |
|
| |
|
|
|
LEI |
No 6 |
-0.1% |
|
May-2025 |
|
| |
|
|
|
LEI |
No 5 |
.-1.0% |
|
Apr-2025 |
|
| |
|
|
|
LEI |
No 4 |
-0.7% |
|
Mar-2025 |
|
| |
|
|
|
LEI |
No 3 |
-0.3% |
|
Feb-2025 |
|
| |
|
|
|
LEI |
No 2 |
-0.3% |
|
Jan-2025 |
|
| |
|
|
|
LEI |
No 1 |
-0.1% |
|
Dec-2024 |
|
| |
|
|
|
|
|
|
|
|
| |
|
|
|
|
|
| |
|
|
|
|
|
|
|
|
|
|
|
|
|
|
|
Brief News | 2025 |
|
|
Leading Indicators | Business Activity |
|
Today's Week |
|
|
|
|
|
|
|
|
|
|
|
|
|
Leading Indicators (At 10:00 a.m ET)
| DATE/WEEK |
HIGHLIGHTS |
FOR |
LEI |
|
LEI |
No 12 |
... |
|
Nov-2025 |
|
| |
|
|
|
LEI |
No 12 |
-0.3% |
|
Sep-2025 |
|
| |
|
|
|
LEI Oct.2025 : Delayed due to the government shut down, |
No 11 |
.... |
|
Oct-2025 |
|
| |
|
|
|
LEI Sep.2025 : Delayed due to the government shut down, |
No 10 |
... |
|
Sep-2025 |
|
| |
|
|
|
U.S. Leading Indicators Continue to Show Weakening Economy. The Leading Economic Index fell 0.5% to 98.4 in August, amid growing concerns about the labor market, headwinds from tariffs and a weak manufacturing sector. The U.S. economy faces a slowing economy amid growing concerns about the labor market, headwinds from tariffs and a weak manufacturing sector, according to a basket of economic indicators. |
No 9 |
-0.5% |
|
Aug-2025 |
|
| |
|
|
|
The Conference Board Leading Economic Index (LEI) for the U.S. ticked down by 0.1% in July 2025. This marked the third consecutive month of decline for the index, with the six-month growth rate remaining negative but improving slightly in July. Weak consumer expectations and new orders continued to weigh down the LEI, while stock prices provided some support and initial claims for unemployment insurance were lower than the prior month. While the LEI continues to signal potential economic weakening in the second half of 2025, the Conference Board does not currently project a recession. |
No 8 |
-0.1 |
|
Jul-2025 |
|
| |
|
|
|
The Conference Board Leading Economic Index (LEI) for June 2025 decreased by 0.3%, reaching 98.8, according to The Conference Board's July 23, 2025 press release and The Wall Street Journal. This decline followed an unchanged reading in May and indicated a faster rate of contraction over the first half of the year compared to the second half of 2024. While stock prices provided some support, the index was weighed down by low consumer expectations, weak manufacturing new orders, and rising unemployment claims. |
No 7 |
-0.3% |
|
Jun-2025 |
|
| |
|
|
|
A measure of future U.S. economic activity fell in May for the sixth straight month and triggered a recession signal, held down by consumer pessimism, weak new orders for manufactured goods, an uptick in jobless benefits claims and a drop in building permit applications. The Conference Board's Leading Economic Index fell by 0.1% to 99.0 last month after a downwardly revised 1.4% drop in April, which was the largest decline in the index since the spring of 2020 at the start of the COVID-19 pandemic. The decline matched the consensus expectation among economists polled by Reuters. |
No 6 |
-0.1% |
|
May-2025 |
|
| |
|
|
|
The Conference Board Leading Economic Index (LEI) for the US decreased by 1.0% in April 2025, reaching 99.4 (2016=100), a notable decline that was the largest monthly decrease since March 2023, revised downwards from a 0.8% decline originally reported. This significant drop signals a warning for future economic growth, though it did not trigger a recession signal as the LEI's six-month growth rate did not fall enough to meet the official criteria. |
No 5 |
.-1.0% |
|
Apr-2025 |
|
| |
|
|
|
A gauge of future U.S. economic activity fell sharply in March, potentially flagging tepid growth this year amid tariffs. The Conference Board said on Monday its Leading Economic Index dropped 0.7% last month after decreasing 0.2% in February. Economists polled by Reuters had forecast the index sliding 0.5%. It fell 1.2% in the six-month period ending in March after contracting 2.3% in the prior six months. |
No 4 |
-0.7% |
|
Mar-2025 |
|
| |
|
|
|
The U.S. Leading Economic Index (LEI) declined for the third consecutive month in February 2025, falling by 0.3% to 101.1, primarily due to a significant drop in consumer expectations for future business conditions and a retreat in manufacturing new orders. While the LEI's six-month and annual growth rates remain negative, they have shown an upward trend since late 2023, indicating that economic headwinds might have moderated compared to the previous year. |
No 3 |
-0.3% |
|
Feb-2025 |
|
| |
|
|
|
The Conference Board Leading Economic Index® (LEI) for the US declined by 0.3% in January 2025, reaching 101.5 (2016=100), after a revised 0.1% increase in December 2024, indicating a continued but less severe slowdown compared to the prior six-month period. Overall, the LEI showed a 0.9% decline in the six months ending January 2025, which is an improvement from the 1.7% decline over the preceding six months. |
No 2 |
-0.3% |
|
Jan-2025 |
|
| |
|
|
|
In December 2024, leading economic indicators showed mixed signals. While some, like the AIER Business Conditions Monthly indicators and the Canadian international arrivals, continued to display strength or growth, the Conference Board's U.S. Leading Economic Index (LEI) saw a slight pullback. The U.S. LEI, a composite of 10 forward-looking components, fell 0.1% in December, primarily due to decreased consumer expectations and new orders, though it remained above recessionary thresholds. |
No 1 |
-0.1% |
|
Dec-2024 |
|
| |
|
|
|
|
|
|
|
|
| |
|
|
|
|
|
| |
|
|
|
|
|
|
|
|
|
|
|
|
|
|
|
Brief News | 2024 |
|
|
Leading Indicators | Business Activity |
|
Today's Week |
|
|
|
|
|
|
|
|
|
|
|
|
|
Leading Indicators (At 10:00 a.m ET)
| DATE/WEEK |
HIGHLIGHTS |
FOR |
LEI |
|
November 2024 leading economic indicators and existing home sales show positive growth. The US LEI rose in November for the first time since February 2022. LEI for the US increased by 0.3% in November 2024 to 99.7 (2016=100), nearly reversing its 0.4% decline in October. Over the six-month period between May and November 2024, the LEI declined by 1.6%, slightly less than its 1.9% decline over the previous six months. |
No 12 |
0.3% |
|
Nov-2024 |
|
| |
|
|
|
Economy on track to keep growing despite eighth straight decline in key gauge. Leading index has been negative for almost two years, even as U.S. expansion speeds up. The numbers: The leading indicators of the U.S. economy fell -0.4% for the eighth month in a row in October, but there’s still no sign the current four-year-old expansion is in trouble. The leading index dropped 0.3% last month, the Conference Board said Thursday, largely because of higher jobless claims, fewer building permits and a decline in manufacturing orders. |
No 11 |
-0.4% |
|
Oct-2024 |
|
| |
|
|
|
U.S. economy poised for somewhat slower growth, leading indicators signal. Leading index declines again in September. The numbers: The leading indicators of the U.S. economy fell again in September because of weakness in a few key industries such as housing and manufacturing, but not enough to suggest any sign of major trouble. The leading index dropped 0.5% last month, the Conference Board said Monday. The gauge has fallen in almost every month since early 2022 even though the economy has continued to expand. |
No 10 |
|
|
Sep-2024 |
|
| |
|
|
|
U.S. economic growth faces further challenges, a monthly series of indicators said, as gloomy consumer expectations persist, despite more interest-rates cuts to support activity still to come. The Conference Board said Thursday that its Leading Economic Index, or LEI, fell 0.2% in August, almost matching the 0.3% decline expected by economists polled by The Wall Street Journal. The leading index has fallen for six months straight, although the rate of decline has moderated since last year, The Conference Board said. The decline, which signals headwinds to economic growth ahead, was driven by weakening new orders, which recorded its lowest value since May 2023, said Justyna Zabinska-La Monica, senior manager for business-cycle indicators at The Conference Board. |
No 9 |
-0.2% |
|
Aug-2024 |
|
| |
|
|
|
U.S. leading indicators index falls 0.6% in July 2024, but is not signaling recession. The leading index for the economy fell 0.6% in July, the fifth straight monthly decline, the Conference Board said Monday. Economists polled by the Wall Street Journal had forecast a 0.4% decline. The Conference Board Leading Economic Index® (LEI) for the U.S. fell by 0.6 percent in July 2024 to 100.4 (2016=100), following a decline of 0.2 percent in June. Over the six-month period ending in July 2024, the LEI fell by 2.1 percent, a smaller rate of decline than its −3.1 percent over the six-month period between July 2023 and January 2024. |
No 8 |
-0.6% |
|
Jul-2024 |
|
| |
|
|
|
he Leading Economic Index® (LEI) decreased 0.2% in June to a reading of 101.1 (2016=100), following a 0.4% decline (upwardly revised) in May. Over the first half of 2024, the LEI fell 1.9%—a smaller decrease than its 2.9% contraction over the second half of 2023. The US LEI continued to trend down in June, but the contraction was smaller than in the past three months. |
No 7 |
-0.2% |
|
Jun-2024 |
|
| |
|
|
|
Leading Indicators Dip Along With Home Sales as Prices Reach Record High. The economy continues to cool but for now at least, avoiding a recession. A gauge of future economic activity fell in May by 0.5% as consumer sentiment weakened and the pace of new construction dipped. However, the Conference Board’s leading economic index’s drop over the past six months improved, to a 2% decline, from the prior period’s 3.4% reduction. And it continues to remain outside of what the business organization considers recession territory. |
No 6 |
-0.5% |
|
May-2024 |
|
| |
|
|
|
Leading Indicators Fall, Suggesting the Economy Is Softening. The Conference Board’s leading indicators index fell again in April, by 0.6%, signaling a weaker U.S. economy in the coming months. The decline follows a drop of 0.3% in March and brings the six-month contraction in the index to 1.9%, but that is a smaller decrease than its 3.5% decline over the previous six months. “Another decline in the U.S. LEI confirms that softer economic conditions lay ahead,” said Justyna Zabinska-La Monica, senior manager, business cycle indicators at the business organization. “Deterioration in consumers’ outlook on business conditions, weaker new orders, a negative yield spread, and a drop in new building permits fueled April’s decline.” |
No 5 |
-0.6% |
|
Apr-2024 |
|
| |
|
|
|
The Conference Board Leading Economic Index® (LEI) for the U.S. decreased by 0.3 percent in March 2024 to 102.4 (2016=100), after increasing by 0.2 percent in February. Over the six-month period between September 2023 and March 2024, the LEI contracted by 2.2 percent—a smaller decrease than the 3.4 percent decline over the previous six months. |
No 4 |
-0.3% |
|
Mar-2024 |
|
| |
|
|
|
Conference Board's Leading Indicators Index rises for first time in 2 years. The Conference Board said on Thursday its Leading Economic Index for the United States rose last month for the first time in two years on the strength of hours worked at U.S. factories and the surging stock market, among other factors, but the gauge of future activity still signals some headwinds to growth remain. The business research group's index rose 0.1% in February to 102.8, exceeding estimates in a Reuters poll of economists for a decline of 0.2%. It was the first increase in the index since February 2022 and comes a month after the organization abandoned its prediction that the economy would fall into a recession. |
No 3 |
0.1% |
|
Feb-2024 |
|
| |
|
|
|
The Conference Board Leading Economic Index® (LEI) for the U.S. fell by 0.4 percent in January 2024 to 102.7 (2016=100), following a 0.2 percent decline in December 2023. The LEI contracted by 3.0 percent over the six-month period between July 2023 and January 2024, a smaller decrease than the 4.1 percent decline over the previous six months. Conference Board gives up on U.S. recession call. The business research group's index, meant to be a gauge of future economic activity, fell 0.4% in January to 102.7, the lowest level since April 2020 when the U.S. was in a brief recession after the onset of the COVID-19 pandemic and related shutdowns. |
No 2 |
-0.4% |
|
Jan-2024 |
|
| |
|
|
|
U.S. leading indicators index falls for 10th straight month. A gauge of future U.S. economic activity tumbled for a 10th straight month in December with a widespread weakening outlook for manufacturing, home building and both job and financial markets. The Conference Board on Monday said its Leading Economic Index slid 1.0% in December following a downwardly revised decline of 1.1% in November. The decline exceeded all 22 forecasts in a poll of economists by Reuters, which had a median expectation of a decline of 0.7%. |
No 1 |
-0.1% |
|
Dec-2023 |
|
| |
|
|
|
|
|
|
|
|
| |
|
|
|
|
|
| |
|
|
|
|
|
|
|
|
|
|
|
|
|
|
|
Brief News | 2023 |
|
|
Leading Indicators | Business Activity |
|
Today's Week |
|
|
|
|
|
|
|
|
|
|
|
|
|
Leading Indicators (At 10:00 a.m ET)
| DATE/WEEK |
HIGHLIGHTS |
FOR |
LEI |
|
Economy still appears headed for recession, U.S. leading index signals. Survey of the economy falls for 20th month in a row. The U.S. economy has so far avoided a widely predicted recession. The numbers: The leading economic index declined 0.5% in November, falling for the 20th month in a row, and continued to signal a recession ahead. Economists polled by the Wall Street Journal had forecast a 0.5% drop in the leading index, a gauge of 10 indicators designed to show whether the economy is getting better or worse. |
No 12 |
-0.5% |
|
Nov-2023 |
|
| |
|
|
|
The Conference Board Leading Economic Index® (LEI) for the U.S. Declines Again in October. The Conference Board Leading Economic Index® (LEI) for the U.S. fell by 0.8 percent in October 2023 to 103.9 (2016=100), following a decline of 0.7 percent in September. The LEI contracted by 3.3 percent over the six-month period between April and October 2023, a smaller decrease than its 4.5 percent contraction over the previous six months (October 2022 to April 2023). The Conference Board Lagging Economic Index® (LAG) for the U.S. improved by 0.1 percent in October 2023 to 118.6 (2016 = 100), following the same rate of increase as in September. The LAG is up slightly by 0.3 percent over the six-month period from April to October 2023, down three-fold from its 0.9 percent growth over the previous six months. |
No 11 |
-0.8% |
|
Oct-2023 |
|
| |
|
|
|
U.S. leading economic indicators point lower for 18th straight month, but still no sign of recession. Leading economic indicator falls 0.7% in September. The U.S. economy is still growing despite some indicators of trouble ahead. The numbers: The leading economic index sank 0.7% in September and was negative for the 18th month in a row — but the U.S. is still on track to post a sizable increase in economic growth in the third quarter. Economists polled by the Wall Street Journal had forecast a 0.4% decline in the leading index, a gauge of 10 indicators designed to show whether the economy is getting better or worse. |
No 10 |
|
|
Sep-2023 |
|
| |
|
|
|
The Conference Board Leading Economic Index® (LEI) for the U.S. declined by 0.4 percent in August 2023 to 105.4 (2016=100), following a decline of 0.3 percent in July. The LEI is down 3.8 percent over the six-month period between February and August 2023—little changed from its 3.9 percent contraction over the previous six months (August 2022 to February 2023). With August's decline, the US Leading Economic Index has now fallen for nearly a year and a half straight, indicating the economy is heading into a challenging growth period and possible recession over the next year. |
No 9 |
-0.4% |
|
Aug-2023 |
|
| |
|
|
|
A gauge of future U.S. economic activity dropped for the 16th straight month in July, though the pace of decline slowed from earlier in the year, a survey showed on Thursday. The Conference Board said its Leading Economic Index fell 0.4% last month after declining 0.7% in June. Last month's decrease was in line with economists' expectations. Economists have been forecasting a recession since last year, but most now do not expect a downturn, with data ranging from retail sales to homebuilding surprising on the upside. Inflation is also slowing and the labor market is gradually cooling. |
No 8 |
-0.4% |
|
Jul-2023 |
|
| |
|
|
|
An index designed to track turns in U.S. business cycles fell for the 15th straight month in June, dragged down by a weakening consumer outlook and increased unemployment claims, marking the longest streak of decreases since the lead-up to the 2007-2009 recession. The Conference Board on Thursday said its Leading Economic Index, a measure that anticipates future economic activity, declined by 0.7% in June to 106.1 following a revised decrease of 0.6% in May. The decline was slightly greater than the median expectation among economists in a Reuters poll for a 0.6% decrease. The Conference Board said the contraction in the LEI is accelerating, falling 4.2% over the last six months compared to 3.8% between June and December 2022. |
No 7 |
-0.7% |
|
Jun-2023 |
|
| |
|
|
|
The Conference Board Leading Economic Index® (LEI) for the U.S. declined by 0.7 percent in May 2023 to 106.7 (2016=100), following a decline of 0.6 percent in April. The LEI is down 4.3 percent over the six-month period between November 2022 and May 2023—a steeper rate of decline than its 3.8 percent contraction over the previous six months from May to November 2022.The US LEI continued to fall in May as a result of deterioration in the gauges of consumer expectations for business conditions, ISM® New Orders Index, a negative yield spread, and worsening credit conditions,” said Justyna Zabinska-La Monica, Senior Manager, Business Cycle Indicators, at The Conference Board. “The US Leading Index has declined in each of the last fourteen months and continues to point to weaker economic activity ahead. Rising interest rates paired with persistent inflation will continue to further dampen economic activity. While we revised our Q2 GDP forecast from negative to slight growth, we project that the US economy will contract over the Q3 2023 to Q1 2024 period. The recession likely will be due to continued tightness in monetary policy and lower government spending. |
No 6 |
-0.7% |
|
May-2023 |
|
| |
|
|
|
LEI for the U.S. Declines Again in April 2023. The Leading Economic Index provides an early indication of significant turning points in the business cycle and where the economy is heading in the near term. The Coincident Economic Index provides an indication of the current state of the economy. Additional details are below. The Conference Board Leading Economic Index® (LEI) for theU.S. declined 0.6 percent in April 2023 to 107.5 (2016=100), following a decline of 1.2 percent in March. The LEI is down 4.4 percent over the six-month period between October 2022 and April 2023—a steeper rate of decline than its 3.8 percent contraction over the previous six months (April–October 2022). |
No 5 |
-0.6% |
|
Apr-2023 |
|
| |
|
|
|
U.S. March index of leading economic indicators falls 1.2%. March index of leading economic indicators, which fell by 1.2%. Now, first of all, what's the index of leading economic indicators? It's basically what it sounds like. It is an index. It is a compendium of different economic indicators that are put together to try to more forecast what is going to be happening next in the economy. And that 1.2% drop was versus a 7/10 of a percent of a drop that was estimated. It's versus just a half a percent the month prior. This is the March number that we're talking about, by the way. This is also, incidentally, the lowest since March of 2009. |
No 4 |
-1.2% |
|
Mar-2023 |
|
| |
|
|
|
Leading Indicators Fall Again in February, Signaling Recession on the Horizon. The Conference Board’s index of leading indicators, a widely followed gauge of future economic activity, fell in February by 0.3%, the 11th consecutive monthly decline. The index is now down 3.6% over the past six months following a 3% drop in the prior six months. The LEI for the US fell again in February, marking its eleventh consecutive monthly decline,” said Justyna Zabinska-La Monica, senior manager, business cycle indicators, at the business organization. “Negative or flat contributions from eight of the index’s ten components more than offset improving stock prices and a better-than-expected reading for residential building permits.” |
No 3 |
-0.3% |
|
Feb-2023 |
|
| |
|
|
|
The U.S. economy is still headed toward recession this year, but the labor market and personal income remain robust, according to the Conference Board. The business organization’s leading economic index fell 0.3% in January, meeting expectations but that was less severe of a drop than the 0.8% seen in December. “The US LEI remained on a downward trajectory, but its rate of decline moderated slightly in January,” said Ataman Ozyildirim, senior director, economics, at the board. “Among the leading indicators, deteriorating manufacturing new orders, consumers’ expectations of business conditions, and credit conditions more than offset strengths in labor markets and stock prices to drive the index lower in the month.” |
No 2 |
-0.3% |
|
Jan-2023 |
|
| |
|
|
|
U.S. leading indicators index falls for 10th straight month. A gauge of future U.S. economic activity tumbled for a 10th straight month in December with a widespread weakening outlook for manufacturing, home building and both job and financial markets. The Conference Board on Monday said its Leading Economic Index slid 1.0% in December following a downwardly revised decline of 1.1% in November. The decline exceeded all 22 forecasts in a poll of economists by Reuters, which had a median expectation of a decline of 0.7%. |
No 1 |
-1.0% |
|
Dec-2022 |
|
| |
|
|
|
|
|
|
|
|
| |
|
|
|
|
|
| |
|
|
|
|
|
|
|
|
|
|
|
|
|
|
|
Brief News | 2022 |
|
|
Leading Indicators | Business Activity |
|
Today's Week |
|
|
|
|
|
|
|
|
|
|
|
|
|
Leading Indicators (At 10:00 a.m ET)
| DATE/WEEK |
HIGHLIGHTS |
FOR |
LEI |
|
Leading indicators fall for ninth month in a row and point to recession in 2023. Leading economic index slumps 1% in November. The numbers: The U.S. leading index fell a sharp 1% in November to mark the ninth decline in a row, extending a downturn that began last spring and points to a weakening economy. Economists polled by The Wall Street Journal had forecast a 0.5% decline. U.S. Nov leading indicators fell 0.2 pct. The Conference Board index of leading, coincident and lagging indicators (2004=100) and percent changes from previous months, seasonally adjusted. |
No 12 |
-1.0% |
|
Nov-2022 |
|
| |
|
|
|
The Conference Board, a non-partisan, not-for-profit think tank founded in 1916, released today (11-18-22) the Leading Economic Index® (LEI) for the US in October 2022. According to the report, the LEI declined 0.8% in October to a reading of 114.9 (2016=100), following a 0.5% drop in September and remaining unchanged in August. The LEI has dropped 3.2% over the six-month period from April to October 2022, a reversal from its 0.5% growth over the previous six-month period. The Conference Board Coincident Economic Index® (CEI) increased by 0.2% in October to a reading of 109.3 (2016=100) following a 0.2% increase in September and a 0.1% increase in August. The CEI has increased by 1.1% over the six-month period from April to October 2022, faster than its growth of 0.9% over the previous six-month period. |
No 11 |
-0.8% |
|
Oct-2022 |
|
| |
|
|
|
The economy sent a low-key signal Thursday that a recession is looming — and that the Federal Reserve could be making a policy mistake by continuing to try to slow things down. According to the Conference Board’s Leading Economic Indicators index, conditions worsened in September, with the gauge down 0.4% from the month before and off 2.8% for the six-month period. “The US LEI fell again in September and its persistent downward trajectory in recent months suggests a recession is increasingly likely before year end,” said Ataman Ozyildirim, senior director of economics at the Conference Board. Ozyildrim noted that the weakness in the index was “widespread” as high inflation, a decelerating jobs picture and tighter credit conditions are pressuring the economy. The Conference Board’s Leading Economic Indicators index indicated that conditions worsened in September. While not usually considered a major data point, the LEI, combined with Fed rate hikes, is signaling trouble for the economy. |
No 10 |
-0.4% |
|
Sep-2022 |
|
| |
|
|
|
A gauge of future U.S. economic activity declined for a sixth straight month in August, potentially signaling a recession amid large interest rate increases from the Federal Reserve. The Conference Board said on Thursday its Leading Economic Index fell 0.3% last month after decreasing 0.5% in July. Economists polled by Reuters had forecast the index dipping 0.1%. The index dropped 2.7% between February and August, a reversal from its 1.7% increase over the prior six months. The U.S. central bank delivered a 75-basis-point rate hike on Wednesday, its third straight increase of that magnitude. It signaled more large increases to come this year. |
No 9 |
-0.3% |
|
Aug-2022 |
|
| |
|
|
|
The Conference Board Leading Economic Index® (LEI)for theU.S. decreased by 0.4 percent in July 2022 to 116.6 (2016=100), after declining by 0.7 percent in June. The LEI was down by 1.6 percent over the six-month period from January to July 2022, a reversal from its 1.6 percent growth over the previous six months. The US LEI declined for a fifth consecutive month in July, suggesting recession risks are rising in the near term. The Conference Board. “Consumer pessimism and equity market volatility as well as slowing labor markets, housing construction, and manufacturing new orders suggest that economic weakness will intensify and spread more broadly throughout the US economy. The Conference Board projects the US economy will not expand in the third quarter and could tip into a short but mild recession by the end of the year or early 2023.” |
No 8 |
-0.4% |
|
Jul-2022 |
|
| |
|
|
|
Leading Indicators Point to Stalling Economy as Housing Continues to Slow. The Conference Board Leading Economic Index® (LEI), a gauge of the economic outlook over the next three to six months, fell 0.8 percent in June to 117.1, the fourth consecutive month of decline. According to a Conference Board press release, "Consumer pessimism about future business conditions, moderating labor market conditions, falling stock prices, and weaker manufacturing new orders drove the LEI's decline in June." |
No 7 |
-0.8% |
|
Jun-2022 |
|
| |
|
|
|
U.S. leading indicator falls again in May. A gauge of future U.S. economic activity declined further in May, pointing to slowing growth. The Conference Board said on Friday its Leading Economic Index fell 0.4% last month, matching the decline in April. The drop was in line with economists' expectations. "The index is still near a historic high, but suggests weaker economic activity is likely in the near term, and tighter monetary policy is poised to dampen economic growth even further," said Ataman Ozyildirim, the Conference Board's senior director of economic research. |
No 6 |
-0.4% |
|
May-2022 |
|
| |
|
|
|
The Conference Board Leading Economic Index (LEI)for theU.S. decreased by 0.3 percent in April to 119.2 (2016 = 100), following a 0.1 percent increase in March. The LEI is now up 0.9 percent over the six-month period from October 2021 to April 2022. The US LEI declined in April largely due to weak consumer expectations and a drop in residential building permits. Overall, the US LEI was essentially flat in recent months which is in line with a moderate growth outlook in the near-term. A range of downside risks—including inflation, rising interest rates, supply chain disruptions, and pandemic-related shutdowns, particularly in China—continue to weigh on the outlook. Nevertheless, we project the US economy should resume expanding in Q2 following Q1’s contraction in real GDP. Despite downgrades to previous forecasts, The Conference Board still projects 2.3 percent year-over-year US GDP growth in 2022. |
No 5 |
-0.3% |
|
Apr-2022 |
|
| |
|
|
|
The LEI is not expected to show any effects from Russia's invasion, rising 0.3 in March 2022 percent to match February's rise. The Conference Board Leading Economic Index® (LEI) for the U.S. increased by 0.3 percent in March to 119.8 (2016 = 100), following a 0.6 percent increase in February. The LEI increased by 1.9 percent in the sixmonth period from September 2021 to March 2022. “The US LEI rose again in March despite headwinds from the war in Ukraine,” said Ataman Ozyildirim, Senior Director of Economic Research at The Conference Board. “This broad-based improvement signals economic growth is likely to continue through 2022 despite volatile stock prices and weakening business and consumer expectations. |
No 4 |
0.3% |
|
Mar-2022 |
|
| |
|
|
|
Leading Indicators Rise in February, Signaling Continued Growth for the Economy. The report does not take into account the effects of the war in Ukraine. A gauge of future economic activity rose 0.3% in February after a small decline the month before, the Conference Board reported on Friday. The organization’s leading indicators index rose to 119.9. The US LEI rose slightly in February, partially reversing January’s decline,” said Ataman Ozyildirim, senior director of economic research at The Conference Board. “However, the latest results do not reflect the full impact of the Russian invasion of Ukraine, which could lower the trajectory for the US LEI and signal slower-than-anticipated economic growth in the first half of the year. |
No 3 |
0.3% |
|
Feb-2022 |
|
| |
|
|
|
January 2022 Leading Indicators: -0.3% to 119.6 vs. +0.2% consensus and +0.8% prior. A gauge of future U.S. economic activity fell in January for the first time in nearly a year amid a resurgence in COVID-19 cases, high inflation and supply chain disruptions, supporting expectations that growth would slow in the first quarter. The Conference Board said on Friday its Leading Economic Index dropped 0.3% last month, the first decline since February 2021, after increasing 0.7% in December. Economists polled by Reuters had expected the index to rise 0.2%. Gross domestic product estimates for the first quarter are mostly below a 2.0% annualized rate. The economy grew at a 6.9% pace in the fourth quarter. |
No 2 |
-0.3% |
|
Jan-2022 |
|
| |
|
|
|
The Conference Board Leading Economic Index® (LEI) for the U.S. increased by 0.8 percent in December 2021 to 120.8 (2016 = 100), following a 0.7 percent increase in November and a 0.7 percent increase in October. The U.S. LEI ended 2021 on a rising trajectory, suggesting the economy will continue to expand well into the spring. For the first quarter, headwinds from the Omicron variant, labor shortages, and inflationary pressures—as well as the Federal Reserve’s expected interest rate hikes—may moderate economic growth. The Conference Board forecasts GDP growth for Q1 2022 to slow to a relatively healthy 2.2 percent (annualized). Still, for all of 2022, we forecast the US economy will expand by a robust 3.5 percent—well above the pre-pandemic trend growth. |
No 1 |
0.8% |
|
Dec-2021 |
|
| |
|
|
|
|
|
|
|
|
| |
|
|
|
|
|
| |
|
|
|
|
|
|
|
|
|
|
|
|
|
|
|
Brief News | 2021 |
|
|
Leading Indicators | Business Activity |
|
Today's Week |
|
|
|
|
|
|
|
|
|
|
|
|
|
Leading Indicators (At 10:00 a.m ET)
| DATE/WEEK |
HIGHLIGHTS |
FOR |
LEI |
|
The Conference Board Leading Economic Index (LEI for the U.S. increased by 1.1 percent in November 2021 to 119.9 (2016 = 100), following a 0.9 percent increase in October and a 0.3 percent increase in September. The U.S. LEI rose sharply again in November, suggesting the current economic expansion will continue into the first half of 2022, Inflation and continuing supply chain disruptions, as well as a resurgence of COVID-19, pose risks to GDP growth in 2022. Still, the economic impact of these risks may be contained. The Conference Board forecasts real GDP growth to strengthen in Q4 2021 to about 6.5 percent (annualized rate), before moderating to a still healthy rate of 2.2 percent in Q1 2022. |
No 12 |
1.1% |
|
Nov-2021 |
|
| |
|
|
|
The Conference Board Leading Economic Index (LEI) for the U.S. increased by 0.9 percent in October 2021 to 118.3 (2016 = 100), following a 0.1 percent increase in September and a 0.7 percent increase in August. The U.S. LEI rose sharply in October suggesting the current economic expansion will continue into 2022 and may even gain some momentum in the final months of this year.Gains were widespread among the leading indicators, with only the average workweek and consumers’ outlook making negative contributions. However, rising prices and supply chain bottlenecks pose challenges to growth and are not expected to dissipate until well into 2022. Despite these headwinds, The Conference Board forecasts growth to remain strong in the fourth quarter at around 5.0 percent (annualized rate), before moderating to a still historically robust rate of 2.6 percent in Q1 2022. |
No 11 |
0.9% |
|
Oct-2021 |
|
| |
|
|
|
The Conference Board Leading Economic Index® (LEI) for the U.S. increased by 0.2 percent in September 2021 to 117.5 (2016 = 100), following a 0.8 percent increase in August and a 0.9 percent increase in July. The U.S. LEI rose again in September, though at a slower rate, suggesting the economy remains on a more moderate growth trajectory compared to the first half of the year, The Delta variant, rising inflation fears, and supply chain disruptions are all creating headwinds for the US economy. Despite the LEI’s slower growth in recent months, the strengths among the components remain widespread. Indeed, The Conference Board continues to forecast strong growth ahead: 5.7 percent year-over-year for 2021 and 3.8 percent for 2022. |
No 10 |
0.2% |
|
Sep-2021 |
|
| |
|
|
|
The Conference Board Leading Economic Index® (LEI) for the U.S. increased by 0.9 percent in August 2021 to 117.1 (2016 = 100), following a 0.8 percent increase in July and a 0.6 percent increase in June. The U.S. LEI rose sharply in August and remains on a rapidly rising trajectory. While the Delta variant—alongside rising inflation fears—could create headwinds for labor markets and the consumer spending outlook in the near term, the trend in the LEI is consistent with robust economic growth in the reminder of the year. Real GDP growth for 2021 is expected to reach nearly 6.0 percent year-over-year, before easing to a still-robust 4.0 percent for 2022. |
No 9 |
0.8% |
|
Aug-2021 |
|
| |
|
|
|
The Conference Board Leading Economic Index® (LEI) for the U.S. increased by 0.9 percent in July 2021 to 116.0 (2016 = 100), following a 0.5 percent increase in June and a 1.2 percent increase in May. The U.S. LEI registered another large gain in July, with all components contributing positively. The Leading Index’s overall upward trend, which started with the end of the pandemic-induced recession in April 2020, is consistent with strong economic growth in the second half of the year. While the Delta variant and/or rising inflation fears could create headwinds for the US economy in the near term, we expect real GDP growth for 2021 to reach 6.0 percent year-over-year, before easing to a still robust 4.0 percent growth rate for 2022. |
No 8 |
0.9% |
|
Jul-2021 |
|
| |
|
|
|
The Conference Board Leading Economic Index (LEI) for the U.S. increased by 0.7 percent in June 2021 to 115.1 (2016 = 100), following a 1.2 percent increase in May and a 1.3 percent increase in April. June’s gain in the U.S. LEI was broad-based and, despite negative contributions from housing permits and average workweek, suggests that strong economic growth will continue in the near term,” said Ataman Ozyildirim, Senior Director of Economic Research at The Conference Board. “While month-over-month growth slowed somewhat in June, the LEI’s overall upward trend—which started with the end of the pandemic-induced recession in April 2020—accelerated further in Q2. The Conference Board still forecasts year-over-year real GDP growth of 6.6 percent for 2021 and a healthy 3.8 percent for 2022. |
No 7 |
0.7% |
|
Jun-2021 |
|
| |
|
|
|
The Conference Board Leading Economic Index® (LEI) for the U.S. increased by 1.3 percent in May 2021 to 114.5 (2016 = 100), following a 1.3 percent increase in April and a 1.4 percent increase in March. After another large improvement in May, the U.S. LEI now stands above its previous peak reached in January 2020 (112.0), suggesting that strong economic growth will continue in the near term. Strengths among the leading indicators were widespread, with initial claims for unemployment insurance making the largest positive contribution to the index; housing permits made this month’s only negative contribution. The Conference Board now forecasts real GDP growth in Q2 could reach 9 percent (annualized), with year-over-year economic growth reaching 6.6 percent for 2021. |
No 6 |
1.3% |
|
May-2021 |
|
| |
|
|
|
The Conference Board Leading Economic Index® (LEI) for the U.S. increased by 1.6 percent in April 2021 to 113.3 (2016 = 100), following a 1.3 percent increase in March and a 0.1 percent decline in February. “With April’s large monthly gain to start the second quarter, the U.S. LEI has now recovered fully from its COVID-19 contraction—surpassing the index’s previous peak, reached at the very onset of the global pandemic in January 2020, While employment and production have not recovered to their pre-pandemic levels yet, the U.S. LEI suggests the economy’s upward trend should continue and growth may even accelerate in the near term. The Conference Board now forecasts real GDP could grow around 8 to 9 percent (annualized) in the second quarter, with year-over-year economic growth reaching 6.4 percent for 2021. |
No 5 |
1.6% |
|
Apr-2021 |
|
| |
|
|
|
The index of U.S. leading economic indicators rose 1.3% in March 2021, The Conference Board said Thursday. All 10 components of the index were positive, suggesting economic momentum in the near term. The firm now projects year-over-year economic growth could reach 6% in 2021 The U.S. LEI rose sharply in March, which more than offset February’s slightly negative revised figure, The improvement in the U.S. LEI, with all ten components contributing positively, suggests economic momentum is increasing in the near term. The widespread gains among the leading indicators are supported by an accelerating vaccination campaign, gradual lifting of mobility restrictions, as well as current and expected fiscal stimulus. The recent trend in the U.S. LEI is consistent with the economy picking up in the coming months, and The Conference Board now projects year-over-year growth could reach 6.0 percent in 2021. |
No 4 |
1.3% |
|
Mar-2021 |
|
| |
|
|
|
U.S. Leading indicators misses estimates. February 2021 Leading Indicators: +0.2% to 110.5 vs. +0.3% consensus and +0.5% prior.The Conference Board Leading Economic Index (LEI) for the U.S. increased 0.2 percent in February to 110.5 (2016 = 100), following a 0.5 percent increase in January and a 0.4 percent increase in December. The U.S. LEI continued rising in February, suggesting economic growth should continue well into this year, “Indeed, the acceleration of the vaccination campaign and a new round of large fiscal supports are not yet fully reflected in the LEI. With those developments, The Conference Board now expects the pace of growth to improve even further this year, with the U.S. economy expanding by 5.5 percent in 2021. |
No 3 |
0.2% |
|
Feb-2021 |
|
| |
|
|
|
The Conference Board Leading Economic Index LEI) for the U.S. increased 0.5 percent in January 2021 to 110.3 (2016 = 100), following a 0.4 percent increase in December and a 0.9 percent increase in November. “While the pace of increase in the U.S. LEI has slowed since mid-2020, January’s gains were broad-based and suggest economic growth should improve gradually over the first half of 2021, As the vaccination campaign against COVID-19 accelerates, labor markets and overall growth are likely to continue improving through the rest of this year as well. The Conference Board now expects the U.S. economy to expand by 4.4 percent in 2021, after a 3.5 percent contraction in 2020. |
No 2 |
0.5% |
|
Jan-2021 |
|
| |
|
|
|
The Conference Board Leading Economic Index (LEI) for the U.S. increased 0.3 percent in December 2020 to 109.5 (2016 = 100), following a 0.7 percent increase in November and a 0.9 percent increase in October. The US LEI’s slowing pace of increase in December suggests that US economic growth continues to moderate in the first quarter of 2021. Improvements in the US LEI were very broad-based among the leading indicators, except for rising initial claims for unemployment insurance and a mixed consumer outlook on business and economic conditions. While the resurgence of COVID-19 and weak labor markets remain barriers to growth, The Conference Board expects the economy to expand by at least 2.0 percent (annual rate) in Q1 and then gain momentum throughout the year. |
No 1 |
0.3% |
|
Dec-2020 |
|
| |
|
|
|
|
|
|
|
|
| |
|
|
|
|
|
| |
|
Legends: |
|
Delayed |
|
Positive View |
|
Negative View |
|
Neutral View |
|
Non Available |
|
|
|
|
|
|
|
|
|
|
|
|
|
|
|
|
|
|
|
|
| |
|
|
|
|
|
|
|
|
|
|
|
|
|
|
|
|
|
|
|
|
|
Definitions | Explain |
|
|
Leading Indicators | Business Activity |
|
Today's Week |
|
|
|
|
|
|
|
|
|
|
|
|
| |
|
|
|
|
| |
|
| LEADING INDICATORS |
The Leading Indicators (LEI) is a weighted gauge of 10 indicators that are designed to signal business cycle peaks and troughs.
The Leading Indicators report is, for the most part, a compendium of previously announced economic indicators: new orders, jobless claims, money supply, average workweek, building permits, and stock prices.
Therefore, the report is extremely predictable and of very little interest to the market. Though this series does have some predictive qualities, it is a common criticism that it has predicted "nine of the last six" recessions.
The Commerce Department recently privatized the leading indicators series. The collection and publishing of these data is now done by the non-profit Conference Board, which also produces the consumer confidence index.
Do not Confuse with:
Leading Index for the United States
The State Leading Indexes, (from the Federal Reserve Bank of Philadelphia), for each state predicts the six-month growth rate ofthe state's coincident index. In addition to the coincident index, themodels include other variables that lead the economy: state-levelhousing permits (1 to 4 units), state initial unemployment insuranceclaims, delivery times from the Institute for Supply Management (ISM)manufacturing survey, and the interest rate spread between the 10-yearTreasury bond and the 3-month Treasury bill.
|
|
|
| |
|
|
|
|
|
|
|
|
|
|
|
|
|
|
|
|
|
|
|
|
|
Data | Source |
|
|
Leading Indicators | Business Activity |
|
Today's Week |
|
|
|
|
|
|
|
|
|
|
|
|
| |
|
|
|
|
|
|
| DATA INFORMATION |
LEADING INDICATORS (LEI) |
| SOURCE |
The Conference Board |
| WEB |
http://www.conference-board.org |
| FREQUENCY |
Monthly |
| AVAILABILITY |
Third week of the month. |
| COVERAGE |
Data are for the previous month. Data for June are released in July. |
| REVISIONS |
Yes |
| IMPORTANCE |
Business Activity - Low Importance |
|
| |
|
|
|
|
|
|
|
|
|
|
|
|