 |
 |
|
 |
Current Account | Growth |
|
 |
|
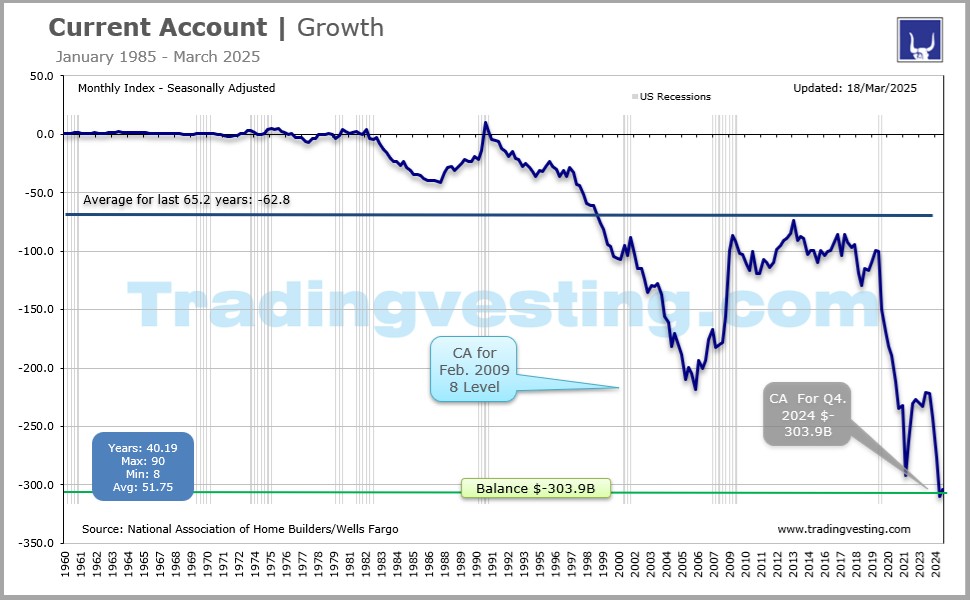
The Commerce Department said the current account measures the flow of goods, services and investments into and out of the United States. The current account is recorded in the Balance of Payments (BOP). Read More...
|
|
|
|
|
|
|
| |
|
| |
 6. Current Account (6 of 6) 6. Current Account (6 of 6) 1. Real GDP (1 of 6) 1. Real GDP (1 of 6) 2. US Trade Balance (2 of 6) 2. US Trade Balance (2 of 6) 3. US Trade in Goods (3 of 6) 3. US Trade in Goods (3 of 6) 4. Construction Spending (4 of 6) 4. Construction Spending (4 of 6) 5. Corporate Profit (5 of 6) 5. Corporate Profit (5 of 6)
|
 |
|
|
|
|
| |
|
→ Big Chart |
|
→ Release |
|
| |
|
|
|
|
|
|
|
|
|
|
|
|
|
|
|
|
|
|
|
 |
|
Big Chart | Large Data |
 |
|
Current Account | Growth |
|
Today's Week |
 |
|
|
|
|
|
|
|
|
|
|
|
|
|
| |
|
|
|
|
|
|
|
|
|
|
|
|
|
| |
|
|
|
|
|
|
|
|
|
|
|
|
|
|
|
|
|
|
|
|
|
Release Schedule | 2026 |
|
|
Current Account | Growth |
|
Today's Week |
|
|
|
|
|
|
|
|
|
|
|
|
|
Current Account (At 8:30 a.m ET)
| SCHEDULE 2026 |
No 1 |
No 2 |
No 3 |
No 4 |
| Release | Week |
|
|
|
|
| Release | Date |
|
|
|
|
| Release | Day |
|
|
|
|
 |
|
|
|
|
| Prior |
$-226.4 B |
... |
... |
... |
| Prior Revised: |
$-239.1 B |
... |
... |
... |
| Consensus: |
... |
... |
... |
... |
| Consensus Low: |
... |
... |
... |
... |
| Consensus High: |
... |
... |
... |
... |
| Consensus: |
$-190.7 B |
... |
... |
... |
| RELEASED RATING: |
|
|
|
|
| Released For: |
QUARTER 4 - 2025 |
QUARTER 1- 2026 |
QUARTER 2 - 2026 |
QUARTER 3 - 2026 |
|
|
|
|
|
|
|
| |
|
| |
|
|
|
|
|
|
|
|
|
|
|
Release Schedule | 2025 |
|
|
Current Account | Growth |
|
Today's Week |
|
|
|
|
|
|
|
|
|
|
|
|
|
Current Account (At 8:30 a.m ET)
| SCHEDULE 2025 |
No 1 |
No 2 |
No 3 |
No 4 |
| Release | Week |
|
|
|
|
| Release | Date |
|
|
|
|
| Release | Day |
|
|
|
|
|
|
|
|
|
| Prior |
$-310.9 B |
$-303.9 B |
$-450.2 B |
$-251.3 B |
| Prior Revised: |
$-310.3 B |
$-312.0 B |
$-439.8 B |
... |
| Consensus: |
$-330.0 B |
$-442.8 B |
$-302.0 B |
... |
| Consensus Low: |
$-340.0 B |
$--463.8 B |
$--380.0 B |
... |
| Consensus High: |
$-309.0 B |
$-430.0 B |
$-256.0 B |
... |
| Consensus: |
$-303.9 B |
$-450.2 B |
$-251.3 B |
$-226.4 B |
| RELEASED RATING: |
|
|
|
|
| Released For: |
QUARTER 4 - 2024 |
QUARTER 1- 2025 |
QUARTER 2 - 2025 |
QUARTER 3 - 2025 |
|
|
|
|
|
|
|
| |
|
| |
|
|
|
|
|
|
|
|
|
|
|
Release Schedule | 2024 |
|
|
Current Account | Growth |
|
Today's Week |
|
|
|
|
|
|
|
|
|
|
|
|
|
Current Account (At 8:30 a.m ET)
| SCHEDULE 2024 |
No 1 |
No 2 |
No 3 |
No 4 |
| Release | Week |
|
|
|
|
| Release | Date |
|
|
|
|
| Release | Day |
|
|
|
|
|
|
|
|
|
| Prior |
$-200.3 B |
$-194.8 B |
$-237.6 B |
$-266.8 B |
| Prior Revised: |
$-196.4 B |
$-221.8 B |
$-241.0 B |
$-275.0 B |
| Consensus: |
$-209.0 B |
$-205.5 B |
$-259.5 B |
$-287.0 B |
| Consensus Low: |
$-210.0 B |
$-207.0 B |
$-262.0 B |
$-294.0 B |
| Consensus High: |
$-195.0 B |
$-190.0 B |
$-252.0 B |
$-276.4 B |
| Consensus: |
$-194.8 B |
$-237.6 B |
$-266.8 B |
$-310.9 B |
| RELEASED RATING: |
|
|
|
|
| Released For: |
QUARTER 4 - 2023 |
QUARTER 1- 2024 |
QUARTER 2 - 2024 |
QUARTER 3 - 2024 |
|
|
|
|
|
|
|
| |
|
| |
|
|
|
|
|
|
|
|
|
|
|
Release Schedule | 2023 |
|
|
Current Account | Growth |
|
Today's Week |
|
|
|
|
|
|
|
|
|
|
|
|
|
Current Account (At 8:30 a.m ET)
| SCHEDULE 2023 |
No 1 |
No 2 |
No 3 |
No 4 |
| Release | Week |
|
|
|
|
| Release | Date |
|
|
|
|
| Release | Day |
|
|
|
|
|
|
|
|
|
| Prior |
$-217.1 B |
$-206.8 B |
$-219.3 B |
$-212.1 B |
| Prior Revised: |
$-219.0 B |
$-216.2 B |
$-214.5 B |
$-216.8 B |
| Consensus: |
$-213.2 B |
$-218.2 B |
$-220.6 B |
$-203.0 B |
| Consensus Low: |
$-220.0 B |
$-221.0 B |
$-228.6 B |
$-225.0 B |
| Consensus High: |
$-186.0 B |
$-192.5 B |
$-210.0 B |
$-190.3 B |
| Consensus: |
$-206.8 B |
$-219.3 B |
$-212.1 B |
$-200.3 B |
| RELEASED RATING: |
|
|
|
|
| Released For: |
QUARTER 4 - 2022 |
QUARTER 1- 2023 |
QUARTER 2 - 2023 |
QUARTER 3 - 2023 |
|
|
|
|
|
|
|
| |
|
| |
|
|
|
|
|
|
|
|
|
|
|
Release Schedule | 2022 |
|
|
Current Account | Growth |
|
Today's Week |
|
|
|
|
|
|
|
|
|
|
|
|
|
Current Account (At 8:30 a.m ET)
| SCHEDULE 2022 |
No 1 |
No 2 |
No 3 |
No 4 |
| Release | Week |
|
|
|
|
| Release | Date |
|
|
|
|
| Release | Day |
|
|
|
|
|
|
|
|
|
| Prior |
$-214.8 B |
$-217.9 B |
$-291.4 B |
$-251.1 B |
| Prior Revised: |
$-219.9 B |
$-224.8 B |
$-282.5 B |
$-238.7 B |
| Consensus: |
$-217.6 B |
$-277.0 B |
$-259.5 B |
$-225.0 B |
| Consensus Low: |
$-230.0 B |
$-290.0 B |
$-273.5 B |
$-253.0 B |
| Consensus High: |
$-217.8 B |
$-249.5 B |
$-255.0 B |
$-201.0 B |
| Consensus: |
$-217.9 B |
$-291.4 B |
$-251.1 B |
$-217.1 B |
| RELEASED RATING: |
|
|
|
|
| Released For: |
QUARTER 4 - 2021 |
QUARTER 1- 2022 |
QUARTER 2 - 2022 |
QUARTER 3 - 2022 |
|
|
|
|
|
|
|
| |
|
| |
|
|
|
|
|
|
|
|
|
|
|
Release Schedule | 2021 |
|
|
Current Account | Growth |
|
Today's Week |
|
|
|
|
|
|
|
|
|
|
|
|
|
Current Account (At 8:30 a.m ET)
| SCHEDULE 2021 |
No 1 |
No 2 |
No 3 |
No 4 |
| Release | Week |
|
|
|
|
| Release | Date |
|
|
|
|
| Release | Day |
|
|
|
|
|
|
|
|
|
| Prior |
$-178.5 B |
$-188.5 B |
$-195.7 B |
$-190.3 B |
| Prior Revised: |
$-180.9 B |
$-175.1 B |
$-189.4 B |
$-198.3 B |
| Consensus: |
$-186.4 B |
$-207.0 B |
$-190.0 B |
$-204.8 B |
| Consensus Low: |
$-209.0 B |
$-208.0 B |
$-198.0 B |
$-207.0 B |
| Consensus High: |
$-184.0 B |
$-189.9 B |
$-186.1 B |
$-200.0 B |
| Current Account: |
$-188.5 B |
$-195.7 B |
$-190.3 B |
$-214.8 B |
| RELEASED RATING: |
|
|
|
|
| Released For: |
QUARTER 4 - 2020 |
QUARTER 1- 2021 |
QUARTER 2 - 2021 |
QUARTER 3 - 2021 |
|
|
|
|
|
|
|
| |
|
|
| |
|
|
|
|
|
|
|
|
|
|
|
|
Current Account (At 8:30 a.m ET)
| DATE/WEEK |
HIGHLIGHTS |
FOR |
ACTUAL |
|
US current account. |
No 4 |
|
|
Q3-2026 |
|
| |
|
|
|
US current account. |
No 3 |
... |
|
Q2-2026 |
|
| |
|
|
|
US current account. |
No 2 |
|
|
Q1-2026 |
|
| |
|
|
|
US current account. |
No 1 |
... |
|
Q4-2025 |
|
| |
|
|
|
|
|
|
|
|
| |
|
|
|
|
|
| |
|
|
|
|
|
|
Current Account (At 8:30 a.m ET)
| DATE/WEEK |
HIGHLIGHTS |
FOR |
ACTUAL |
|
US current account. Based on data released by the U.S. Bureau of Economic Analysis (BEA) and updated in early 2026, here is the US current account situation for late 2025: Third Quarter 2025 Performance: The U.S. current-account deficit narrowed to $226.4 billion in the third quarter of 2025, down by $22.8 billion (9.2%) from a revised second-quarter deficit of $249.2 billion. The reduction in the deficit was driven by a shift in the primary income balance from a deficit to a surplus, an expanded surplus in services, and a reduced deficit in goods, resulting from lower imports as companies adjusted to new tariffs. |
No 4 |
|
|
Q3-2025 |
|
| |
|
|
|
The U.S. current account deficit contracted by the most on record in the second quarter as a flood of imports subsided. The Commerce Department's Bureau of Economic Analysis said on Tuesday the current account deficit, which measures the flow of goods, services and investments into and out of the country, decreased by a record $188.5 billion, or 42.9%, to $251.3 billion, reversing the prior month's jump.Data for the first quarter was revised to show the gap at $439.8 billion, still an all-time high, instead of $450.2 billion as previously reported. Economists polled by Reuters had forecast the current account deficit declining to $256.8 billion last quarter. The deficit represented 3.3% of gross domestic product, the smallest share since the third quarter of 2023, down from 5.9% in the January-March quarter. It peaked at 6.3% in the third quarter of 2006. President Donald Trump's tariffs have caused wild swings in goods imports this year, undercutting gross domestic product in the first quarter before boosting growth in the April-June quarter. Trump's unpredictable economic, trade and security policies have also spurred questions over whether the dollar, which accounts for 58% of the world's reserves, can remain at the center of the global monetary system. |
No 3 |
$-251.3B |
|
Q2-2025 |
|
| |
|
|
|
US current account surges to record high in first quarter. The U.S. current account deficit widened to a record high in the first quarter as businesses front-loaded imports to avoid President Donald Trump's hefty tariffs on imported goods. The Commerce Department's Bureau of Economic Analysis said on Tuesday the current account deficit, which measures the flow of goods, services and investments into and out of the country, jumped $138.2 billion, or 44.3%, to an all-time high of $450.2 billion. Data for the fourth quarter was revised to show the gap at $312.0 billion instead of $303.9 billion as previously reported. |
No 2 |
|
|
Q1-2025 |
|
| |
|
|
|
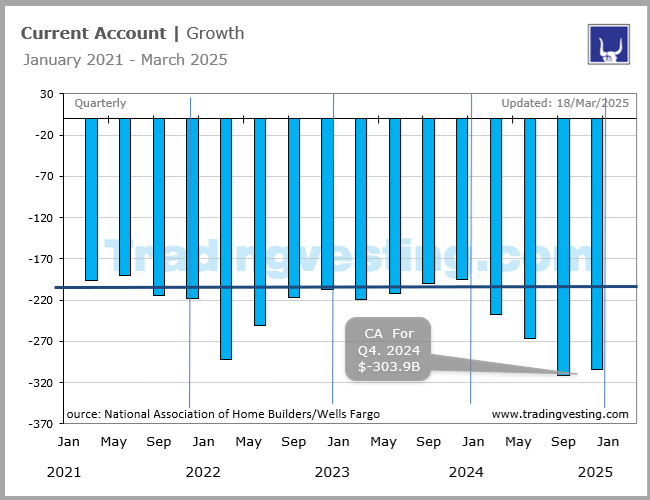
US current account deficit narrows in fourth quarter. The U.S. current account deficit contracted in the fourth quarter, but the improvement could be temporary as goods imports surged to a record high in January, driven by businesses preemptively buying foreign merchandise to avoid tariffs. The Commerce Department's Bureau of Economic Analysis said on Thursday the current account deficit, which measures the flow of goods, services and investments into and out of the country, narrowed $6.3 billion, or 2.0% to $303.9 billion. |
No 1 |
$-303.9B |
|
Q4-2024 |
|
| |
|
|
|
|
|
|
|
|
| |
|
|
|
|
|
| |
|
|
|
|
|
|
Current Account (At 8:30 a.m ET)
| DATE/WEEK |
HIGHLIGHTS |
FOR |
ACTUAL |
|
US current account deficit hits record high in the third quarter. The U.S. current account deficit widened to a record high in the third quarter amid a surge in imports and lower primary income receipts. The Commerce Department's Bureau of Economic Analysis said on Wednesday that the current account deficit, which measures the flow of goods, services and investments into and out of the country, increased $35.9 billion, or 13.1%, to an all-time high of $310.9 billion last quarter. Economists polled by Reuters had forecast the current account deficit at $284.0 billion. The current account gap represented 4.2% of gross domestic product, the highest since the first quarter of 2022, up from 3.7% in the April-June quarter. The deficit peaked at 6.3% of GDP in the fourth quarter of 2024. |
No 4 |
|
|
Q3-2024 |
|
| |
|
|
|
US current account deficit widens sharply in second quarter on imports. The U.S. current account deficit widened sharply in the second quarter, reaching its highest level in more than two years amid a surge in imports of goods. The Commerce Department's Bureau of Economic Analysis said on Thursday that the current account deficit, which measures the flow of goods, services and investments into and out of the country, increased $25.8 billion, or 10.7%, to $266.8 billion last quarter. That was the highest level since the first quarter of 2022. Economists polled by Reuters had forecast the current account deficit at $260.0 billion. The current account gap represented 3.7% of gross domestic product, the highest since the second quarter of 2022 and up from 3.4% in the first quarter. The deficit peaked at 6.3% of GDP in the fourth quarter of 2005. The large current account deficit has no impact on the dollar given its status as the reserve currency. |
No 3 |
-266.8 B |
|
Q2-2024 |
|
| |
|
|
|
The U.S. current-account deficit widened by $15.9 billion, or 7.2 percent, to $237.6 billion in the first quarter of 2024, according to statistics released today by the U.S. Bureau of Economic Analysis. The revised fourth-quarter deficit was $221.8 billion. |
No 2 |
|
|
Q1-2024 |
|
| |
|
|
|
The U.S. current-account deficit, which reflects the combined balances on trade in goods and services and income flows between U.S. residents and residents of other countries, narrowed by $152.8 billion, or 15.7 percent, to $818.8 billion in 2023. The narrowing mostly reflected a reduced deficit on goods. The 2023 deficit was 3.0 percent of current-dollar gross domestic product, down from 3.8 percent in 2022.US current account deficit narrows in fourth quarter. The U.S. current account deficit narrowed in the fourth quarter to the lowest level in nearly three years amid an increase in secondary income, government data showed on Thursday. The Commerce Department's Bureau of Economic Analysis said that the current account deficit, which measures the flow of goods, services and investments into and out of the country, contracted $1.6 billion, or 0.8%, to $194.8 billion last quarter. That was the lowest level since the first quarter of 2021. Economists polled by Reuters had forecast the current account deficit at $209.0 billion. The current account gap represented 2.8% of gross domestic product, little changed from the third quarter. The deficit peaked at 6.3% of GDP in the fourth quarter of 2005. |
No 1 |
-194.8 B |
|
Q4-2023 |
|
| |
|
|
|
|
|
|
|
|
| |
|
|
|
|
|
| |
|
|
|
|
|
|
Current Account (At 8:30 a.m ET)
| DATE/WEEK |
HIGHLIGHTS |
FOR |
ACTUAL |
|
US current account deficit narrows in third quarter on petroleum exports. The U.S. current account deficit was the smallest in more than two years in the third quarter amid rising petroleum exports, government data showed on Wednesday. The Commerce Department's Bureau of Economic Analysis said that the current account deficit, which measures the flow of goods, services and investments into and out of the country, contracted $16.5 billion, or 7.6%, to $200.3 billion last quarter. That was the smallest since the second quarter of 2021. Economists polled by Reuters had forecast the current account deficit at $196.0 billion. The current account gap represented 2.9% of gross domestic product, the smallest share since the first quarter of 2021, and down from 3.2% in the second quarter. The deficit peaked at 6.3% of GDP in the fourth quarter of 2005. The United States is now a net exporter of crude oil and fuel. Though the deficit remains large, it has no impact on the dollar given its status as the reserve currency. |
No 4 |
|
|
Q3-2023 |
|
| |
|
|
|
US current account deficit narrows in second quarter. The current account gap represented 3.166% of gross domestic product compared to 3.234% in the first quarter. The U.S. current account deficit narrowed sharply in the second quarter as surpluses on services and primary income offset a shortfall on goods, data showed on Thursday. The Commerce Department said the current account deficit, which measures the flow of goods, services and investments into and out of the country, contracted by $2.4 billion, or 1.1%, to $212.1 billion last quarter. That was the lowest level since the second quarter of 2021. The current account gap represented 3.166% of gross domestic product compared to 3.234% in the first quarter. The deficit peaked at 6.3% of GDP in the fourth quarter of 2005. The United States is now a net exporter of crude oil and fuel. Though the deficit remains large, it has no impact on the dollar given its status as the reserve currency. |
No 3 |
-212.1 B |
|
Q2-2023 |
|
| |
|
|
|
The government also reported that the U.S. current account deficit - the broadest measure of the flow of goods, services and investments into and out of the country - widened modestly in the first three months of 2023, snapping three quarters of narrowing. The Commerce Department said the current account gap grew to $219.3 billion in the first quarter from a revised $216.2 billion in the fourth quarter of 2022. Economists in a Reuters poll had estimated it widening to $217.5 billion. |
No 2 |
|
|
Q1-2023 |
|
| |
|
|
|
The U.S. current account deficit narrowed in the fourth quarter amid an improvement in secondary income receipts as well as an increase in the services surplus, data showed on Thursday. The Commerce Department said the current account deficit, which measures the flow of goods, services and investments into and out of the country, contracted 5.6% to $206.8 billion last quarter. The current account gap represented 3.2% of gross domestic product, the smallest share since the second quarter of 2020 and down from 3.4% in the third quarter. The deficit peaked at 6.3% of GDP in the fourth quarter of 2005. For all of 2022, the current account gap widened to a record $943.8 billion, down from $846.4 billion in 2021. It represented 3.7% of GDP, the highest share since 2008, from 3.6% in 2021. The United States is now a net exporter of crude oil and fuel. Though the deficit remains wide, it has no impact on the dollar given its status as the reserve currency. |
No 1 |
-206.8 B |
|
Q4-2022 |
|
| |
|
|
|
|
|
|
|
|
| |
|
|
|
|
|
| |
|
|
|
|
|
|
Current Account (At 8:30 a.m ET)
| DATE/WEEK |
HIGHLIGHTS |
FOR |
ACTUAL |
|
U.S. current account deficit shrinks in third quarter. The U.S. current account deficit narrowed sharply in the third quarter as exports jumped to a record high, data showed on Wednesday. The Commerce Department said that the current account deficit, which measures the flow of goods, services and investments into and out of the country, contracted 9.1% to $217.1 billion last quarter. That was the smallest gap since the second quarter of 2021. The current account gap represented 3.4% of gross domestic product, down from 3.8% in the second quarter. That was the smallest share in two years. The deficit peaked at 6.3% of GDP in the fourth quarter of 2005. The United States is now a net exporter of crude oil and fuel. Though the deficit remains wide, it has no impact on the dollar given its status as the reserve currency. |
No 4 |
|
|
Q3-2022 |
|
| |
|
|
|
The U.S. current account deficit narrowed sharply in the second quarter amid a surge in goods exports, data showed on Thursday. The Commerce Department said that the current account deficit, which measures the flow of goods, services and investments into and out of the country, contracted 11.1% to $251.1 billion last quarter. The current account gap represented 4.0% of gross domestic product, down from 4.6% in the January-March quarter. The deficit peaked at 6.3% of GDP in the fourth quarter of 2005. The United States is now a net exporter of crude oil and fuel. While the deficit remains wide, it has no impact on the dollar given its status as the reserve currency. |
No 3 |
-251.1 B |
|
Q2-2022 |
|
| |
|
|
|
U.S. Current-Account Deficit Widens in First Quarter 2022. The U.S. current-account deficit, which reflects the combined balances on trade in goods and services and income flows between U.S. residents and residents of other countries, widened by $66.6 billion, or 29.6 percent, to $291.4 billion in the first quarter of 2022. The widening mostly reflected an increased deficit on goods. The first-quarter deficit was 4.8 percent of current-dollar gross domestic product, up from 3.7 percent in the fourth quarter. |
No 2 |
|
|
Q1-2022 |
|
| |
|
|
|
U.S. current account deficit biggest on record in 2021. The U.S. current account deficit narrowed in the fourth quarter, but the shortfall in 2021 was the largest on record amid a surge in imports as businesses rushed to replenish depleted inventories to meet strong demand. The Commerce Department said on Thursday that the current account deficit, which measures the flow of goods, services and investments into and out of the country, shrank 0.9% to $217.9 billion last quarter. Economists polled by Reuters had forecast a $218.0 billion deficit last quarter. The current account gap represented 3.6% of gross domestic product, down from 3.8% in the July-September quarter. The deficit peaked at 6.3% of GDP in the fourth quarter of 2005. The United States is now a net exporter of crude oil and fuel. |
No 1 |
-217.9 B |
|
Q4-2021 |
|
| |
|
|
|
|
|
|
|
|
| |
|
|
|
|
|
| |
|
|
|
|
|
|
Current Account (At 8:30 a.m ET)
| DATE/WEEK |
HIGHLIGHTS |
FOR |
ACTUAL |
|
The U.S. current account deficit surged to a 15-year high in the third quarter 2021 amid a record increase in imports as businesses rushed to replenish depleted inventories to meet strong demand. The Commerce Department said on Tuesday that the current account deficit, which measures the flow of goods, services and investments into and out of the country, accelerated 8.3% to $214.8 billion last quarter. That was the largest shortfall since the third quarter of 2006. The U.S. current-account deficit, which reflects the combined balances on trade in goods and services and income flows between U.S. residents and residents of other countries, widened by $16.5 billion, or 8.3 percent, to $214.8 billion in the third quarter of 2021. |
No 4 |
|
|
Q3-2021 |
|
| |
|
|
|
September 21, 2021. U.S. Current Account Deficit Widens in Second Quarter 2021. The U.S. current account deficit, which reflects the combined balances on trade in goods and services and income flows between U.S. residents and residents of other countries, widened by $0.9 billion, or 0.5 percent, to $190.3 billion in the second quarter of 2021. The widening mainly reflected reduced surpluses on services and on primary income that were mostly offset by a reduced deficit on secondary income. The second quarter deficit was 3.3 percent of current dollar gross domestic product, down from 3.4 percent in the first quarter. |
No 3 |
-190.3 B |
|
Q2-2021 |
|
| |
|
|
|
June 23, 2021. U.S. Current Account Deficit Widens in First Quarter 2021. The U.S. current account deficit, which reflects the combined balances on trade in goods and services and income flows between U.S. residents and residents of other countries, widened by $20.7 billion, or 11.8 percent, to $195.7 billion in the first quarter of 2021. The widening mostly reflected an increased deficit on goods and a reduced surplus on primary income. The first quarter deficit was 3.6 percent of current dollar gross domestic product, up from 3.3 percent in the fourth quarter. |
No 2 |
|
|
Q1-2021 |
|
| |
|
|
|
The U.S. current account deficit, which reflects the combined balances on trade in goods and services and income flows between U.S. residents and residents of other countries, widened by $7.6 billion, or 4.2 percent, to $188.5 billion in the fourth quarter of 2020, according to statistics released by the U.S. Bureau of Economic Analysis. The revised third quarter deficit was $180.9 billion. The fourth quarter deficit was 3.5 percent of current dollar gross domestic product (GDP), up from 3.4 percent in the third quarter. The $7.6 billion widening of the current account deficit in the fourth quarter primarily reflected an expanded deficit on goods and a reduced surplus on services that were partly offset by a reduced deficit on secondary income. |
No 1 |
-188.5 B |
|
Q4-2020 |
|
| |
|
|
|
|
|
|
|
|
| |
|
|
|
|
|
|
| |
|
|
|
|
|
|
|
|
|
|
|
| |
|
|
|
|
| |
|
| CURRENT ACCOUNT |
What is the Balance of Payments?
The Balance of Payments (BOP) is the place where countries record their monetary transactions with the rest of the world. Transactions are either marked as a credit or a debit. Within the BOP there are three separate categories under which different transactions are categorized:
- the Current Account
- the Capital Account
- the Financial Account
In the current account, goods, services, income and current transfers are recorded. In the capital account, physical assets such as a building or a factory are recorded. And in the financial account, assets pertaining to international monetary flows of, for example, business or portfolio investments, are noted.
Current Acount
The Commerce Department said the current account measures the flow of goods, services and investments into and out of the United States. The current account gap for all of 2011 was 3.1% of GDP, down slightly from 3.2% in 2010. The current account is the broadest gauge of trade. It tracks not only the sale of goods and services but also investment flows.
The balance of the current account tells us if a country has a deficit or a surplus. If there is a deficit, does that mean the economy is weak? Does a surplus automatically mean that the economy is strong? Not necessarily.
But to understand the significance of this part of the BOP, we should start by looking at the components of the current account: goods, services, income and current transfers.
1. Goods - These are movable and physical in nature, and in order for a transaction to be recorded under "goods", a change of ownership from/to a resident (of the local country) to/from a non-resident (in a foreign country) has to take place. Movable goods include general merchandise, goods used for processing other goods, and non-monetary gold. An export is marked as a credit (money coming in) and an import is noted as a debit (money going out).
2. Services - These transactions result from an intangible action such as transportation, business services, tourism, royalties or licensing. If money is being paid for a service it is recorded like an import (a debit), and if money is received it is recorded like an export (credit).
3. Income - Income is money going in (credit) or out (debit) of a country from salaries, portfolio investments (in the form of dividends, for example), direct investments or any other type of investment. Together, goods, services and income provide an economy with fuel to function. This means that items under these categories are actual resources that are transferred to and from a country for economic production.
4. Current Transfers - Current transfers are unilateral transfers with nothing received in return. These include workers' remittances, donations, aids and grants, official assistance and pensions. Due to their nature, current transfers are not considered real resources that affect economic production.
The current account, on a quarterly basis, measures the U.S. international balance in goods and services trade as well as unilateral transfers. (Bureau of Economic Analysis). U.S. trade with foreign countries holds important clues to economic trends here and abroad. The data can directly impact all the financial markets, but especially the foreign exchange value of the dollar.
The dollar can be particularly sensitive to changes in the chronic trade deficit run by the United States since this trade imbalance creates greater demand for foreign currencies.
The bond market is very sensitive to the risk of importing inflation or deflation. When Asian economies collapsed at the end of 1997, bond and equity investors feared that deflation in these economies would be transported to the United States. While goods inflation did decline modestly and momentarily, service inflation kept on ticking. Thus, the linkage is not so direct. A chronic current account deficit also suggests that consumers and businesses in the United States are outspending their income. We are living on credit while foreigners are paying for our profligate ways.
|
|
|
| |
|
|
|
|
|
|
|
|
|
|
|
| |
|
|
|
|
|
|
| DATA INFORMATION |
CURRENT ACCOUNT |
| SOURCE |
Bureau of Economic Analysis (BEA), U.S. Department of Commerce. |
| WEB |
www.bea.gov |
| FREQUENCY |
Quarterly |
| AVAILABILITY |
Usually during the fourth week of the month. |
| COVERAGE |
Data are for the previous quarter. |
| REVISIONS |
Yes |
| IMPORTANCE |
Growth - Very Important |
|
| |
|
|
|
|
|
|
|
|
|
|
|
|