 |
 |
|
 |
Business Inventories | Sales and Inventories |
|
 |
|
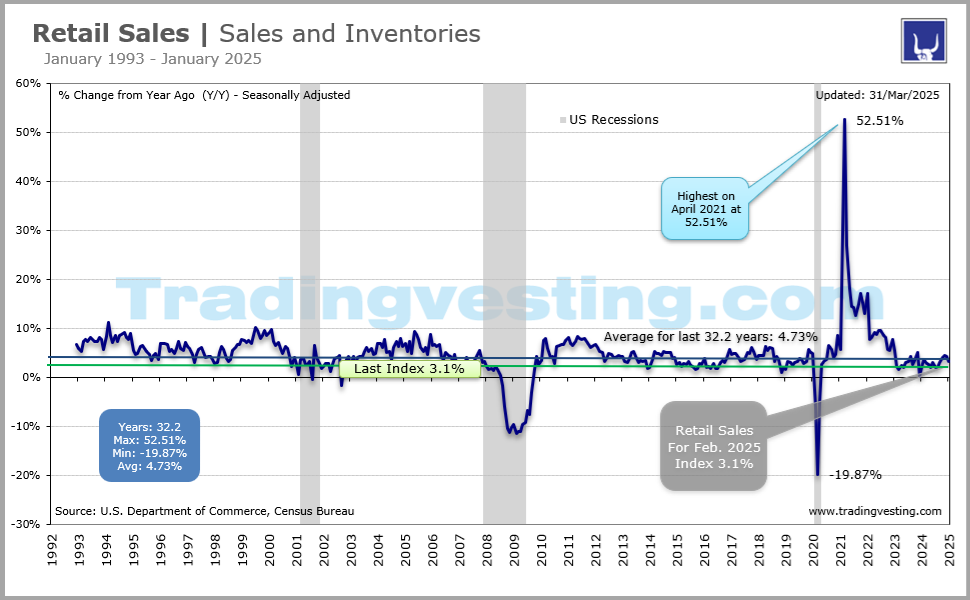
U.S. Business Inventories are a key element for measuring changes in gross domestic product (GDP). Companies tend to build their inventories when they expect stronger sales in the coming months.. → Read more...
|
|
|
|
|
|
|
| |
|
| |
 2. Business Inventories (2 of 6)
 3. Wholesale Trade Pre (3 of 6)
 4. Wholesale Trade Adv (4 of 6)
 5. Retail inventories (5 of 6)
 6. E-Commerce (6 of 6)
 1. Retail Sales (1 of 6)
|
 |
|
|
|
|
| |
|
→ Big Chart |
|
→ Release |
|
| |
|
|
|
|
|
|
|
|
|
|
|
|
|
|
|
|
|
|
|
 |
|
Big Chart | Large Data |
 |
|
Business Inventories | Sales and Inventories |
|
Today's Week |
 |
|
|
|
|
|
|
|
|
|
|
|
|
|
| |
|
|
|
|
|
|
|
|
|
|
|
|
|
|
|
|
|
|
|
|
|
Slides | Five 5 |
|
|
Business Inventories | Sales and Inventories |
|
Today's Week |
|
|
|
|
|
|
|
|
|
|
|
|
|
|
| |
|
|
|
|
|
|
|
|
|
|
|
|
|
|
|
|
|
|
|
|
|
Release Schedule | 2026 |
|
|
Business Inventories | Sales and Inventories |
|
Today's Week |
|
|
|
|
|
|
|
|
|
|
|
|
|
Business Inventories (At 10:00 a.m ET)
| SCHEDULE 2026 |
No 1 |
No 2 |
No 3 |
No 4 |
No 5 |
No 6 |
No 7 |
No 8 |
No 9 |
No 10 |
No 11 |
No 12 |
| Release | Week |
|
|
|
|
|
|
|
|
|
|
|
|
| Release | Date |
|
|
|
|
|
|
|
|
|
|
|
|
| Release | Day |
|
|
|
|
|
|
|
|
|
|
|
|
 |
|
|
|
|
|
|
|
|
|
|
|
|
| Prior |
0.3% |
0.1% |
0.1% |
-0.1% |
0.4% |
... |
... |
... |
... |
... |
... |
... |
| Prior Revised |
0.2% |
0.0% |
0.0% |
0.0% |
... |
.... |
.... |
.... |
.... |
.... |
.... |
.... |
| CONSENSUS |
0.2% |
0.0% |
... |
0.2% |
0.3% |
... |
... |
... |
... |
... |
... |
... |
| Consensus Low |
0.1% |
-0.1% |
... |
0.1% |
0.2% |
... |
... |
... |
... |
... |
... |
... |
| Consensus High |
0.2% |
0.1% |
... |
0.4% |
1.0% |
... |
... |
... |
... |
... |
... |
... |
| INVENTORIES |
0.1% |
0.1% |
-0.1% |
0.4% |
0.9% |
... |
... |
... |
... |
... |
... |
... |
| RATING |
|
|
|
|
|
|
|
|
|
|
|
|
| Month For |
Nov 25 |
Dec-25 |
Jan-26 |
Feb-26 |
Mar-26 |
Apr-26 |
May-26 |
Jun-26 |
Jul-26 |
Aug-26 |
Sep-26 |
Oct-26 |
|
|
|
|
|
|
|
|
|
|
|
|
|
|
|
| |
|
| |
|
|
|
|
|
|
|
|
|
|
|
Release Schedule | 2025 |
|
|
Business Inventories | Sales and Inventories |
|
Today's Week |
|
|
|
|
|
|
|
|
|
|
|
|
|
Business Inventories (At 10:00 a.m ET)
| SCHEDULE 2025 |
No 1 |
No 2 |
No 3 |
No 4 |
No 5 |
No 6 |
No 7 |
No 8 |
No 9 |
No 10 |
No 11 |
No 12 |
| Release | Week |
|
|
|
|
|
|
|
|
|
|
|
|
| Release | Date |
|
|
|
|
|
|
|
|
|
|
|
|
| Release | Day |
|
|
|
|
|
|
|
|
|
|
|
|
|
|
|
|
|
|
|
|
|
|
|
|
|
| Prior |
0.1% |
0.1% |
-0.2% |
0.3% |
0.2% |
0.1% |
0.0% |
0.0% |
0.2% |
0.2% |
0.0% |
0.2% |
| Prior Revised |
0.0% |
... |
... |
... |
... |
... |
... |
... |
... |
0.1% |
... |
... |
| CONSENSUS |
0.1% |
0.3% |
0.3% |
0.2% |
0.2% |
0.0% |
0.0% |
0.2% |
0.2% |
0.2% |
0.2% |
... |
| Consensus Low |
0.1% |
0.1% |
0.2% |
0.2% |
0.1% |
-0.1% |
-0.2% |
-0.1% |
0.1% |
0.0% |
0.1% |
... |
| Consensus High |
0.6% |
0.4% |
0.5% |
0.4% |
0.4% |
0.2% |
0.0% |
0.2% |
0.3% |
0.2% |
0.2% |
... |
| INVENTORIES |
0.1% |
-0.2% |
0.3% |
0.2% |
0.1% |
0.0% |
0.0% |
0.2% |
0.2% |
0.0% |
0.2% |
0.3% |
| RATING |
|
|
|
|
|
|
|
|
|
|
|
|
| Month For |
Nov 24 |
Dec-24 |
Jan-25 |
Feb-25 |
Mar-25 |
Apr-25 |
May-25 |
Jun-25 |
Jul-25 |
Aug-25 |
Sep-25 |
Oct-25 |
|
|
|
|
|
|
|
|
|
|
|
|
|
|
|
| |
|
| |
|
|
|
|
|
|
|
|
|
|
|
Release Schedule | 2024 |
|
|
Business Inventories | Sales and Inventories |
|
Today's Week |
|
|
|
|
|
|
|
|
|
|
|
|
|
Business Inventories (At 10:00 a.m ET)
| SCHEDULE 2024 |
No 1 |
No 2 |
No 3 |
No 4 |
No 5 |
No 6 |
No 7 |
No 8 |
No 9 |
No 10 |
No 11 |
No 12 |
| Release | Week |
|
|
|
|
|
|
|
|
|
|
|
|
| Release | Date |
|
|
|
|
|
|
|
|
|
|
|
|
| Release | Day |
|
|
|
|
|
|
|
|
|
|
|
|
|
|
|
|
|
|
|
|
|
|
|
|
|
| Prior |
-0.1% |
-0.1% |
0.4% |
0.0% |
0.4% |
-0.1% |
0.3% |
0.5% |
0.3% |
0.4% |
0.3% |
0.1% |
| Prior Revised |
... |
... |
0.3% |
... |
0.3% |
... |
... |
... |
... |
0.3% |
... |
0.0% |
| CONSENSUS |
-0.1% |
0.4% |
0.3% |
0.4% |
0.0% |
0.3% |
0.4% |
0.3% |
0.4% |
0.3% |
... |
0.2% |
| Consensus Low |
-0.2% |
0.3% |
0.0% |
0.2% |
-0.1% |
0.2% |
0.2% |
0.1% |
0.2% |
0.1% |
... |
0.0% |
| Consensus High |
-0.1% |
0.4% |
0.3% |
0.4% |
0.1% |
0.3% |
0.5% |
0.3% |
0.4% |
0.3% |
... |
0.3% |
| INVENTORIES |
-0.1% |
0.4% |
0.0% |
0.4% |
-0.1% |
0.3% |
0.5% |
0.3% |
0.4% |
0.3% |
0.1% |
0.1% |
| RATING |
|
|
|
|
|
|
|
|
|
|
|
|
| Month For |
Nov 23 |
Dec-23 |
Jan-24 |
Feb-24 |
Mar-24 |
Apr-24 |
May-24 |
Jun-24 |
Jul-24 |
Aug-24 |
Sep-24 |
Oct-24 |
|
|
|
|
|
|
|
|
|
|
|
|
|
|
|
| |
|
| |
|
|
|
|
|
|
|
|
|
|
|
Release Schedule | 2023 |
|
|
Business Inventories | Sales and Inventories |
|
Today's Week |
|
|
|
|
|
|
|
|
|
|
|
|
|
Business Inventories (At 10:00 a.m ET)
| SCHEDULE 2023 |
No 1 |
No 2 |
No 3 |
No 4 |
No 5 |
No 6 |
No 7 |
No 8 |
No 9 |
No 10 |
No 11 |
No 12 |
| Release | Week |
|
|
|
|
|
|
|
|
|
|
|
|
| Release | Date |
|
|
|
|
|
|
|
|
|
|
|
|
| Release | Day |
|
|
|
|
|
|
|
|
|
|
|
|
|
|
|
|
|
|
|
|
|
|
|
|
|
| Prior |
0.3% |
0.4% |
0.3% |
-0.1% |
0.2% |
-0.1% |
0.2% |
0.2% |
0.0% |
0.0% |
0.4% |
0.4% |
| Prior Revised |
0.2% |
0.3% |
No |
-0.2% |
0.0% |
-0.2% |
0.1% |
0.0% |
-0.1% |
0.1% |
No |
0.2% |
| CONSENSUS |
0.4% |
0.3% |
0.0% |
0.3% |
0.0% |
0.2% |
0.2% |
0.2% |
0.1% |
0.3% |
0.4% |
0.0% |
| Consensus Low |
0.2% |
0.2% |
-0.1% |
0.1% |
-0.3% |
0.0% |
0.1% |
-0.1% |
0.0% |
0.2% |
0.2% |
-0.1% |
| Consensus High |
0.4% |
0.4% |
0.3% |
0.4% |
0.4% |
0.2% |
0.2% |
0.3% |
0.1% |
0.4% |
0.4% |
0.4% |
| INVENTORIES |
0.4% |
0.3% |
-0.1% |
0.2% |
-0.1% |
0.2% |
0.2% |
0.0% |
0.0% |
0.4% |
0.4% |
-0.1% |
| RATING |
|
|
|
|
|
|
|
|
|
|
|
|
| Month For |
Nov 22 |
Dec 22 |
Jan-23 |
Feb-23 |
Mar-23 |
Apr-23 |
May-23 |
Jun-23 |
Jul-23 |
Aug-23 |
Sep-23 |
Oct-23 |
|
|
|
|
|
|
|
|
|
|
|
|
|
|
|
| |
|
| |
|
|
|
|
|
|
|
|
|
|
|
Release Schedule | 2022 |
|
|
Business Inventories | Sales and Inventories |
|
Today's Week |
|
|
|
|
|
|
|
|
|
|
|
|
|
Business Inventories (At 10:00 a.m ET)
| SCHEDULE 2022 |
No 1 |
No 2 |
No 3 |
No 4 |
No 5 |
No 6 |
No 7 |
No 8 |
No 9 |
No 10 |
No 11 |
No 12 |
| Release | Week |
|
|
|
|
|
|
|
|
|
|
|
|
| Release | Date |
|
|
|
|
|
|
|
|
|
|
|
|
| Release | Day |
|
|
|
|
|
|
|
|
|
|
|
|
|
|
|
|
|
|
|
|
|
|
|
|
|
| Prior |
1.2% |
1.3% |
2.1% |
1.1% |
1.5% |
2.0% |
1.2% |
1.4% |
1.4% |
0.6% |
0.8% |
0.4% |
| Prior Revised |
1.3% |
1.5% |
2.4% |
... |
1.8% |
2.4% |
1.3% |
1.6% |
... |
... |
0.9% |
0.2% |
| CONSENSUS |
1.1% |
1.8% |
1.1% |
1.3% |
1.8% |
1.3% |
1.2% |
1.4% |
0.6% |
... |
0.5% |
0.4% |
| Consensus Low |
0.3% |
0.9% |
1.1% |
0.5% |
1.1% |
1.2% |
1.1% |
1.1% |
0.5% |
... |
0.4% |
0.3% |
| Consensus High |
1.3% |
2.1% |
1.3% |
1.4% |
2.0% |
2.0% |
1.6% |
1.5% |
0.8% |
... |
0.6% |
0.6% |
| INVENTORIES |
1.3% |
2.1% |
1.1% |
1.5% |
2.2% |
1.2% |
1.4% |
1.4% |
0.6% |
0.8% |
0.4% |
0.3% |
| RATING |
|
|
|
|
|
|
|
|
|
|
|
|
| Month For |
Nov 21 |
Dec 21 |
Jan-22 |
Feb-22 |
Mar-22 |
Apr-22 |
May-22 |
Jun-22 |
Jul-22 |
Aug-22 |
Sep-22 |
Oct-22 |
|
|
|
|
|
|
|
|
|
|
|
|
|
|
|
| |
|
| |
|
|
|
|
|
|
|
|
|
|
|
Release Schedule | 2021 |
|
|
Business Inventories | Sales and Inventories |
|
Today's Week |
|
|
|
|
|
|
|
|
|
|
|
|
|
Business Inventories (At 10:00 a.m ET)
| SCHEDULE 2021 |
No 1 |
No 2 |
No 3 |
No 4 |
No 5 |
No 6 |
No 7 |
No 8 |
No 9 |
No 10 |
No 11 |
No 12 |
| Release | Week |
|
|
|
|
|
|
|
|
|
|
|
|
| Release | Date |
|
|
|
|
|
|
|
|
|
|
|
|
| Release | Day |
|
|
|
|
|
|
|
|
|
|
|
|
|
|
|
|
|
|
|
|
|
|
|
|
|
| Prior |
0.7% |
0.5% |
0.6% |
0.3% |
0.5% |
0.3% |
-0.2% |
0.5% |
0.8% |
0.5% |
0.6% |
0.7% |
| Prior Revised |
0.8% |
0.5% |
0.8% |
0.4% |
0.4% |
0.2% |
0.1% |
0.6% |
0.9% |
0.6% |
0.6% |
0.8% |
| CONSENSUS |
0.5% |
0.3% |
0.3% |
0.5% |
0.3% |
-0.1% |
0.5% |
0.8% |
0.5% |
0.7% |
0.6% |
1.0% |
| Consensus Low |
0.1% |
0.2% |
0.2% |
0.3% |
-1.6% |
-0.1% |
0.3% |
0.1% |
0.3% |
0.1% |
0.1% |
0.5% |
| Consensus High |
0.7% |
0.6% |
1.0% |
0.6% |
0.4% |
0.5% |
0.6% |
0.58% |
0.6% |
1.0% |
0.7% |
1.2% |
| INVENTORIES |
0.5% |
1.3% |
0.3% |
0.5% |
0.3% |
-0.2% |
0.5% |
0.8% |
0.5% |
0.6% |
0.7% |
1.2% |
| RATING |
|
|
|
|
|
|
|
|
|
|
|
|
| Month For |
Nov 20 |
Dec 20 |
Jan-21 |
Feb-21 |
Mar-21 |
Apr-21 |
May-21 |
Jun-21 |
Jul-21 |
Aug-21 |
Sep-21 |
Oct-21 |
|
|
|
|
|
|
|
|
|
|
|
|
|
|
|
| |
|
| |
|
Legends: |
 |
Delayed |
 |
Positive View |
 |
Negative View |
 |
Neutral View |
 |
Non Available |
|
|
|
|
|
|
|
|
|
|
|
|
|
|
|
|
|
|
|
|
| |
|
|
|
|
|
|
|
|
|
|
|
|
|
|
|
|
|
|
|
|
|
Brief News | 2026 |
|
|
Business Inventories | Sales and Inventories |
|
Today's Week |
|
|
|
|
|
|
|
|
|
|
|
|
|
Business Inventories (At 10:00 a.m ET)
| DATE/WEEK |
HIGHLIGHTS |
FOR |
ACTUAL |
|
Business Inventories |
No 12 |
... |
|
Oct-2026 |
|
| |
|
|
|
Business Inventories |
No 11 |
... |
|
Sep-2026 |
|
| |
|
|
|
Business Inventories |
No 12 |
... |
|
Oct-2026 |
|
| |
|
|
|
Business Inventories |
No 11 |
... |
|
Sep-2026 |
|
| |
|
|
|
Business Inventories |
No 10 |
... |
|
Aug-2026 |
|
| |
|
|
|
Business Inventories |
No 9 |
... |
|
Jul-2026 |
|
| |
|
|
|
Business Inventories |
No 8 |
... |
|
Jun-2026 |
|
| |
|
|
|
Business Inventories |
No 7 |
... |
|
May-2026 |
|
| |
|
|
|
Business Inventories |
No 6 |
... |
|
Apr-2026 |
|
| |
|
|
|
Business Inventories |
No 5 |
... |
|
Mar-2026 |
|
| |
|
|
|
Business Inventories |
No 4 |
... |
|
Feb-2026 |
|
| |
|
|
|
Business Inventories |
No 3 |
... |
|
Jan-2026 |
|
| |
|
|
|
Business Inventories |
No 2 |
... |
|
Dec-2024 |
|
| |
|
|
|
For Nov 2025 at 0.1% prior 0.3%. Business inventories in November 2025 came in at nearly $2.68 trillion, up 0.1% from the month prior and up 1.2% from a year ago, the Commerce Department said. Trade sales and manufacturers' shipments were $1.95 trillion, up 0.6% from the month prior but up 3.5% from a year ago |
No 1 |
0.1% |
|
Nov-2025 |
|
| |
|
|
|
|
|
|
|
|
| |
|
|
|
|
|
| |
|
|
|
|
|
|
|
|
|
|
|
|
|
|
|
Brief News | 2025 |
|
|
Business Inventories | Sales and Inventories |
|
Today's Week |
|
|
|
|
|
|
|
|
|
|
|
|
|
Business Inventories (At 10:00 a.m ET)
| DATE/WEEK |
HIGHLIGHTS |
FOR |
ACTUAL |
|
Business Inventories |
No 12 |
... |
|
Oct-2025 |
|
| |
|
|
|
Business Inventories |
No 11 |
... |
|
Sep-2025 |
|
| |
|
|
|
Business Inventories |
No 12 |
... |
|
Oct-2025 |
|
| |
|
|
|
Business Inventories Sep. 2025: Delayed due to the government shut down, |
No 11 |
... |
|
Sep-2025 |
|
| |
|
|
|
Business Inventories Aug. 2025: Delayed due to the government shut down, |
No 10 |
... |
|
Aug-2025 |
|
| |
|
|
|
U.S. business inventories increased marginally in July amid a surge in sales, government data showed. Inventories rose 0.2% after advancing by the same margin in June, the Commerce Department's Census Bureau said on Tuesday. Inventories are a key component of gross domestic product and one of the most volatile. They increased 1.5% year-on-year. Inventories decreased at a $32.9 billion annualized rate in the second quarter, subtracting 3.29 percentage points from GDP. That was, however, more than offset by a record 4.95 percentage point contribution from a smaller trade deficit. |
No 9 |
0.2% |
|
Jul-2025 |
|
| |
|
|
|
In June 2025, total U.S. business inventories rose by 0.2% month-over-month, reaching a value of $2.66 trillion, matching market expectations. This increase was driven by a 0.2% gain in retail inventories, a 0.4% increase in wholesale inventories after a decline the prior month, and a modest 0.1% rise in manufacturing inventories. On a yearly basis, total business inventories were up 1.6% from the previous year. |
No 8 |
0.2% |
|
Jun-2025 |
|
| |
|
|
|
In May 2025, US business inventories remained unchanged from the previous month for the second consecutive time, holding at approximately $2.66 trillion, but were 1.7% higher than a year ago. This stabilization occurred alongside a 0.4% drop in business sales during May. The inventories-to-sales ratio, which measures how long it would take to sell existing stock, rose slightly to 1.39 in May from 1.38 in April. A stable or rising inventories-to-sales ratio can signal that businesses are not seeing the sales growth they expected, which can be a key economic indicator for future production and GDP growth. |
No 7 |
0.0% |
|
May-2025 |
|
| |
|
|
|
Business Inventories. U.S. business inventories were unchanged in April amid a decline in stocks at manufacturers, suggesting inventories could be a drag on gross domestic product in the second quarter. The unchanged inventories reading followed a 0.1% gain in March, the Commerce Department's Census Bureau said on Tuesday. That was in line with economists' expectations. Inventories are a key component of GDP. They increased 2.2% year-on-year. |
No 6 |
0.0% |
|
Apr-2025 |
|
| |
|
|
|
Business Inventories. In March 2025, U.S. total business end-of-month inventories reached $2,578.1 billion, representing a 0.1% increase from February 2025, according to the U.S. Census Bureau. Total business sales for March 2025 were $1,919.9 billion, up 0.7% from February 2025, according to the U.S. Census Bureau. |
No 5 |
0.1% |
|
Mar-2025 |
|
| |
|
|
|
Business Inventories In February 2025, U.S. business inventories rose by 0.2% from January, reaching an end-of-month level of $2,590.0 billion, in line with market expectations. This increase was primarily driven by merchant wholesalers' inventories, which grew by 0.3%, while manufacturers' and retailers' inventories both increased by a more modest 0.1%. On a year-over-year basis, business inventories increased by 2.1% |
No 4 |
0.2% |
|
Feb-2025 |
|
| |
|
|
|
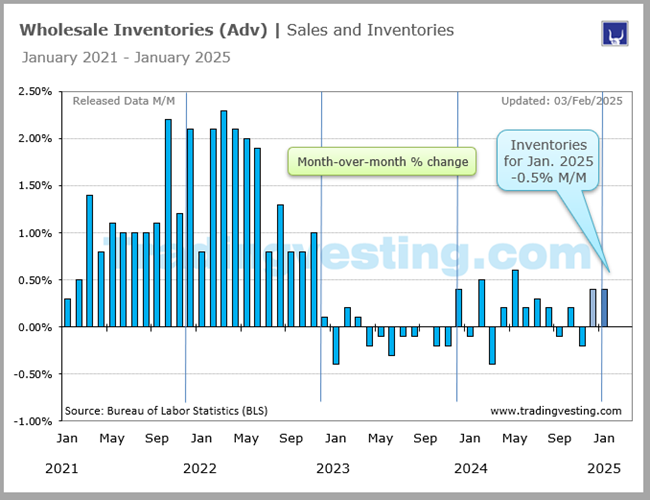
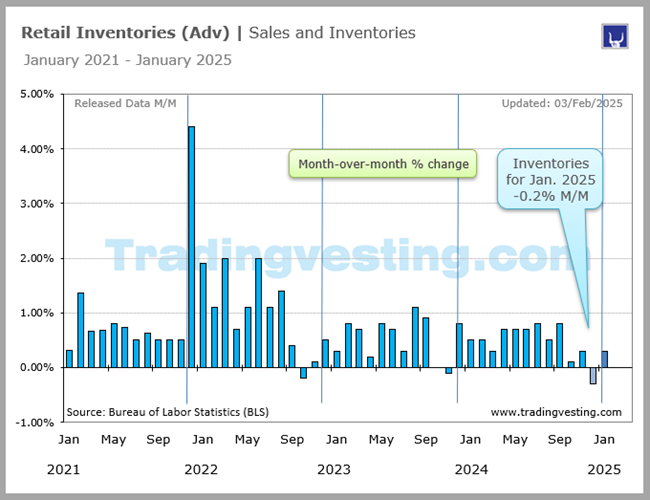
In January 2025, U.S. business inventories rose by 0.3% month-over-month, aligning with market expectations and recovering from a 0.2% decline in December 2024. This increase was primarily driven by a 0.8% surge in wholesale inventories, while manufacturing inventories saw a modest 0.1% rise, and retail inventories remained flat. On an annual basis, business inventories grew by 2.3% in January 2025 |
No 3 |
0.3% |
|
Jan-2025 |
|
| |
|
|
|
US business inventories post first drop in nine months. Bearish for USD. U.S. business inventories fell for the first time in nine months in December as strong domestic demand depleted stocks at retailers and wholesalers. Inventories dropped 0.2%, the first decline since March, after gaining 0.1% in November, the Commerce Department's Census Bureau said on Friday. Economists polled by Reuters had forecast inventories, a key component of gross domestic product, being unchanged. Inventories increased 2.0% on a year-on-year basis in December. Inventories are the most volatile component of GDP. Private inventory investment was a big drag on GDP in the fourth quarter, restricting economic growth to a 2.3% annualized rate. The economy grew at a 3.1% pace in the July-September quarter. With decreases by wholesale and retail inventories more than offsetting an increase by manufacturing inventories, the Commerce Department released a report on Friday showing U.S. business inventories unexpectedly edged lower in the month of December. This unexpected decline indicates a decrease in the worth of unsold goods, suggesting a potential dip in consumer demand. Such a development is typically considered bearish for the US dollar, as it could point to a slower economic growth. The Business Inventories data is considered of medium importance in economic analysis, with a two-star rating. |
No 2 |
-0.2% |
|
Dec-2024 |
|
| |
|
|
|
U.S. business inventories rose marginally in November, suggesting that restocking will probably not contribute to economic growth in the fourth quarter. Inventories ticked up 0.1% after being unchanged in October, the Commerce Department's Census Bureau said on Thursday. The slight rise in inventories, a key component of gross domestic product, was in line with economists' expectations.Inventories increased 2.6% on a year-on-year basis in November. The pace of inventory accumulation could pick up in the months ahead as businesses stockpile goods in anticipation of higher import tariffs. President-elect Donald Trump, who will be inaugurated next week, is planning broad tariffs on goods. |
No 1 |
0.1% |
|
Nov-2024 |
|
| |
|
|
|
|
|
|
|
|
| |
|
|
|
|
|
| |
|
|
|
|
|
|
|
|
|
|
|
|
|
|
|
Brief News | 2024 |
|
|
Business Inventories | Sales and Inventories |
|
Today's Week |
|
|
|
|
|
|
|
|
|
|
|
|
|
Business Inventories (At 10:00 a.m ET)
| DATE/WEEK |
HIGHLIGHTS |
FOR |
ACTUAL |
|
Business Inventories increased by 0.1% month-over-month in October, in line with analyst expectations. US business inventories barely rise in October 2024. U.S. business inventories edged up in October as modest increases in stocks at retailers and wholesalers were partially offset by a decline at manufacturers. Inventories rose 0.1% after being unchanged in September, the Commerce Department's Census Bureau said on Tuesday. The gain in inventories, a key component of gross domestic product, was in line with economists' expectations. Inventories increased 2.4% on a year-on-year basis in October. The pace of inventory accumulation could pick up in the months ahead as businesses stockpile goods in anticipation of higher import tariffs. |
No 12 |
0.1% |
|
Oct-2024 |
|
| |
|
|
|
US business inventories rise less than expectated in September 2024. U.S. business inventories increased less than expected in September as a rise in stocks at retailers was partially offset by declines at manufacturers and wholesalers. Inventories edged up 0.1% after advancing 0.3% in September, the Commerce Department's Census Bureau said in Friday. Economists polled by Reuters had forecast inventories, a key component of gross domestic product, gaining 0.2%. Inventories rose 2.2% on a year-on-year basis in September. Inventories and trade are the most volatile components of gross domestic product. Private inventory investment was a small drag on GDP in the third quarter. The economy grew at a 2.8% annualized rate in the July-September quarter. |
No 11 |
0.1% |
|
Sep-2024 |
|
| |
|
|
|
US business inventories rise in August on retail stocks. U.S. business inventories increased in August, lifted by stocks at retailers, government data showed on Thursday. Inventories rose 0.3% after a similar gain in July, the Commerce Department's Census Bureau said. The increase in inventories, a key component of gross domestic product, was in line with economists' expectations. Inventories advanced 2.4% on a year-on-year basis in August. Private inventory investment contributed to the economy's 3.0% annualized growth rate in the second quarter. Inventories and trade are the most volatile components of gross domestic product. August's trade data last week suggested that trade could be a small drag on economic growth in the third quarter. |
No 10 |
|
|
Aug-2024 |
|
| |
|
|
|
Business inventories rise 0.4% M/M in July, in line with consensus. July Business Inventories increased +0.4% M/M, matching the consensus estimate, to $2,574.9B, increasing from the and +0.3% rise in June, according to U.S. Census Bureau data release on Tuesday. The combined value of distributive trade sales and manufacturers’ shipments for July. |
No 9 |
0.4% |
|
Jul-2024 |
|
| |
|
|
|
U.S. business inventories increased moderately in June as a surge in stocks at retailers was offset by mild gains at wholesalers. Inventories rose 0.3% after increasing 0.5% in May, the Commerce Department's Census Bureau said on Thursday. The increase in inventories, a key component of gross domestic product, was in line with economists' expectations. Inventories increased 2.1% year-on-year in June. Private inventory investment contributed 0.82 percentage point to the economy's 2.8% annualized growth pace in the second quarter, after being a drag for two straight quarters. |
No 8 |
0.3% |
|
Jun-2024 |
|
| |
|
|
|
US business inventories increase slightly above expectations in May. US business inventories increase slightly above expectations in MayU.S. business inventories increased slightly more than expected in May amid solid rises in stocks at wholesalers and retailers, a trend that could see inventory investment contributing to economic growth in the second quarter. Inventories rose 0.5% after climbing 0.3% in April, the Commerce Department's Census Bureau said on Tuesday. Economists polled by Reuters had forecast inventories, a key component of gross domestic product, rising 0.4%. Inventories advanced 1.6% year-on-year in May. |
No 7 |
0.5% |
|
May-2024 |
|
| |
|
|
|
U.S. Business Inventories Increase In Line With Estimates In April. A report released by the Commerce Department on Tuesday showed business inventories in the U.S. increased in line with economist estimates in the month of April. The Commerce Department said business inventories rose by 0.3 percent in April after edging down by 0.1 percent in March. Economists had expected business inventories to climb by 0.3 percent. The rebound by business inventories came as retail inventories advanced by 0.7 percent in April after inching up by 0.1 percent in March. Manufacturing inventories crept up by 0.1 percent in April after coming in unchanged in March, while wholesale inventories ticked up by 0.1 percent in April after falling by 0.5 percent in March. The Commerce Department said business sales also rose by 0.3 percent in April following a 0.2 percent dip in the previous month. |
No 6 |
0.3% |
|
Apr-2024 |
|
| |
|
|
|
US business inventories fall in March. U.S. business inventories fell in March, but this could lay the ground for businesses to rebuild stocks and support economic growth in the second quarter. Inventories dipped 0.1% after increasing 0.3% in February, the Commerce Department's Census Bureau said on Wednesday. The drop in inventories, a key component of gross domestic product, was in line with economists' expectations. Inventories increased 0.7% year-on-year in March. |
No 5 |
-0.1% |
|
Mar-2024 |
|
| |
|
|
|
US February Business inventories 0.4% vs 0.4% estimate. Prior month unchanged. Business inventories 0.4% vs 0.4% estimate and Unchanged last month. U.S. business inventories rose in February amid strong gains at retailers and wholesalers, suggesting that inventory investment could contribute to economic growth in the first quarter. Inventories increased 0.4% after being unchanged in January, the Commerce Department's Census Bureau on Monday. The pick up in inventories, a key component of gross domestic product, was in line with economists' expectations. |
No 4 |
0.4% |
|
Feb-2024 |
|
| |
|
|
|
US business inventories unchanged in January. U.S. business inventories were unexpectedly unchanged in January as increases in stocks at retailers were offset by declines at manufacturers and wholesalers. The unchanged reading in business inventories reported by the Commerce Department's Census Bureau on Thursday followed a 0.3% increase in December. Economists polled by Reuters had expected inventories, a key component of gross domestic product, to rise 0.2%. Inventories increased 0.4% year-on-year in January. |
No 3 |
0.0% |
|
Jan-2024 |
|
| |
|
|
|
US business inventories rebound in December. Business Inventories up 0.4% in December 2023. The total business Inventories/Sales Ratio based on seasonally adjusted data at the end of December was 1.37. The December 2022 ratio was 1.40. US business inventories for December 0.4% versus 0.4% expected. U.S. business inventories rebounded in December, driven by rising stocks at retailers and wholesalers. Business inventories rose 0.4% after falling 0.1% in November, the Commerce Department's Census Bureau said on Thursday. The increase in inventories, a key component of gross domestic product, was in line with economists' expectations. Inventories advanced 0.4% on a year-on-year basis in December. Private inventory investment added 0.1 percentage point to the economy's 3.3% annualized growth pace in the fourth quarter after providing a large boost in the July-September period. |
No 2 |
0.4% |
|
Dec-2023 |
|
| |
|
|
|
US business inventories fall in November. U.S. business inventories fell for a second straight month in November amid declines in retail and wholesale stocks, which could see inventory investment subtracting from economic growth in the fourth quarter. Business inventories dipped 0.1% after a similar drop in October, the Commerce Department's Census Bureau said on Wednesday. The drop in inventories, a key component of gross domestic product, was in line with economists' expectations. Inventories increased 0.4% on a year-on-year basis in November. Economists expect business inventories to be a drag on GDP growth in the fourth quarter. Growth estimates for the October-December quarter are as high as a 2.2% annualized rate. Private inventory investment contributed 1.27 percentage points to the economy's 4.9% growth pace in the third quarter. |
No 1 |
-0.1% |
|
Nov-2023 |
|
| |
|
|
|
|
|
|
|
|
| |
|
|
|
|
|
| |
|
|
|
|
|
|
|
|
|
|
|
|
|
|
|
Brief News | 2023 |
|
|
Business Inventories | Sales and Inventories |
|
Today's Week |
|
|
|
|
|
|
|
|
|
|
|
|
|
Business Inventories (At 10:00 a.m ET)
| DATE/WEEK |
HIGHLIGHTS |
FOR |
ACTUAL |
|
U.S. business inventories unexpectedly fell in October, suggesting that inventory investment could weigh on economic growth this quarter. Business inventories dipped 0.1%, the first decline since June, after increasing 0.2% in September, the Commerce Department's Census Bureau said on Thursday. Economists had expected that inventories, a key component of gross domestic product, would be unchanged. Inventories increased 0.6% on a year-on-year basis in October. Business inventories are expected to subtract from gross domestic product in the fourth quarter. Private inventory investment contributed 1.40 percentage points to the economy's 5.2% annualized growth pace in the third quarter. Growth estimates for the October-December quarter are below a 2% rate. |
No 12 |
31.9 |
|
Oct-2023 |
|
| |
|
|
|
U.S. business inventories rise in September 2023. U.S. businesses maintained a fairly solid pace of inventory investment in September amid rising sales, government data showed on Wednesday. Business inventories rose 0.4% after rising by the same margin in August, the Commerce Department's Census Bureau said. The increase in inventories, a key component of gross domestic product, was in line with economists' expectations. Inventories rose 1.3% on a year-on-year basis in September. Private inventory investment added 1.32 percentage points to the economy's 4.9% annualized growth pace in the third quarter. Business boosted inventory accumulation to meet strong demand. |
No 11 |
30.9 |
|
Sep-2023 |
|
| |
|
|
|
U.S. business inventories increased a bit more than expected in August even as sales surged, suggesting inventory investment could provide a lift to economic growth in the third quarter. Business inventories rose 0.4% after edging up 0.1% in July, the Commerce Department said on Tuesday. Economists polled by Reuters had expected inventories to rise 0.3%. Inventories, a key component of gross domestic product, increased 1.0% on a year-on-year basis in August. |
No 10 |
|
|
Aug-2023 |
|
| |
|
|
|
U.S. business inventories were unchanged in July as companies continued to carefully manage stocks in anticipation of weak demand because of higher interest rates. The unchanged reading in business inventories followed a 0.1% dip in June, the Commerce Department said on Thursday. Economists polled by Reuters had expected inventories to edge up 0.1%. Inventories, a key component of gross domestic product, increased 1.4% on a year-on-year basis in July. Private inventory investment declined in the second quarter, imposing a small drag on gross domestic product growth. The economy grew at a 2.1% annualized rate in the April-June period. |
No 9 |
0.4% |
|
Jul-2023 |
|
| |
|
|
|
US business inventories unchanged in June 2023. U.S. business inventories were unchanged for a second straight month in June as companies continued to carefully manage stocks in anticipation of weak demand because of higher interest rates. Economists polled by Reuters had expected the Commerce Department would report a 0.1% gain in business inventories on Tuesday. Inventories, a key component of gross domestic product, increased 2.0% on a year-on-year basis in June. Private inventory investment was estimated to have made a small contribution to GDP in the second quarter after being a major drag in the first three months of the year. The economy grew at a 2.4% annualized rate in the April-June period. |
No 8 |
0.3% |
|
Jun-2023 |
|
| |
|
|
|
US business inventories edge up 3.5% YoY in May; sales gained 0.2%. Retail inventories rose 0.7% in May instead of 0.8% as estimated in an advance report published last month. They climbed 0.3% in April. US business inventories rose moderately in May as businesses continued to manage stocks in anticipation of weaker demand because of higher borrowing costs. Business inventories rose 0.2% after ticking up 0.1% in April, the Commerce Department said on Tuesday. The increase in inventories, a key component of gross domestic product, was in line with economists' expectations. Inventories increased 3.5% on a year-on-year basis in May. Private inventory investment rose at its slowest pace in 1-1/2 years in the first quarter, helping to restrict GDP growth to a 2.0% annualized pace in that three-month period. Growth estimates for the second quarter are around a 2.3% pace. |
No 7 |
0.5% |
|
May-2023 |
|
| |
|
|
|
U.S. business inventories rebounded in April, boosted by stocks at manufacturers, suggesting that inventories could contribute to economic growth in the second quarter. Business inventories increased 0.2% after dropping 0.2% in March, the Commerce Department said on Thursday. The rebound in inventories, a key component of gross domestic product, was in line with economists' expectations. Inventories increased 5.2% on a year-on-year basis in April. Private inventory investment rose at its slowest pace in 1-1/2 years in the first quarter, helping to restrict GDP growth to a 1.3% annualized pace in that three-month period. Growth estimates for the second quarter are around a 2.0% pace. |
No 6 |
0.3% |
|
Apr-2023 |
|
| |
|
|
|
U.S. Business Inventories Down Slightly in March, but Mixed by Distributor. Total business inventories eased 0.1% (6.4% y/y) in March following a 0.1% increase in February; the February number was revised downward from 0.2%. The Informa Global Markets Survey expected March inventories to be unchanged from February. Business sales fell in March by 1.2% (-0.6% /y) after a 0.2% decrease in February; that earlier reading was revised from a steady amount reported last month. With the larger decrease in sales than in inventories, the resulting inventory-to-sales ratio rose slightly to 1.39 in March from 1.38 in February; the February ratio was revised from 1.36. |
No 5 |
-0.1% |
|
Mar-2023 |
|
| |
|
|
|
U.S. business inventories rose moderately in February, suggesting that inventory investment could subtract from economic growth in the first quarter. Business inventories increased 0.2% after falling 0.2% in January, the Commerce Department said on Friday. Economists polled by Reuters had expected inventories, a key component of gross domestic product, to rise 0.3%. Inventories increased 9.1% on a year-on-year basis in February. Inventory accumulation surged in the fourth quarter, mostly reflecting an unwanted piling up of goods, as growth in consumer spending decelerated because of higher interest rates. |
No 4 |
0.4% |
|
Feb-2023 |
|
| |
|
|
|
U.S. business inventories fall for first time in nearly two years.U.S. business inventories fell for the first time in nearly two years in January, potentially setting up inventory investment to be a drag on economic growth in the first quarter. Business inventories dropped 0.1%, the Commerce Department said on Wednesday. That was the first decline and also the weakest reading since April 2021 and followed a 0.3% gain in December. Economists polled by Reuters had expected inventories, a key component of gross domestic product, would be unchanged. Inventories increased 11.1% on a year-on-year basis in January. Inventory accumulation surged in the fourth quarter, mostly reflecting an unwanted piling up of goods, as growth in consumer spending decelerated because of higher interest rates. Retail inventories increased 0.2% instead of 0.3% as estimated in an advance report published last month. They rose 0.4% in December. Motor vehicle inventories advanced 0.6% as estimated last month. They increased 1.4% in December. Retail inventories excluding autos, which go into the calculation of GDP, gained 0.1% instead of the 0.2% rise estimated last month. |
No 3 |
0.0% |
|
Jan-2023 |
|
| |
|
|
|
U.S. business inventories rose moderately in December as businesses carefully managed stocks amid slowing demand, with the inventory-to-sales ratio hitting a two-year high. Business inventories increased 0.3% after climbing by the same margin in November, the Commerce Department said on Wednesday. Inventories are a key component of gross domestic product. December's gain was in line with economists' expectations. Inventories increased 12.7% on a year-on-year basis in December. Inventory accumulation surged in the fourth quarter, mostly reflecting an unwanted piling up of goods, as higher borrowing costs contributed to the slowest pace of growth in domestic demand in 2-1/2 years. The Federal Reserve has raised its policy rate by 450 basis points since last March from near zero to a 4.50%-4.75% range, with the bulk of the increases between May and December. Two additional rate hikes of 25 basis points are expected in March and May. |
No 2 |
0.4% |
|
Dec-2022 |
|
| |
|
|
|
U.S. business inventories increased in November as higher interest rates depressed sales, boosting the inventory-to-sales ratio to the highest level in nearly two years. Business inventories rose 0.4% after gaining 0.2% in October, the Commerce Department said on Wednesday. Inventories are a key component of gross domestic product. November's increase in inventories was in line with economists' expectations. Inventories increased 15.1% on a year-on-year basis in November. |
No 1 |
-0.1% |
|
Nov-2022 |
|
| |
|
|
|
|
|
|
|
|
| |
|
|
|
|
|
| |
|
|
|
|
|
|
Business Inventories (At 10:00 a.m ET)
| DATE/WEEK |
HIGHLIGHTS |
FOR |
ACTUAL |
|
U.S. business inventories increased moderately in October, suggesting that businesses were slowing the pace of stock accumulation amid cooling demand and rising recession risks as the Federal Reserve continues to raise interest rates. Business inventories rose 0.3% after gaining 0.2% in September, the Commerce Department said on Thursday. Inventories are a key component of gross domestic product. Economists polled by Reuters had forecast inventories rising 0.4%. Inventories increased 16.5% on a year-on-year basis in October. Retail inventories fell 0.2% in October as estimated in an advance report published last month. They were unchanged in September. |
No 12 |
1.5% |
|
Oct-2022 |
|
| |
|
|
|
U.S. business inventories increased moderately in September, suggesting that businesses were becoming more cautious about ordering more merchandise as higher borrowing costs slow demand. Business inventories increased 0.4% after rising 0.9% in August, the Commerce Department said on Wednesday. Inventories are a key component of gross domestic product. Economists polled by Reuters had forecast inventories climbing advancing 0.5%. Inventories increased 17.8% on a year-on-year basis in September. Retail inventories gained 0.4% in September as estimated in an advance report published last month. That followed a 1.4% advance in August. |
No 11 |
2.2% |
|
Sep-2022 |
|
| |
|
|
|
U.S. business inventories increased a bit less than expected in August, but there are signs that unsold goods are piling up at retailers and wholesalers as stubbornly high inflation and rising interest rates slow demand. Business inventories rose 0.8% after climbing 0.5% in July, the Commerce Department said on Friday. Inventories are a key component of gross domestic product. Economists polled by Reuters had forecast inventories advancing 0.9%. Inventories increased 18.2% on a year-on-year basis in August. |
No 10 |
1.5% |
|
Aug-2022 |
|
| |
|
|
|
U.S. business inventories increased in July, but the pace has slowed considerably from prior months, likely as cooling demand amid higher interest rates forces companies to be cautious. Business inventories increased 0.6% after rising 1.4% in June, the Commerce Department said on Thursday. Inventories are a key component of gross domestic product. July's increase was in line with economists' expectations. Inventories increased 18.4% on a year-on-year basis in July. Retail inventories increased 1.2% in July, instead of 1.1% as estimated in an advance report published last month. That followed a 2.0% increase in June. |
No 9 |
2.2% |
|
Jul-2022 |
|
| |
|
|
|
U.S. business inventories increased strongly in June amid signs of a large buildup of stocks in the retail sector despite a pickup in sales. Business inventories rose 1.4% after advancing 1.6% in May, the Commerce Department said on Wednesday. Inventories are a key component of gross domestic product. June's increase was in line with economists' expectations. Inventories increased 18.5% on a year-on-year basis in June. Retail inventories increased 2.0% in June, as estimated in an advance report published last month. That followed a 1.6% gain in May. Motor vehicle inventories accelerated 3.3% instead of the 3.1% estimated last month. They advanced 2.4% in May. |
No 8 |
1.5% |
|
Jun-2022 |
|
| |
|
|
|
U.S. business inventories increased strongly in May, outpacing the growth in sales, government data showed on Friday. Business inventories rose 1.4% after climbing 1.3% in April, the Commerce Department said. Inventories are a key component of gross domestic product. Economists polled by Reuters had forecast inventories would rise 1.3%. Inventories advanced 17.7% on a year-on-year basis in May. Retail inventories increased 1.1% in May, as estimated in an advance report published last month. That followed a 0.8% rise in April. Motor vehicle inventories rebounded 2.2% instead of the 2.3% gain estimated last month. They fell 2.2% in April. |
No 7 |
2.2% |
|
May-2022 |
|
| |
|
|
|
U.S. business inventories increased strongly in April amid a moderation in sales, government data showed on Wednesday. Business inventories rose 1.2% after advancing 2.4% in March, the Commerce Department said. Inventories are a key component of gross domestic product. April's increase was in line with economists' expectations. Inventories advanced 16.6% on a year-on-year basis in April. Retail inventories increased 0.7% in April as estimated in an advance report published last month. That followed a 3.1% jump in March. Motor vehicle inventories dropped 2.2% as estimated last month. They increased 1.7% in March. |
No 6 |
1.5% |
|
Apr-2022 |
|
| |
|
|
|
Business inventories increased 2% in March 2022 after rising by a revised 1.8% in February, data from the U.S. Commerce Department showed Tuesday. Economists polled by The Wall Street Journal expected inventories to advance 1.9%. Inventories rose by 2.3% at both wholesalers and retailers, and by 1.3% at manufacturers. |
No 5 |
2.2% |
|
Mar-2022 |
|
| |
|
|
|
U.S. business inventories jump 1.5% in February 2022. Business inventories rose 1.5% in February 2022 as companies tried to stock up low levels of products on hand. Sales in the month increased 1%, the government said Thursday. The inventory-to-sales ratio rose to 1.26 form 1.25. The ratio reflects how long it would take a company to sell all the goods sitting on warehouse shelves. Low readings lately are a sign of how hard it is for businesses to produce enough goods to keep up with demand. Higher inventories add to GDP. |
No 4 |
1.5% |
|
Feb-2022 |
|
| |
|
|
|
U.S. business inventories increased strongly in January 2022, though the pace slowed from prior months, which could result in inventory investment making no contribution to economic growth in the first quarter. Business inventories rose 1.1% after advancing 2.4% in December, the Commerce Department said on Wednesday. Inventories are a key component of gross domestic product. January's increase was in line with economists' expectations. Inventories gained 11.4% on a year-on-year basis in January. |
No 3 |
1.1% |
|
Jan-2022 |
|
| |
|
|
|
U.S. business inventories increased strongly in December 2021, with motor vehicle stocks accelerating, a sign that the worst of the global semiconductor shortage was probably behind. Business inventories increased 2.1% after rising 1.5% in November, the Commerce Department said on Wednesday. |
No 2 |
2.1% |
|
Dec-2021 |
|
| |
|
|
|
The Commerce Department said business inventories shot up by 1.3 percent in November, matching the upwardly revised jump in October. Economists had expected inventories to increase by 1.1 percent compared to the 1.2 percent growth originally reported for the previous month. The Commerce Department said business inventories shot up by 1.3 percent in November, matching the upwardly revised jump in October. Economists had expected inventories to increase by 1.0 percent. |
No 1 |
1.3% |
|
Nov-2021 |
|
| |
|
|
|
|
|
|
|
|
| |
|
|
|
|
|
| |
|
|
|
|
|
|
|
|
|
|
|
|
|
|
|
Brief News | 2021 |
|
|
Business Inventories | Sales and Inventories |
|
Today's Week |
|
|
|
|
|
|
|
|
|
|
|
|
|
Business Inventories (At 10:00 a.m ET)
| DATE/WEEK |
HIGHLIGHTS |
FOR |
ACTUAL |
|
U.S. business inventory accumulation increased strongly in October 2021, suggesting that restocking could again support economic growth this quarter even as motor vehicle inventories remain depressed because of shortages. Business inventories rose 1.2% after gaining 0.8% in September, the Commerce Department said on Wednesday. Inventories are a key component of gross domestic product. Economists polled by Reuters had forecast inventories rising 1.1%. Inventories increased 7.8% on a year-on-year basis in October. Retail inventories edged up 0.1% in October as estimated in an advance report published last month. That followed a 0.1% dip in September. Motor vehicle inventories decreased 1.0% instead of 0.7% as estimated last month. |
No 12 |
1.2% |
|
Oct-2021 |
|
| |
|
|
|
U.S. business inventories rise solidly in September 2021. Business Inventories up 0.7% in September 2021. The combined value of distributive trade sales and manufacturers’ shipments for September, adjusted for seasonal and trading day differences but not for price changes, was estimated at $1,669.7 billion, up 0.9 percent (±0.2 percent) from August 2021 and was up 15.5 percent (±0.6 percent) from September 2020.. Manufacturers’ and trade inventories for September, adjusted for seasonal and trading day differences but not for price changes, were estimated at an end-of-month level of $2,101.8 billion, up 0.7 percent (±0.2 percent) from August 2021 and were up 7.5 percent (±0.5 percent) from September 2020. |
No 11 |
0.7% |
|
Sep-2021 |
|
| |
|
|
|
Business inventories rose by 0.6% in August 2021. It’s a sign that companies are rebuilding their supply of goods, which isn’t the easiest thing to do with bottlenecks in the supply chain. A relatively low business-inventory-to-sales ratio means that companies’ inventories are flying off the shelves faster than usual. U.S. business inventories rose 0.6% in August, the government said Friday. That matched the forecast of economists polled by The Wall Street Journal. Sales fell 0.1% in the month. An increase in inventories adds to gross domestic product and is usually a sign of an expanding economy. |
No 10 |
|
|
Aug-2021 |
|
| |
|
|
|
Business sales gained 0.5% in July 2021 after rising 1.6% in June. At July's sales pace, it would take 1.25 months for businesses to clear shelves, unchanged from June. Business inventories increased in line with economist estimates in the month of July, the Commerce Department revealed in a report released on Thursday. The report said business inventories rose by 0.5 percent in July after climbing by an upwardly revised 0.9 percent in June. Economists had expected business inventories to rise by 0.5 percent compared to the 0.8 percent increase originally reported for the previous month. |
No 9 |
0.5% |
|
Jul-2021 |
|
| |
|
|
|
Inventories in the manufacturing and trade sectors in the United States increased by 0.8% in June 2021 compared to the previous month to stand at $2.06 trillion, according to a report by the US Census Bureau released on Tuesday. The figure was 6.6% higher on a yearly basis. The combined value of distributive trade sales and manufacturers' shipments in June was estimated at $1.64 trillion, rising 1.4% from May and jumping 19.9% year-over-year. The ratio between business inventories and sales was 1.25 at the end of June 2021, down from 1.41 recorded 12 months ago. |
No 8 |
0.8% |
|
Jun-2021 |
|
| |
|
|
|
U.S. business inventories rose 0.5% in May 2021, the government said Friday. Economists polled by The Wall Street Journal had forecast a 0.5%. U.S. business inventories increased solidly in May, but shortages of goods like motor vehicles are making it harder for retailers to restock warehouses to meet booming demand. Business inventories rose 0.5% after edging up 0.1% in April, the Commerce Department said on Friday. Inventories are a key component of gross domestic product. May's increase was in line with economists' expectations. Inventories increased 4.5% on a year-on-year basis in May. |
No 7 |
0.5% |
|
May-2021 |
|
| |
|
|
|
U.S. business inventories fell in April 2021, with stocks declining at a sharper pace than initially estimated amid shortages of raw materials, which are undercutting production of motor vehicles and other goods. Business inventories decreased 0.2% after increasing 0.2% in March, the Commerce Department said on Tuesday. Inventories are a key component of gross domestic product. Economists polled by Reuters had forecast inventories dipping 0.1%. Inventories dropped 3.6% on a year-on-year basis in April. |
No 6 |
-68.9B |
|
Apr-2021 |
|
| |
|
|
|
US business inventories for March 0.3% versus 0.3% estimate.The sharp rise in sales in relation to inventories has sent the inventory to sales ratio to below the lowest level going back to 2012. The pandemic restart and supply chain issues as a result of that restart, is likely leading to the sharp fall. Two things can happen. The inventories can be rebuilt if capacity allows, or another potential option is that the inventories remain low, and force up prices.US a business inventories rise 0.3% versus February the at 0.6% (was previously 0.5%). |
No 5 |
-74.4B |
|
Mar-2021 |
|
| |
|
|
|
U.S. business inventories increased solidly in February, suggesting restocking could again contribute to economic growth in the first quarter. Business inventories rose 0.5% after increasing 0.4% in January, the Commerce Department said on Thursday. Inventories are a key component of gross domestic product. February's gain was in line with economists' expectations. Inventories fell 2.4% on a year-on-year basis in February. Retail inventories were unchanged in February as estimated in an advance report published last month. That followed a ‐0.3% decline in January. Motor vehicle inventories decreased fell 2.6% as previously reported. Motor vehicle stocks are dwindling as a global semi-conductor shortage hampers auto production.,Retail inventories excluding autos, which go into the calculation of GDP, increased 1.2% as estimated last month. That followed a 0.2% gain in January. |
No 4 |
-71.1B |
|
Feb-2021 |
|
| |
|
|
|
U.S. business inventories rose moderately in January 2021 amid a sharp rebound in consumer spending at the start of the year, and it is now taking businesses the shortest time in nearly nine years to clear shelves. Business inventories increased 0.3% in January after rising 0.8% in December, the Commerce Department said on Tuesday. Inventories are a key component of gross domestic product. January’s gain was in line with economists’ expectations. Inventories fell 1.8% on a year-on-year basis in January. Economists estimate the economy could grow this year by as much as 7%, fueled by the massive fiscal stimulus and rollout of vaccines that are expected to get the pandemic under control. That would be the fastest growth since 1984 and would follow a 3.5% contraction last year, the worst performance in 74 years. |
No 3 |
-68.2B |
|
Jan-2021 |
|
| |
|
|
|
U.S. Business Inventories Rise in December 2020. Business inventories in the United States rose more than expected during December 2020, data showed on Wednesday. U.S. business inventories increased by 0.6% in December, after rising by 0.5% in November, according to data by the U.S. Department of Commerce. On an annual basis, business inventories declined by 2.6% in December 2020. Retail inventories leveled up by 1.2% in December, while motor vehicle inventories increased 1.1%. Meanwhile, wholesale inventories grew by 0.3%... |
No 2 |
-66.6B |
|
Dec-2020 |
|
| |
|
|
|
U.S. business inventories increase 0.5 percent in November 2020. The Commerce Department announced on Friday that business inventories rose 0.5 percent m-o-m in November, following a revised 0.8 percent m-o-m advance in October (originally a 0.7 percent m-o-m gain). That was in line with economists’ forecast for a 0.5 percent m-o-m increase. According to the report, stocks at retailers and manufacturers both rose by 0.7 percent m-o-m, while inventories at wholesalers were unchanged m-o-m. |
No 1 |
-68.1B |
|
Nov-2020 |
|
| |
|
|
|
|
|
|
|
|
| |
|
|
|
|
|
| |
|
Legends: |
|
Delayed |
|
Positive View |
|
Negative View |
|
Neutral View |
|
Non Available |
|
|
|
|
|
|
|
|
|
|
|
|
|
|
|
|
|
|
|
|
| |
|
|
|
|
|
|
|
|
|
|
|
|
|
|
|
|
|
|
|
|
|
Definitions | Explain |
|
|
Business Inventories | Sales and Inventories |
|
Today's Week |
|
|
|
|
|
|
|
|
|
|
|
|
| |
|
|
|
|
| |
|
| Business Inventories |
Business Inventories Related to GDP
Inventories are a key component of gross domestic product changes. Inventories helped to lift or to lower GDP. Retail inventories outside of autos - a measure which goes into the calculation of gross domestic product.
Businesses are building inventories in line with rising demand. When businesses step up restocking, they order more goods. That generally leads to increased factory production and higher economic growth.
But stockpile growth largely depends on the spending habits of U.S. consumers and businesses. Lean inventories are a big plus for the business outlook, pointing to the need for new inventories should demand build and limiting dislocations to production and employment should demand slow.
The inventory-to-sales (I/S) ratio
It measures the number of months it would take to deplete existing inventory at current sales rates. A relatively low (high) I/S ratio may mean that manufacturers will have to build up (draw down) inventory levels.
Depending on the strength of final demand and the degree to which recent inventory changes have been intended or unintended, this can have an effect on the industrial production outlook. Note that this information is much more useful to market economists than it is to other market participants.
Meaning of inventory-to-sales ratio at a very lean 1.28
At a month's sales pace it will take 1.28 months for businesses to clear shelves; this is the amount of goods on hand relative to sales. This inventory-to-sales ratio measures how many months it would take for a firm to deplete its current inventory.
Businesses Boost Inventories, Expecting More Growth
Companies tend to build their inventories when they expect stronger sales. Companies are building up their stockpiles again after cutting them over the summer. That's a positive sign for growth because it means many businesses are anticipating stronger demand.
Increase Inventories
Companies increase inventories when they believe demand for their products will be picking up. Inventories can also build up when producers made more stuff they thought would sell.
Inventories tend to rise when economic conditions are strong; since sales are rising at the same time, the inventory-to- sales ratio may remain stable, or rise at a very slow pace.
Remember that holding too much inventory is an inefficient use of cash. But weaker restocking could act as a drag on overall economic growth. When businesses place fewer orders, factory production slows.
Reduce Inventories
Inventories tend to drop when economic conditions are weak; since sales are falling at the same time, the inventory-to-sales ratio may remain relatively stable. The I- S ratio then begins to rise as sales fall more quickly than inventory growth.
Companies may reduce orders placed with manufacturers as they attempt to keep stockpiles in line with sales and gauge whether spending and the economy will keep slowing. Another report today showed retail sales fell in June for a third month.
Many businesses reduced their inventory restocking in the summer after consumer spending slowed last spring in the face of higher food and gas prices. The slowdown, along with supply disruptions caused by March's earthquake in Japan, weakened U.S. manufacturing and contributed to worries of another recession.
Rising inventories and falling sales suggest that companies may have ordered more goods than they need. As a result, they are likely to cut back on orders in the coming months, which would slow factory output and economic growth. |
|
|
| |
|
|
|
|
|
|
|
|
|
|
|
|
|
|
|
|
|
|
|
|
|
Data | Source |
|
|
Business Inventories | Sales and Inventories |
|
Today's Week |
|
|
|
|
|
|
|
|
|
|
|
|
| |
|
|
|
|
|
|
| DATA INFORMATION |
BUSINESS INVENTORIES |
| SOURCE |
Bureau of the Census, U.S. Department of Commerce. |
| WEB |
www.census.gov |
| FREQUENCY |
Monthly |
| AVAILABILITY |
Mid-month |
| COVERAGE |
Data are for the previous month. Data for June are released in July. |
| REVISIONS |
Yes |
| IMPORTANCE |
Sales and Inventories - Very Important |
|
| |
|
|
|
|
|
|
|
|
|
|
|
|