|
 |
|
 |
Chicago Fed National Activity Index | Business Activity |
|
 |
|
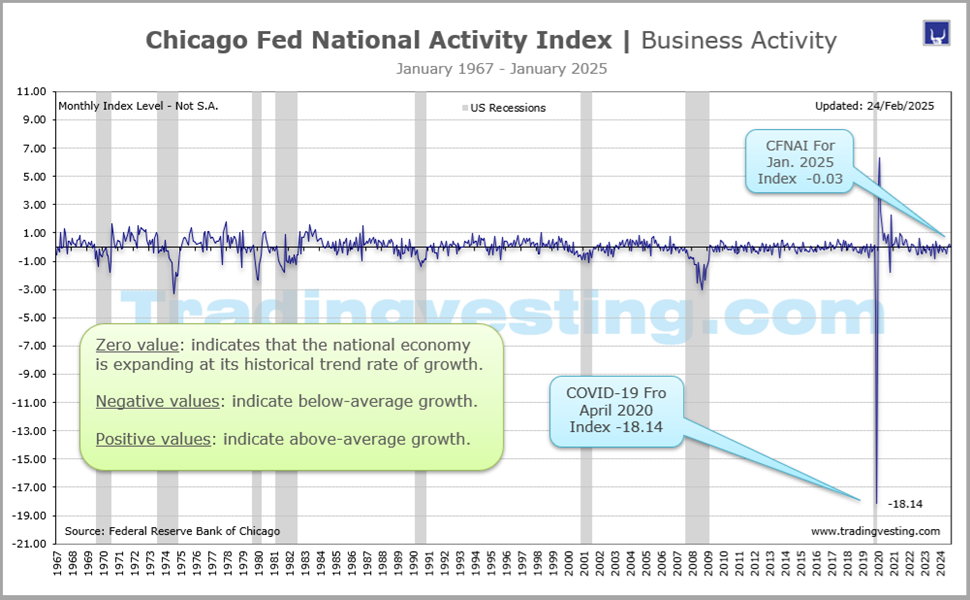
The CFNAI is a weighted average of 85 existing monthly indicators of national economic activity designed to better gauge overall economic activity and inflationary pressure.However, this index is not accurate in real time Read More... |
|
|
|
|
|
|
| |
|
| |
 1. Chicago Fed National Activity Index ( 1 of 4 ) 1. Chicago Fed National Activity Index ( 1 of 4 ) 2. PMI Services Final ( 2 of 45 ) 2. PMI Services Final ( 2 of 45 ) 4. ISM Services Index (3 of 4) 4. ISM Services Index (3 of 4)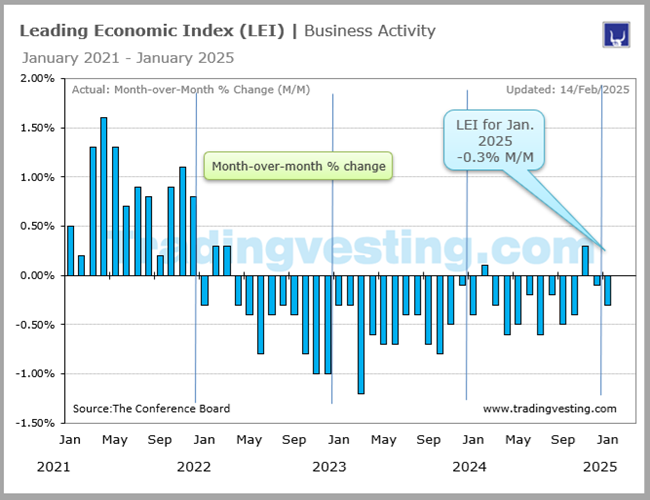 5. Leading Indicators ( 4 of 4 ) 5. Leading Indicators ( 4 of 4 )
|
 |
|
|
|
|
| |
|
→ Big Chart |
|
→ Release |
|
| |
|
|
|
|
|
|
|
|
|
|
|
|
|
|
|
|
|
|
|
 |
|
Big Chart | Large Data |
 |
|
Chicago Fed Nat Activity Index | Business Activity |
|
Today's Week |
 |
|
|
|
|
|
|
|
|
|
|
|
|
|
| |
|
|
|
|
|
|
|
|
|
|
| |
|
|
|
|
|
|
|
|
|
|
|
Slides | Six 6 |
|
|
Chicago Fed Nat Activity Index | Business Activity |
|
Today's Week |
|
|
|
|
|
|
|
|
|
|
|
|
|
|
| |
|
|
|
|
|
|
|
|
|
|
|
|
|
|
|
|
|
|
|
|
|
Release Schedule | 2026 |
|
|
Chicago Fed Nat Activity Index | Business Activity |
|
Today's Week |
|
|
|
|
|
|
|
|
|
|
|
|
|
Chicago Fed National Activity Index (At 8:30 a.m ET)
| SCHEDULE 2026 |
No 1 |
No 2 |
No 3 |
No 4 |
No 5 |
No 6 |
No 7 |
No 8 |
No 9 |
No 10 |
No 11 |
No 12 |
| Release | Week |
|
|
|
|
|
|
|
|
|
|
|
|
| Release | Date |
|
|
|
|
|
|
|
|
|
|
|
|
| Release | Day |
|
|
|
|
|
|
|
|
|
|
|
|
 |
|
|
|
|
|
|
|
|
|
|
|
|
| Prior |
-0.04 |
-0.21 |
0.18 |
-0.11 |
-0.20 |
... |
... |
... |
... |
... |
... |
... |
| Prior Revised |
... |
... |
0.20 |
0.03 |
-0.15 |
... |
... |
... |
... |
... |
... |
... |
| CONSENSUS |
... |
... |
... |
... |
-0.10 |
... |
... |
... |
... |
... |
... |
... |
| Consensus Low |
... |
... |
... |
... |
-0.30 |
... |
... |
... |
... |
... |
... |
... |
| Consensus High |
... |
... |
... |
... |
0.30 |
... |
... |
... |
... |
... |
... |
... |
| CFNAI M/M |
-0.21 |
0.18 |
-0.11 |
-0.20 |
0.14 |
... |
... |
... |
... |
... |
... |
... |
| 3-Month MA |
No 1 |
No 2 |
No 3 |
No 4 |
No 2 |
No 6 |
No 7 |
No 8 |
No 9 |
No 10 |
No 11 |
No 12 |
| 3-month MA Prior |
-0.23 |
-0.29 |
-0.06 |
-0.01 |
-0.03 |
... |
... |
... |
... |
... |
... |
... |
| 3-month MA Rev |
... |
... |
-0.02 |
0.03 |
-0.02 |
... |
... |
... |
... |
... |
... |
... |
| 3 Month MA |
-0.21 |
-0.06 |
-0.01 |
-0.03 |
0.03 |
... |
... |
... |
... |
... |
... |
... |
| RATING |
|
|
|
|
|
|
|
|
|
|
|
|
| Month For |
Dec-25 |
Jan-26 |
Feb-26 |
Mar-26 |
Apr-26 |
May-26 |
Jun-26 |
Jul-26 |
Aug-26 |
Sep-26 |
Oct-26 |
Nov-26 |
|
|
|
|
|
|
|
|
|
|
|
|
|
|
|
| |
|
| |
|
|
|
|
|
|
|
|
|
|
|
Release Schedule | 2025 |
|
|
Chicago Fed Nat Activity Index | Business Activity |
|
Today's Week |
|
|
|
|
|
|
|
|
|
|
|
|
|
Chicago Fed National Activity Index (At 8:30 a.m ET)
| SCHEDULE 2025 |
No 1 |
No 2 |
No 3 |
No 4 |
No 5 |
No 6 |
No 7 |
No 8 |
No 9 |
No 10 |
No 11 |
No 12 |
| Release | Week |
|
|
|
|
|
|
|
|
|
|
|
|
| Release | Date |
|
|
|
|
|
|
|
|
|
|
|
|
| Release | Day |
|
|
|
|
|
|
|
|
|
|
|
|
|
|
|
|
|
|
|
|
|
|
|
|
|
| Prior |
-0.12 |
0.15 |
-0.03 |
0.18 |
-0.03 |
-0.25 |
-0.28 |
-0.10 |
-0.19 |
-0.12 |
-0.21 |
-0.42 |
| Prior Revised |
-0.01 |
0.18 |
-0.08 |
0.24 |
0.03 |
-0.36 |
-0.16 |
-0.18 |
-0.28 |
-0.31 |
... |
... |
| CONSENSUS |
... |
... |
... |
... |
... |
... |
... |
... |
... |
... |
... |
... |
| Consensus Low |
... |
... |
... |
... |
... |
... |
... |
... |
... |
... |
... |
... |
| Consensus High |
... |
... |
... |
... |
... |
... |
... |
... |
... |
... |
... |
... |
| CFNAI M/M |
0.15 |
-0.03 |
0.18 |
-0.03 |
-0.25 |
-0.28 |
-0.10 |
-0.19 |
-0.12 |
-0.21 |
-0.42 |
-0.04 |
| 3-Month MA |
No 1 |
No 2 |
No 3 |
No 4 |
No 5 |
No 6 |
No 7 |
No 8 |
No 9 |
No 10 |
No 11 |
No 12 |
| 3-month MA Prior |
-0.31 |
-0.13 |
0.03 |
0.15 |
-0.01 |
0.05 |
-0.16 |
-0.22 |
-0.18 |
-0.18 |
-0.23 |
-0.34 |
| 3-month MA Rev |
-0.26 |
-0.13 |
0.07 |
... |
0.05 |
0.06 |
-0.14 |
-0.26 |
-0.20 |
-0.18 |
... |
... |
| 3 Month MA |
-0.13 |
0.03 |
0.15 |
-0.01 |
0.05 |
-0.16 |
-0.22 |
-0.18 |
-0.18 |
-0.23 |
-0.34 |
-0.23 |
| RATING |
|
|
|
|
|
|
|
|
|
|
|
|
| Month For |
Dec-24 |
Jan-25 |
Feb-25 |
Mar-25 |
Apr-25 |
May-25 |
Jun-25 |
Jul-25 |
Aug-25 |
Sep-25 |
Oct-25 |
Nov-25 |
|
|
|
|
|
|
|
|
|
|
|
|
|
|
|
| |
|
| |
|
|
|
|
|
|
|
|
|
|
|
Release Schedule | 2024 |
|
|
Chicago Fed Nat Activity Index | Business Activity |
|
Today's Week |
|
|
|
|
|
|
|
|
|
|
|
|
|
Chicago Fed National Activity Index (At 8:30 a.m ET)
| SCHEDULE 2024 |
No 1 |
No 2 |
No 3 |
No 4 |
No 5 |
No 6 |
No 7 |
No 8 |
No 9 |
No 10 |
No 11 |
No 12 |
| Release | Week |
|
|
|
|
|
|
|
|
|
|
|
|
| Release | Date |
|
|
|
|
|
|
|
|
|
|
|
|
| Release | Day |
|
|
|
|
|
|
|
|
|
|
|
|
|
|
|
|
|
|
|
|
|
|
|
|
|
| Prior |
0.03 |
-0.15 |
-0.30 |
0.05 |
0.15 |
-0.23 |
0.18 |
0.05 |
-0.34 |
-0.12 |
-0.28 |
-0.40 |
| Prior Revised |
0.01 |
0.02 |
-0.54 |
0.09 |
-0.04 |
-0.26 |
0.23 |
-0.09 |
-0.42 |
-0.01 |
-0.27 |
-0.50 |
| CONSENSUS |
... |
-0.16 |
-0.50 |
... |
... |
-0.40 |
0.10 |
-0.15 |
0.00 |
... |
... |
... |
| Consensus Low |
... |
-0.25 |
-0.90 |
... |
... |
-0.40 |
-0.06 |
-0.30 |
-0.60 |
... |
... |
... |
| Consensus High |
... |
0.20 |
-0.34 |
... |
... |
-0.25 |
0.30 |
0.03 |
0.20 |
... |
... |
... |
| CFNAI M/M |
-0.15 |
-0.30 |
0.05 |
0.15 |
-0.23 |
0.18 |
0.05 |
-0.34 |
0.12 |
-0.28 |
-0.40 |
-0.12 |
| 3-month MA |
-0.28 |
-0.02 |
-0.18 |
-0.06 |
0.01 |
-0.09 |
No |
-0.13 |
-0.17 |
-0.19 |
-0.24 |
-0.31 |
| RATING |
|
|
|
|
|
|
|
|
|
|
|
|
| Month For |
Dec-23 |
Jan-24 |
Feb-24 |
Mar-24 |
Apr-24 |
May-24 |
Jun-24 |
Jul-24 |
Aug-24 |
Sep-24 |
Oct-24 |
Nov-24 |
|
|
|
|
|
|
|
|
|
|
|
|
|
|
|
| |
|
| |
|
|
|
|
|
|
|
|
|
|
|
Release Schedule | 2023 |
|
|
Chicago Fed Nat Activity Index | Business Activity |
|
Today's Week |
|
|
|
|
|
|
|
|
|
|
|
|
|
Chicago Fed National Activity Index (At 8:30 a.m ET)
| SCHEDULE 2023 |
No 1 |
No 2 |
No 3 |
No 4 |
No 5 |
No 6 |
No 7 |
No 8 |
No 9 |
No 10 |
No 11 |
No 12 |
| Release | Week |
|
|
|
|
|
|
|
|
|
|
|
|
| Release | Date |
|
|
|
|
|
|
|
|
|
|
|
|
| Release | Day |
|
|
|
|
|
|
|
|
|
|
|
|
|
|
|
|
|
|
|
|
|
|
|
|
|
| Prior |
-0.51 |
-0.49 |
0.23 |
-0.19 |
-0.19 |
0.07 |
-0.15 |
-0.32 |
0.12 |
-0.16 |
0.02 |
-0.49 |
| Prior Revised |
... |
-0.46 |
... |
... |
-0.37 |
0.14 |
-0.28 |
-0.33 |
0.07 |
-0.22 |
-0.02 |
-0.66 |
| CONSENSUS |
... |
... |
0.18 |
0.00 |
... |
0.08 |
0.03 |
-0.30 |
0.15 |
0.05 |
... |
0.20 |
| Consensus Low |
... |
... |
0.10 |
... |
... |
-0.10 |
-0.05 |
-0.40 |
0.00 |
-0.25 |
... |
-0.49 |
| Consensus High |
... |
... |
0.26 |
... |
... |
0.15 |
0.20 |
-0.30 |
0.15 |
0.10 |
... |
0.20 |
| CFNAI M/M |
-0.49 |
0.23 |
-0.19 |
-0.19 |
0.07 |
-0.15 |
-0.32 |
0.12 |
-0.16 |
0.02 |
-0.49 |
0.03 |
| 3-month MA |
-0.33 |
-0.26 |
-0.13 |
0.01 |
-0.22 |
-0.14 |
-0.16 |
-0.13 |
-0.14 |
0.00 |
-0.22 |
-0.20 |
| RATING |
|
|
|
|
|
|
|
|
|
|
|
|
| Month For |
Dec-22 |
Jan-23 |
Feb-23 |
Mar-23 |
Apr-23 |
May-23 |
Jun-23 |
Jul-23 |
Aug-23 |
Sep-23 |
Oct-23 |
Nov-23 |
|
|
|
|
|
|
|
|
|
|
|
|
|
|
|
| |
|
| |
|
|
|
|
|
|
|
|
|
|
|
Release Schedule | 2022 |
|
|
Chicago Fed Nat Activity Index | Business Activity |
|
Today's Week |
|
|
|
|
|
|
|
|
|
|
|
|
|
Chicago Fed National Activity Index (At 8:30 a.m ET)
| SCHEDULE 2022 |
No 1 |
No 2 |
No 3 |
No 4 |
No 5 |
No 6 |
No 7 |
No 8 |
No 9 |
No 10 |
No 11 |
No 12 |
| Release | Week |
|
|
|
|
|
|
|
|
|
|
|
|
| Release | Date |
|
|
|
|
|
|
|
|
|
|
|
|
| Release | Day |
|
|
|
|
|
|
|
|
|
|
|
|
|
|
|
|
|
|
|
|
|
|
|
|
|
| Prior |
0.37 |
-0.15 |
0.69 |
0.51 |
0.44 |
0.47 |
0.01 |
-0.19 |
0.27 |
0.00 |
0.10 |
-0.05 |
| Prior Revised |
0.44 |
0.07 |
0.59 |
0.54 |
0.36 |
0.40 |
-0.19 |
-0.25 |
0.29 |
0.10 |
0.17 |
... |
| CONSENSUS |
0.25 |
0.15 |
0.75 |
0.40 |
0.13 |
... |
0.05 |
-0.19 |
0.24 |
... |
... |
... |
| Consensus Low |
0.21 |
0.15 |
... |
0.25 |
-0.44 |
... |
0.01 |
-0.25 |
0.23 |
... |
... |
... |
| Consensus High |
0.49 |
0.30 |
... |
0.40 |
0.50 |
... |
0.30 |
-0.02 |
0.40 |
... |
... |
... |
| CFNAI M/M |
-0.15 |
0.69 |
0.51 |
0.44 |
0.47 |
0.01 |
-0.19 |
0.27 |
0.00 |
0.10 |
-0.05 |
-0.51 |
| 3-month MA |
0.33 |
0.42 |
0.35 |
0.57 |
0.48 |
0.20 |
0.20 |
-0.09 |
0.01 |
0.17 |
0.09 |
-0.14 |
| RATING |
|
|
|
|
|
|
|
|
|
|
|
|
| Month For |
Dec-21 |
Jan-22 |
Feb-22 |
Mar-22 |
Apr-22 |
May-22 |
Jun-22 |
Jul-22 |
Aug-22 |
Sep-22 |
Oct-22 |
Nov-22 |
|
|
|
|
|
|
|
|
|
|
|
|
|
|
|
| |
|
| |
|
|
|
|
|
|
|
|
|
|
|
Release Schedule | 2021 |
|
|
Chicago Fed Nat Activity Index | Business Activity |
|
Today's Week |
|
|
|
|
|
|
|
|
|
|
|
|
|
Chicago Fed National Activity Index (At 8:30 a.m ET)
| SCHEDULE 2021 |
No 1 |
No 2 |
No 3 |
No 4 |
No 5 |
No 6 |
No 7 |
No 8 |
No 9 |
No 10 |
No 11 |
No 12 |
| Release | Week |
|
|
|
|
|
|
|
|
|
|
|
|
| Release | Date |
|
|
|
|
|
|
|
|
|
|
|
|
| Release | Day |
|
|
|
|
|
|
|
|
|
|
|
|
|
|
|
|
|
|
|
|
|
|
|
|
|
| Prior |
0.31 |
0.52 |
0.66 |
-1.09 |
1.71 |
0.24 |
0.29 |
0.09 |
0.53 |
0.29 |
-0.13 |
0.76 |
| Prior Revised |
0.27 |
0.41 |
0.75 |
-1.20 |
2.25 |
-0.09 |
0.26 |
-0.01 |
0.75 |
0.05 |
-0.18 |
0.75 |
| CONSENSUS |
0.28 |
0.40 |
0.72 |
... |
... |
0.50 |
0.30 |
0.10 |
0.50 |
... |
... |
... |
| Consensus Low |
0.10 |
0.39 |
0.21 |
... |
... |
0.15 |
0.28 |
-0.01 |
-0.24 |
... |
... |
... |
| Consensus High |
0.50 |
0.45 |
0.78 |
... |
... |
0.28 |
0.45 |
0.20 |
0.53 |
... |
... |
... |
| CFNAI M/M |
0.52 |
0.66 |
-1.09 |
1.71 |
0.24 |
0.29 |
0.09 |
0.53 |
0.29 |
-0.13 |
0.76 |
0.37 |
| 3-month MA |
0.60 |
0.47 |
-0.02 |
0.54 |
0.07 |
0.81 |
0.06 |
0.23 |
0.43 |
0.25 |
0.21 |
0.37 |
| RATING |
|
|
|
|
|
|
|
|
|
|
|
|
| Month For |
Dec-20 |
Jan-21 |
Feb-21 |
Mar-21 |
Apr-21 |
May-21 |
Jun-21 |
Jul-21 |
Aug-21 |
Sep-21 |
Oct-21 |
Nov-21 |
|
|
|
|
|
|
|
|
|
|
|
|
|
|
|
| |
|
| |
|
Legends: |
 |
Delayed |
 |
Positive View |
 |
Negative View |
 |
Neutral View |
 |
Non Available |
|
|
|
|
|
|
|
|
|
|
|
|
|
|
|
|
|
|
|
|
| |
|
|
|
|
|
|
|
|
|
|
|
|
|
|
|
|
|
|
|
|
|
Brief News | 2026 |
|
|
Chicago Fed Nat Activity Index | Business Activity |
|
Today's Week |
|
|
|
|
|
|
|
|
|
|
|
|
|
Chicago Fed National Activity Index (At 8:30 a.m ET)
| DATE/WEEK |
HIGHLIGHTS |
FOR |
CFNAI |
|
CFNAI |
No 12 |
... |
|
Nov-2026 |
|
| |
|
|
|
CFNAI |
No 11 |
... |
|
Oct-2026 |
|
| |
|
|
|
CFNAI |
No 10 |
... |
|
Sep-2026 |
|
| |
|
|
|
CFNAI |
No 9 |
... |
|
Aug-2026 |
|
| |
|
|
|
CFNAI |
No 8 |
... |
|
Jul 2026 |
|
| |
|
|
|
CFNAI |
No 7 |
... |
|
Jun-2026 |
|
| |
|
|
|
CFNAI |
No 6 |
... |
|
May-2026 |
|
| |
|
|
|
CFNAI |
No 5 |
... |
|
Apr-2026 |
|
| |
|
|
|
CFNAI |
No 4 |
... |
|
Mar-2026 |
|
| |
|
|
|
The Chicago Fed National Activity Index (CFNAI) decreased to –0.11 in February 2026 from +0.20 in January. Two of the four broad categories of indicators used to construct the index decreased from January, and three categories made negative contributions in February. The index's three-month moving average, CFNAI-MA3, increased to –0.01 in February from –0.02 in January. |
No 3 |
-0.11 |
|
Feb-2026 |
|
| |
|
|
|
The Chicago Fed National Activity Index (CFNAI) increased to +0.18 in January from –0.21 in December. All four broad categories of indicators used to construct the index increased from December, and two categories made positive contributions in January. The index’s three-month moving average, CFNAI-MA3, increased to –0.06 in January from –0.29 in December. The CFNAI Diffusion Index, which is also a three-month moving average, increased to –0.06 in January from –0.36 in December. Forty-seven of the 85 individual indicators made positive contributions to the CFNAI in January, while 38 made negative contributions. Fifty-seven indicators improved from December to January, while 28 indicators deteriorated. Of the indicators that improved, 20 made negative contributions. |
No 2 |
0.18 |
|
Jan-2026 |
|
| |
|
|
|
CFNAI fro December 2025 was -0.21. The report was delayed due to the government shut down, |
No 1 |
-0.21 |
|
Dec-2025 |
|
| |
|
|
|
The Chicago Fed National Activity Index (CFNAI) in the US rose to -0.04 in November 2025 from -0.42 in October which was the lowest in ten months, signalling that economic growth increased on the month. Production-related indicators contributed +0.08, up from -0.26 in October.The Chicago Fed National Activity Index (CFNAI ) is a closely watched indicator that captures real-time economic momentum in the United States. Scheduled for release on January 26 , 2026 , the CFNAI data will cover the combined months of October and November 2025 |
No 1 |
-0.04 |
|
Nov-2025 |
|
| |
|
|
|
Based on data from the Federal Reserve Bank of Chicago and related economic analysis, the Chicago Fed National Activity Index (CFNAI) indicated that U.S. economic growth declined in October 2025, with the index falling to -0.42 from -0.21 in September. The Chicago Fed National Activity Index (CFNAI ) is a closely watched indicator that captures real-time economic momentum in the United States. Scheduled for release on January 26 , 2026 , the CFNAI data will cover the combined months of October and November 2025 |
No 1 |
-0.42 |
|
Oct-2025 |
|
| |
|
|
|
|
|
|
|
|
| |
|
|
|
|
|
| |
|
|
|
|
|
|
|
|
|
|
|
|
|
|
|
Brief News | 2025 |
|
|
Chicago Fed Nat Activity Index | Business Activity |
|
Today's Week |
|
|
|
|
|
|
|
|
|
|
|
|
|
Chicago Fed National Activity Index (At 8:30 a.m ET)
| DATE/WEEK |
HIGHLIGHTS |
FOR |
CFNAI |
|
CFNAI for Nov. 2025: Delayed due to the government shut down, |
No 12 |
... |
|
Nov-2025 |
|
| |
|
|
|
The Chicago Fed National Activity Index (CFNAI) for September 2025 was -0.21, indicating a slight improvement from -0.31 in August but still signaling below-trend growth for the sixth consecutive month. While employment-related indicators turned positive, the overall negative reading was driven by continued softness in production, sales, and housing sectors. |
No 10 |
-0.21 |
|
Sep-2025 |
|
| |
|
|
|
CFNAI for Oct. 2025: Delayed due to the government shut down, |
No 11 |
... |
|
Oct-2025 |
|
| |
|
|
|
CFNAI for Sep. 2025: Delayed due to the government shut down, |
No 10 |
... |
|
Sep-2025 |
|
| |
|
|
|
The Chicago Fed National Activity Index (CFNAI) rose to negative 0.12 in August from a downwardly revised reading of negative 0.28 in July, according to the Federal Reserve Bank of Chicago. Expectations were for a rise to negative 0.17. The Chicago Fed National Activity Index (CFNAI) increased to –0.12 in August from –0.28 in July. Three of the four broad categories of indicators used to construct the index increased from July, but three categories made negative contributions in August. The index's three-month moving average, CFNAI-MA3, increased to –0.18 in August from –0.20 in July. |
No 9 |
-0.12 |
|
Aug-2025 |
|
| |
|
|
|
The Chicago Fed National Activity Index decreased to -0.19 in July 2025 from a downwardly revised -0.18 in June. The production-related category fell back into negative territory, driving the decrease. The other three categories of indicators used to construct the index increased from a month earlier. Two of these remained in negative territory, and one rose to a neutral value of zero. The index's three-month moving average increased to -0.18 from -0.26 in June. |
No 8 |
-0.19 |
|
Jul 2025 |
|
| |
|
|
|
The National Activity Index (CFNAI), reported by the Federal Reserve Bank of Chicago, stood at -0.10 in June 2025 following a reading of -0.16 in May, revised from -0.28, and -0.41 in April, revised from -0.36.The June reading reflected a negative contribution from each of the four component series. |
No 7 |
-0.10 |
|
Jun-2025 |
|
| |
|
|
|
The Chicago Fed national activity index (CFNAI) is up to minus 0.28 in May after minus 0.36 in April. The four broad categories of indicators that make up the index show 1 positive and 3 negative contributions in May. Among the categories 2 increased and 2 decreased. The Chicago Fed says,"Periods of economic expansion have historically been associated with values of the CFNAI Diffusion Index above -0.35." The CFNAI briefly dipped below that level in April but regains some ground in May, although still a negative. |
No 6 |
-0.28 |
|
May-2025 |
|
| |
|
|
|
The Chicago Fed national activity index (CFNAI) is down to minus 0.25 in April after positive 0.03 in March. The April index is down for a second month in a row and the lowest since minus 0.50 in October 2024. The four broad categories of indicators that make up the index show 1 positive and 3 negative contributions in April. Among the categories 1 increased and 3 decreased. |
No 5 |
-0.25 |
|
Apr-2025 |
|
| |
|
|
|
The Chicago Fed national activity index (CFNAI) is down to minus 0.03 in March after positive 0.24 in February. The four broad categories of indicators that make up the index show 1 positive and 3 negative contributions in March. Among the categories 2 increased and 2 decreased. While the February index got a boost from production-related indicators as manufacturers front-loaded some activity in anticipation of higher tariffs, that was exhausted in March. |
No 4 |
-0.03 |
|
Mar-2025 |
|
| |
|
|
|
The Chicago Fed national activity index (CFNAI) is up to positive 0.18 in February after negative 0.08 in January. The four broad categories of indicators that make up the index show 2 positive and 2 negative contributions in February. Among the categories 3 increased and 1 decreased. The February reading is up mainly due to a pickup in production that probably reflects a rebound after the intense cold weather in January shut down some activity. |
No 3 |
0.18 |
|
Feb-2025 |
|
| |
|
|
|
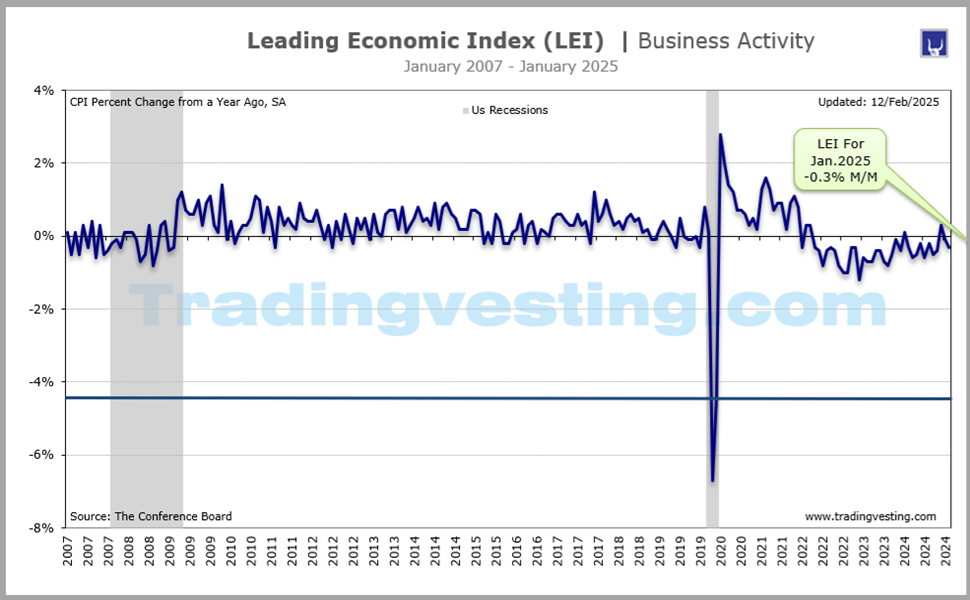
The Chicago Fed national activity index (CFNAI) is down to minus 0.03 in January after positive 0.18 in December. The January reading is below the consensus of 0.00 (zero) in the Econoday survey of forecasters. The four broad categories of indicators that make up the index show 2 positive and 2 negative contributions in January. Among the categories 1 increased and 3 decreased. The January reading is down mainly due to the softening in personal consumption and housing related indicators. Consumers pulled back spending at the start of the year after an active fourth quarter 2024 and increasing concerns about job security are adding worries about home affordability. |
No 2 |
-0.03 |
|
Jan-2025 |
|
| |
|
|
|
The Chicago Fed national activity index (CFNAI) is up to positive 0.15 in December after minus 0.01 in November. The four broad categories of indicators that make up the index show 2 positive and 2 negative contributions in December. Among the categories 2 increased and 1 decreased. The December index has its first positive reading since 0.23 in May 2024. The November index sees a substantial upward revision that probably reflects capturing some late data related to strike settlements and post-hurricane activity rebounds. |
No 1 |
0.15 |
|
Dec-2024 |
|
| |
|
|
|
|
|
|
|
|
| |
|
|
|
|
|
| |
|
|
|
|
|
|
|
|
|
|
|
|
|
|
|
Brief News | 2024 |
|
|
Chicago Fed Nat Activity Index | Business Activity |
|
Today's Week |
|
|
|
|
|
|
|
|
|
|
|
|
|
Chicago Fed National Activity Index (At 8:30 a.m ET)
| DATE/WEEK |
HIGHLIGHTS |
FOR |
CFNAI |
|
Index Suggests Economic Growth Increased in November 2024. The Chicago Fed National Activity Index (CFNAI) increased to –0.12 in November from –0.50 in October. Three of the four broad categories of indicators used to construct the index increased from October, but all four categories made negative contributions in November. The index's three-month moving average, CFNAI-MA3, decreased to –0.31 in November from –0.27 in October. |
No 12 |
-0.12 |
|
Nov-2024 |
|
| |
|
|
|
The Chicago Fed National Activity Index (CFNAI) decreased to –0.40 in October 2024 from –0.27 in September. It shows growth well under trend in October 2024. Three of the four broad categories of indicators used to construct the index decreased from September, and all four categories made negative contributions in October. The index's three-month moving average, CFNAI-MA3, decreased to –0.24 in October from –0.21 in September. |
No 11 |
-0.40 |
|
Oct-2024 |
|
| |
|
|
|
U.S. economic growth slipped back a little last month as Americans watch to see who will become their next president, according to a monthly index released Thursday. The Chicago Fed National Activity Index fell to minus 0.28 in September from minus 0.01 in August, the Federal Reserve Bank of Chicago said. A reading above zero is associated with better-than-average economic growth. All four categories that constitute the index made negative contributions. Production and employment fell back into negative territory over the month, while sales, orders & inventories remained negative. Personal consumption & housing also remained negative, though a little less so than in August. The index's three-month moving average declined to minus 0.19 from minus 0.14, adding to signs of a generally more sluggish trend in activity ahead of uncertain presidential elections due early in November. Periods of economic expansion have historically been associated with values of the CFNAI diffusion index above minus 0.35.The CFNAI diffusion index--which captures how much the change in the monthly index is spread among the indicators over three months--was meanwhile a little less negative, improving to minus 0.16 from minus 0.21 in August. |
No 10 |
-0.28 |
|
Sep-2024 |
|
| |
|
|
|
The Chicago Fed National Activity Index (CFNAI) increased to +0.12 in August 2024 from –0.42 revised in July 2024. Two of the four broad categories of indicators used to construct the index increased from July, and one category made a positive contribution in August. The index's three-month moving average, CFNAI-MA3, decreased to –0.17 in August from –0.13 in July. US Stocks Edge Higher; Chicago Fed National Activity Increases In August. US Stocks Edge Higher; Chicago Fed National Activity Increases In August 2024. The Chicago Fed National Activity Index rose to +0.12 in August versus a revised reading of -0.42 in the previous month and better than market expectations of -0.20. |
No 9 |
0.12 |
|
Aug-2024 |
|
| |
|
|
|
The Chicago Fed National Activity Index (CFNAI) fell to -0.34 in July from -0.09 in June. Two of the four broad categories of indicators used to construct the index decreased from June and three categories made negative contributions in July. The headline for the latest release of the Chicago Fed's National Activity Index (CFNAI) reads "Index suggests economic growth decreased in July". |
No 8 |
-0.34 |
|
Jul 2024 |
|
| |
|
|
|
The Chicago Fed national activity index (CFNAI) is down to positive 0.05 in June after 0.23 in May. The June reading is below the consensus of positive 0.10 in the survey of forecasters. The four broad categories of indicators that make up the index show 1 positive and 3 negative contributions in June. Among the categories all four decreased. Production-related indicators are down to positive 0.11 in June after positive 0.23 in May. Sales, orders, and inventories are down to 0.02 in June after positive 0.01 in the prior month. Employment-related indicators are down to 0.02 in June after positive 0.01 in May. Indicators for personal consumption and housing are down to minus 0.02 in June after positive 0.00 one month ago. |
No 7 |
0.05 |
|
Jun-2024 |
|
| |
|
|
|
The Chicago Fed National Activity Index (CFNAI) is up to a positive 0.18 in May after minus 0.26 in April. The reading is well above the consensus of minus 0.40 in the Econoday survey of forecasters. The report said,"Three of the four broad categories of indicators used to construct the index increased from April, and two categories made positive contributions in May." |
No 6 |
0.18 |
|
May-2024 |
|
| |
|
|
|
The Chicago Fed National Activity Index (CFNAI) is down to minus 0.23 in April after a downward revision to minus 0.04 in March. The Chicago Fed said,"Three of the four broad categories of indicators used to construct the index decreased from March, and all four categories made negative contributions in April." The reading for production-related indicators is weaker at minus 0.11 in April from a near-neutral minus 0.01 in March. Indicators for sales, orders, and inventories firm slightly to minus 0.03 in April from minus 0.06 in March. |
No 5 |
-0.23 |
|
Apr-2024 |
|
| |
|
|
|
The Chicago Fed national activity index is up to 0.15 in March after an upward revision to 0.09 in February. On net, the four broad categories are stronger in March, but not uniformly. Production-related indicators have a 0.11 contribution to the CFNAI, down a bit from 0.13 in February, but still a positive. The sales, orders, and inventories category is neutral (0.00) in March, up from minus 0.05 in February. The employment indicators category turns positive at 0.04 in March from minus 0.01 in February. The personal consumption and housing category dips below neutral to minus 0.01 in March after 0.02 in February. |
No 4 |
0.15 |
|
Mar-2024 |
|
| |
|
|
|
The CFNAI is up to a positive 0.05 in February after a downward revision to minus 0.54 in January. The February reading is well above the minus 0.50 in the Econoday survey of forecasters. The jump to positive territory reflects increases in three of four categories. However, the three-month moving average is down to minus 0.18 in February from minus 0.11 in January and has been negative for the past 16 months. The underlying trend for the CFNAI is consistent with moderating economic growth. |
No 3 |
0.05 |
|
Feb-2024 |
|
| |
|
|
|
The US economy got off to a stumbling start in 2024 based at least on the national activity index which fell 0.30 points or nearly double Economy's consensus. Production-related indicators (one of four components in this report) contracted sharply, pulling the headline index down by 0.16 points or double December's negative contribution. The consumption and housing component pulled the index down by 0.10 points versus December's positive 0.05 contribution. Sales, orders, and inventories contributed minus 0.04, down from December's plus 0.05, while employment was neutral in January as it was in December. |
No 2 |
-0.30 |
|
Jan-2024 |
|
| |
|
|
|
The Chicago Fed National Activity Index decreased to -0.15 in Dec 2023 from a revised +0.01 in Nov 2023, compared with market expectations of -0.02.Index suggests economic growth decreased in Decemberr 2023. |
No 1 |
-0.15 |
|
Dec-2023 |
|
| |
|
|
|
|
|
|
|
|
| |
|
|
|
|
|
| |
|
|
|
|
|
|
|
|
|
|
|
|
|
|
|
Brief News | 2023 |
|
|
Chicago Fed Nat Activity Index | Business Activity |
|
Today's Week |
|
|
|
|
|
|
|
|
|
|
|
|
|
Chicago Fed National Activity Index (At 8:30 a.m ET)
| DATE/WEEK |
HIGHLIGHTS |
FOR |
CFNAI |
|
Chicago Fed National Activity Index Increases For November 2023. The Chicago Fed National Activity Index increased to +0.03 in November, versus a revised reading of -0.66 in the prior month.They expected a 0.20 reading, well below expectations. |
No 12 |
0.03 |
|
Nov-2023 |
|
| |
|
|
|
The Chicago Fed national activity index is down to minus 0.49 in October after a downward revision to minus 0.02 in September. The index is below minus 0.12 in October 2022. The report noted that"all four broad categories of indicators used to construct the index decreased from September, and all four categories made negative contributions in October". The three-month moving average is down to minus 0.22 in October after 0.00 (neutral) in September. |
No 11 |
-0.49 |
|
Oct-2023 |
|
| |
|
|
|
The national activity index was within the range of expectations in September at 0.02, up from minus 0.22 in August, which was revised down from minus 0.16. The 3-month average was at zero after minus 0.14 the previous month. Readings point to economic growth close to historical trends. All four categories improved in September, although only two made a positive contribution: production and income at 0.03, up from minus 0.01 in August, and employment-related indicators at 0.01. By contrast, personal consumption and housing, and sales-related indicators both made a negative contribution of minus 0.01, each improving from minus 0.06. |
No 10 |
0.02 |
|
Sep-2023 |
|
| |
|
|
|
The national activity index surprised on the downside in August, when it came in at minus 0.16, down from a downwardly revised 0.07 level in July. The 3-month average was little changed at minus 0.14 versus minus 0.15 the previous month. All four categories had a negative contribution, as production and income (minus 0.02 after a positive 0.12 in July), as well as personal consumption and housing (minus 0.08 after 0.03) turned negative in August. The employment-related index was unchanged at minus 0.04, and the sales, orders, and inventories category came in at minus 0.03, a slight improvement from minus 0.04 in July. |
No 9 |
-0.16 |
|
Aug- 2023 |
|
| |
|
|
|
Lifted by industrial production, the national activity index jumped to a much better-than-expected 0.12 in July following contraction of minus 0.33 in June and minus 0.18 in May. The 3-month average, however, is little changed, at minus 0.13 versus June's minus 0.15 and remains in the negative column a zone indicating sub-par historical growth where it has been since November last year. |
No 8 |
0.12 |
|
jul-2023 |
|
| |
|
|
|
The Federal Reserve Bank of Chicago reported that its National Activity Index (CFNAI) slipped to -0.32 in June from -0.28 in May, revised from -0.15. The June CFNAI was constructed using data available as of July 20, 2023. At that time, June data for 51 of the 85 indicators had been published. For all missing data, estimates were used in constructing the index.
|
No 7 |
-0.32 |
|
Jun-2023 |
|
| |
|
|
|
CFNAI Index Suggests Economic Growth Declined in May. Led by declines in production-related indicators, the Chicago Fed National Activity Index (CFNAI) decreased to –0.15 in May from +0.14 in April. Two of the four broad categories of indicators used to construct the index decreased from April, and three of the four categories made negative contributions in May. The index’s three-month moving average, CFNAI-MA3, increased to –0.14 in May from –0.20 in April. |
No 6 |
-0.15 |
|
May-2023 |
|
| |
|
|
|
Chicago Fed National Activity Index Increases 0.07 in April 2023. The Chicago Fed National Activity Index increased into positive territory in April. Led by improvements in production-related indicators. However, the key 3-month average fell further into negative territory, pointing to increased recession risk. |
No 5 |
0.07 |
|
Apr-2023 |
|
| |
|
|
|
Chicago Fed National Activity Index (CFNAI) was unchanged at -0.19 in March 2023 vs. February. Chicago Fed National Activity Index stalls in March 2023. |
No 4 |
-0.19 |
|
Mar-2023 |
|
| |
|
|
|
US: Chicago Fed National Activity Index drops to -0.19 in February 2023 vs. 0.18 expected. Chicago Fed National Activity Index declined more than expected in February. The Federal Reserve Bank of Chicago's National Activity Index (CFNAI) declined to -0.19 in February from 0.23 in January. This reading came in weaker than the market expectation of 0.18. |
No 3 |
-0.19 |
|
Feb-2023 |
|
| |
|
|
|
US: Chicago Fed National Activity Index improves to 0.23 in January vs. 0.03 expected. Chicago Fed National Activity Index recovered sharply in January. The Federal Reserve Bank of Chicago's National Activity Index (CFNAI) rose to 0.23 in January from -0.46 in December. This reading came in much better than the market expectation of 0.03. "The CFNAI Diffusion Index, which is also a three-month moving average, edged up to –0.10 in January from –0.15 in December," the publication further read. "Fifty-one of the 85 individual indicators made positive contributions to the CFNAI in January, while 34 made negative contributions." |
No 2 |
0.23 |
|
Jan-2023 |
|
| |
|
|
|
The Chicago Fed National Activity Index (CFNAI) edged up to –0.49 in December from –0.51 in November. Three of the four broad categories of indicators used to construct the index made negative contributions in December, but two categories improved from November. The index’s three-month moving average, CFNAI-MA3, decreased to –0.33 in December from –0.14 in November. |
No 1 |
-0.49 |
|
Dec-2022 |
|
| |
|
|
|
|
|
|
|
|
| |
|
|
|
|
|
| |
|
|
|
|
|
|
|
|
|
|
|
|
|
|
|
Brief News | 2022 |
|
|
Chicago Fed Nat Activity Index | Business Activity |
|
Today's Week |
|
|
|
|
|
|
|
|
|
|
|
|
|
Chicago Fed National Activity Index (At 8:30 a.m ET)
| DATE/WEEK |
HIGHLIGHTS |
FOR |
CFNAI |
|
Chicago Fed National Activity Index Suggests slowed economic growth in December 2022. The CFNAI went down to -0.51 in November from -0.05 in October. The index’s three-month moving average, CFNAI-MA3, decreased to –0.14 in November. |
No 12 |
-0.51 |
|
Nov-2022 |
|
| |
|
|
|
US: Chicago Fed National Activity Index declines to -0.05 in October 2022. Chicago Fed's National Activity Index fell into negative territory in October. US Dollar Index clings to strong daily gains above 107.50. The Federal Reserve Bank of Chicago's National Activity Index (CFNAI) declined to -0.05 in October from 0.17 in September. The CFNAI Diffusion Index, which is also a three-month moving average, decreased to +0.13 in October from +0.25 in September," the publication further read. "Forty-five of the 85 individual indicators made positive contributions to the CFNAI in October, while 40 made negative contributions. |
No 11 |
-0.05 |
|
Oct-2022 |
|
| |
|
|
|
The Federal Reserve Bank of Chicago's National Activity Index (CFNAI) stayed unchanged at 0.1 in September. This reading came in slightly better than the market expectation of -0.04.. CFNAI Index Points to Steady Economic Growth in September. The Chicago Fed National Activity Index (CFNAI) was unchanged at +0.10 in September. Two of the four broad categories of indicators used to construct the index made positive contributions in September, but two categories deteriorated from August. The index’s three-month moving average, CFNAI-MA3, moved up to +0.17 in September from +0.04 in August. |
No 10 |
0.10 |
|
Sep-2022 |
|
| |
|
|
|
Chicago Fed national activity index unchanged in August at 0.00. U.S. economic activity slowed in August as production-related measures slipped and employment indicators rose moderately, data from the Federal Reserve Bank of Chicago showed on Monday. The Chicago Fed’s National Activity Index was neutral last month after an upwardly revised reading of 0.29 in July. The index was previously reported at 0.27 in July. It was at 0.08 from a year ago. A zero value for the monthly index has been associated with the national economy expanding at its historical trend. |
No 9 |
0.00 |
|
Aug-2022 |
|
| |
|
|
|
The Chicago Fed National Activity Index rose to 0.27 in July 2022 from a revised reading of minus 0.25 in June 2022, beating the minus 0.19 consensus forecast. The Chicago Fed National Activity Index increased to 0.27 in July of 2022, pointing to a pick up in national economic growth. The reading rebounded from a downwardly revised -0.25 in June. All four broad categories made positive contributions: production-related indicators contributed +0.16, up from -0.19 in June. |
No 8 |
0.27 |
|
Jul-2022 |
|
| |
|
|
|
The Federal Reserve Bank of Chicago’s National Activity Index held at minus 0.19 in June 2022, the first back-to-back negative readings since the pandemic started in early 2020. Chicago Fed National Activity Diffusion Index falls below zero. The three-month average, which smooths out monthly volatility, slipped to minus 0.04 in June from 0.09 a month earlier. Periods of economic expansion have historically been associated with an average higher than minus 0.7, according to the Chicago Fed. The regional Fed bank’s Diffusion Index, which is also a three-month moving average and shows the breadth of changes in the measured indicators, decreased to minus 0.04 in June. That marked the first negative reading since May 2020. |
No 7 |
-0.19 |
|
Jun-2022 |
|
| |
|
|
|
Softer print for Chicago Fed National Activity Index in May 2022 at 0.01, vs. 0.47 est. & 0.40 prior.That was underscored by a separate report from the Chicago Fed on Tuesday showing its National Activity Index fell to a reading of 0.01 in May from 0.40 in April, which it said "suggests economic growth declined in May." A zero value for the monthly index has been associated with the economy expanding at trend growth. Fears of a recession have been mounting in the wake of the Fed's decision last week to raise its policy rate by three-quarters of a percentage point, its biggest hike since 1994. The Fed has increased its benchmark overnight interest rate by 150 basis points since March. |
No 6 |
0.01 |
|
May-2022 |
|
| |
|
|
|
Chicago Fed: "Index suggests economic growth increased in April". The Chicago Fed National Activity Index (CFNAI) increased to +0.47 in April 2022 from +0.36 in March. All four broad categories of indicators used to construct the index made positive contributions in April, and three categories improved from March. The index’s three-month moving average, CFNAI-MA3, ticked down to +0.48 in April from +0.49 in March. |
No 5 |
0.47 |
|
Apr-2022 |
|
| |
|
|
|
The Chicago Fed National Activity Index decreased in March 2022, indicating a slight slowdown in U.S. economic growth. The index came in at 0.44, down from an upwardly revised 0.54 in February. Three of the four broad categories of indicators used to construct the index made positive contributions in March, but two categories deteriorated from February. The softening was apparent in the production-related component and the employment-related component. |
No 4 |
0.44 |
|
Mar-2022 |
|
| |
|
|
|
The Chicago Fed National Activity Index edged down to 0.51 in February of 2022 from 0.59 in January 2022, pointing to a slight decrease in economic growth. Production-related indicators contributed 0.22, down slightly from 0.25 in January; and the contribution of the personal consumption and housing category fell to –0.04 from 0.21. On the other hand, the contribution of the sales, orders, and inventories category was unchanged at 0.04; and employment-related indicators contributed 0.28, up from 0.10. The index’s three-month moving average, CFNAI-MA3, ticked down to 0.35 in February from 0.37 in January |
No 3 |
0.51 |
|
Feb-2022 |
|
| |
|
|
|
Chicago Fed National Activity Index Rises in January 2022. The Chicago Fed National Activity Index in the US increased to +0.69 in January of 2022 from a revised 0.07 in the previous month, suggesting a pick up in economic activity. |
No 2 |
0.69 |
|
Jan-2022 |
|
| |
|
|
|
The Chicago Fed National Activity Index in the US dropped to -0.15 in December 2021 from an upwardly revised +0.44 in the previous month, suggesting there was a contraction in economic activity following a two-month period of expansion. |
No 1 |
-0.15 |
|
Dec-2021 |
|
| |
|
|
|
|
|
|
|
|
| |
|
|
|
|
|
| |
|
|
|
|
|
|
|
|
|
|
|
|
|
|
|
Brief News | 2021 |
|
|
Chicago Fed Nat Activity Index | Business Activity |
|
Today's Week |
|
|
|
|
|
|
|
|
|
|
|
|
|
Chicago Fed National Activity Index (At 8:30 a.m ET)
| DATE/WEEK |
HIGHLIGHTS |
FOR |
CFNAI |
|
The Chicago Fed National Activity Index dropped to 0.37 in November of 2021, from a three-month high of 0.75 in Octobe 2021r, pointing to a slowdown in US economic growth. Production-related indicators contributed +0.21 in November, down from +0.42 in October, as industrial production increased 0.5%, after rising 1.7% in the previous month. The contribution of the sales, orders, and inventories category edged down to +0.03 from +0.06; employment-related indicators contributed +0.18, down slightly from +0.23; and the contribution of the personal consumption and housing category moved down to –0.05 in November from +0.04 in October. On the other hand, the index’s three-month moving average moved up to +0.37 in November from +0.25 in October |
No 12 |
0.37 |
|
Nov-2021 |
|
| |
|
|
|
Index points to a pickup in economic growth in October 2021.
Led by improvements in production-related indicators, the Chicago Fed National Activity Index (CFNAI) rose to +0.76 in October 2021 from –0.18 in September 2021. All four broad categories of indicators used to construct the index made positive contributions in October, and all four categories improved from September. The index’s threemonth moving average, CFNAI-MA3, ticked down to +0.21 in October from +0.22 in September. |
No 11 |
0.76 |
|
Oct-2021 |
|
| |
|
|
|
Chicago Fed National Activity Index at 7-Month Low The Chicago Fed National Activity Index dropped to -0.13 in September of 2021 from 0.05 in August, the lowest since April and showing economic growth in the US lost momentum for a second consecutive month. Production-related indicators contributed -0.37, down from -0.08 in August, as industrial production declined 1.3%. The contribution of the sales, orders, and inventories category to moved up to +0.07 from +0.01 and employment-related indicators contributed +0.16, up from +0.09. The contribution of the personal consumption and housing category was unchanged at +0.02. Also, the index’s three-month moving average moved down to +0.25 in September from +0.38 in August. |
No 10 |
-0.13 |
|
Sep-2021 |
|
| |
|
|
|
US Chicago Fed National Activity Index Edges Down. The Chicago Fed National Activity Index fell to 0.29 in August of 2021 from an upwardly revised 0.75 in July, pointing to slower, but still above-average growth. Production-related indicators contributed +0.11, down from +0.40 in July. The contribution of the sales, orders, and inventories category moved down to +0.03 from +0.07 in July; and the contribution of the employment, unemployment, and hours category to the CFNAI decreased to +0.12 in August from +0.38 in July. Meanwhile, the personal consumption and housing category contributed +0.03, up from –0.09 in July. The index’s three-month moving average, CFNAI-MA3, moved up to +0.43 in August from +0.36 in July. |
No 9 |
-0.29 |
|
Aug-2021 |
|
| |
|
|
|
US Chicago Fed National Activity Index Picks Up. The Chicago Fed National Activity Index increased to 0.53 in July of 2021 from a downwardly revised -0.01 in June, pointing to a pickup in overall business activity. Production-related indicators contributed +0.38, up from -0.09 in June. The contribution of the sales, orders, and inventories category increased to +0.02 from -0.06; the contribution of the employment, unemployment, and hours category rose to +0.30 from +0.14; while the personal consumption and housing category contributed -0.15,down from +0.01 in June. The index’s three-month moving average, CFNAI-MA3, moved up to +0.23 in July from +0.01 in June. |
No 8 |
0.53 |
|
Jul-2021 |
|
| |
|
|
|
US Chicago Fed National Activity Index Falls in June 2021. The Chicago Fed National Activity Index went down to 0.09 in June of 2021 from a downwardly revised 0.26 in May. Production-related indicators contributed +0.01, down from +0.26 in May. The contribution of the employment, unemployment, and hours category moved down to +0.09 from +0.15. Meantime, the personal consumption and housing category contributed -0.08, up slightly from -0.11; and the contribution of the sales, orders, and inventories category increased to +0.06 from -0.04. The index’s three-month moving average declined to +0.06 from +0.80. |
No 7 |
0.09 |
|
Jun-2021 |
|
| |
|
|
|
Chicago Fed Activity Index Rebounds. The Chicago Fed National Activity Index increased to 0.29 in May of 2021 but they expected 0.50, from a downwardly revised -0.09 in April, pointing to a pick up in economic growth, led by improvements in production-related indicators. Production-related indicators contributed +0.29, up from -0.05 in April; the contribution of the employment, unemployment, and hours category rose to +0.16 from +0.06 and the contribution from the sales, orders, and inventories category was +0.02 compared to -0.06. On the other hand, the personal consumption and housing category contributed -0.18, down from -0.04. The index’s three-month moving average went up to +0.81 from +0.17 |
No 6 |
0.29 |
|
May-2021 |
|
| |
|
|
|
Chicago Fed Index Points to Slow Down in Growth. The Chicago Fed National Activity Index fell to 0.24 in April of 2021 from an 8-month high of 1.71 in March, suggesting a slowdown in economic growth. Production-related indicators contributed +0.18, down from +0.92 in March. The contribution of the employment, unemployment, and hours category decreased to +0.05 from +0.38. Also, the personal consumption and housing category contributed –0.06, down from +0.50 in March. In contrast, the contribution of the sales, orders, and inventories moved up to +0.07 from -0.09. The index’s three-month moving average decreased to +0.07 in April from +0.35 in March. |
No 5 |
0.24 |
|
Apr-2021 |
|
| |
|
|
|
Chicago Fed National Activity Index Climbs to +1.71 in March 2021. Latest Chicago Fed National Activity Index (CFNAI) shows that all four broad categories of indicators used to construct the index made positive contributions in March 2021, and all four improved from February. Led by improvements in indicators related to production and personal consumption and housing, the Chicago Fed National Activity Index (CFNAI) rose to +1.71 in March from -1.20 in February. All four broad categories of indicators used to construct the index made positive contributions in March, and all four categories improved from February. The index’s three-month moving average, CFNAI-MA3, increased to +0.54 in March from +0.07 in February. |
No 4 |
1.71 |
|
Mar-2021 |
|
| |
|
|
|
Chicago Fed National Activity Index down in February 2021. February Chicago Fed National Activity Index: -1.09 vs. +0.72 consensus, +0.75 prior (revised from +0.66). The three-month moving average moved down to -0.02 in February from +0.46 (revised) in January. U.S. economy contracted in February, Chicago Fed index shows. |
No 3 |
-1.09 |
|
Feb-2021 |
|
| |
|
|
|
Chicago Fed National Activity Index at 3-Month High. The Chicago Fed National Activity Index in the US increased to 0.66 in January of 2021 from a downwardly revised 0.41 in December 2020. The reading pointed to the strongest activity growth in 3 months, led by improvements in personal consumption-related indicators (+0.35 from -0.06). Meanwhile, production-related indicators contributed +0.28, down from +0.37 in December. The contribution of the sales, orders, and inventories category edged down to +0.02 from +0.05 and employment-related indicators contributed +0.01, down slightly from +0.05 in December. The index’s three-month moving average, CFNAI-MA3, decreased to +0.47 in January from +0.60 in December. |
No 2 |
0.66 |
|
Jan-2021 |
|
| |
|
|
|
The Chicago Fed National Activity Index in the US jumped to 0.52 in December of 2020 from an upwardly revised 0.31 in November. The reading pointed to the 8th consecutive month of growing activity, led by improvements in production-related indicators (0.44 vs 0.13). On the other hand, the contribution of the sales, orders, and inventories category moved down to 0.05 from 0.09 and employment-related indicators to 0.13 from 0.15 in November while the contribution of the personal consumption and housing category fell further to -0.09 from -0.06.
The index’s three-month moving average, CFNAI-MA3, ticked up to 0.61 in December from 0.59 in November |
No 1 |
0.52 |
|
Dec-2020 |
|
| |
|
|
|
|
|
|
|
|
| |
|
|
|
|
|
| |
|
Legends: |
|
Delayed |
|
Positive View |
|
Negative View |
|
Neutral View |
|
Non Available |
|
|
|
|
|
|
|
|
|
|
|
|
|
|
|
|
|
|
|
|
| |
|
|
|
|
|
|
|
|
|
|
|
|
|
|
|
|
|
|
|
|
|
Definitions | Explain |
|
|
Chicago Fed Nat Activity Index | Business Activity |
|
Today's Week |
|
|
|
|
|
|
|
|
|
|
|
|
| |
|
|
|
|
| |
|
| CFNAI |
What is it ?
The Federal Reserve Bank of Chicago’s National Activity Index, CFNAI is released at 8:30 a.m. A zero value for the index indicates that the national economy is expanding at its historical trend rate of growth; negative values indicate below-average growth; and positive values indicate above-average growth suggesting there was a contraction in economic activity. decrease in economic growth, slowdown in U.S. economic growth.suggests economic growth declined or decreased. suggesting a pick up in economic activity.. Periods of economic expansion have historically been associated with an average higher than minus 0.7. A zero value for the monthly index has been associated with the national economy expanding at its historical trend. CFNAI-MA3: The three-month average, which smooths out monthly volatility. The CFNAI Diffusion Index, which is also a three-month moving average.
The Chicago Fed Explains The Chicago Fed National Activity Index (CFNAI) provides a summary quantitative value for all the economic data being released. However, this index IS NOT accurate in real time and it did miss the start of the 2007 recession. This index is unique among regional Federal Reserve Bank indexes in that it is national in scope. The Chicago Fed National Activity Index (CFNAI) provides useful information on the current state of economic activity and inflationary pressures in the United States. Movements in the CFNAI closely track periods of economic expansion and contraction, as well as periods of rising and falling inflationary pressures. The 85 economic indicators underlying the CFNAI are drawn from five broad categories of data: output and income, employment, unemployment and hours, personal consumption, housing starts and sales, manufacturing and trade sales, and inventories and orders, each of these data series measures some aspect of overall macroeconomic activity. When the CFNAI-MA3 value moves below -0.70 following a period of economic expansion, there is an increasing likelihood that a recession has begun. Conversely, when the CFNAI-MA3 value moves above -0.70 following a period of economic contraction, there is an increasing likelihood that a recession has ended. What makes this report somewhat unique is that the regional Federal Reserve Bank indexes are local to one Fed region and this index is national in scope. Unfortunately, it is also older data compared to at least some more concurrent economic reports in the past 10 days or so.
CFNAI The Chicago Fed National Activity Index (CFNAI) is a monthly index designed to better gauge overall economic activity and inflationary pressure. The CFNAI is a weighted average of 85 indicators of national economic activity. It is constructed to have an average value of zero and a standard deviation of one.
Since economic activity tends toward trend growth rate over time, a positive index reading corresponds to growth above trend and a negative index reading corresponds to growth below trend.
The Chicago Fed advises that a value below -0.70 after a period of economic expansion indicates an increasing likelihood that a recession has begun. A zero value for the index indicates that the national economy is expanding at its historical trend rate of growth, and that a level below -0.7 would be indicating a recession was likely underway.
The CFNAI is released at 8:30 a.m. E.T. on scheduled days, normally toward the end of each calendar month and is low importance.
Each of these data series measures some aspect of overall macroeconomic activity. The derived index provides a single, summary measure of a factor common to these national economic data.
The 85 economic indicators that constructed the Chicago Fed national index were drawn from four broad categories of data:
1) production and income;
2) employment, unemployment and hours;
3) personal consumption and housing; and
4) sales, orders and inventories.
The Chicago Fed National Activity Index (CFNAI) is a measure of how the national economy is faring relative to its historical trend rate.
The 3 Month Moving Average
When the CFNAI-MA3 moves above -0.70 following a period of economic contraction, there is an increasing likelihood that a recession has ended; surpassing a level of +0.20 indicates economic activity associated with sustained recovery. The Chicago Fed National Activity Index (CFNAI) provides a summary quantitative value for all the economic data being released. However, this index is not accurate in real time and it did miss the start of the 2007 recession. This index is a rear view mirror of the economy, and whilst the tend is clearly negative the index is telling that the economy did expand in June but that the expansion was significantly weaker than the previous month. A zero value for the index indicates that the national economy is expanding at its historical trend rate of growth, and that a level below -0.7 would be indicating a recession was likely underway. The three-month average of the index, which is a weighted average of 85 different economic indicators, is designed so that a zero reading equals trend growth and a reading below negative 0.70 indicates an increasing likelihood a recession has begun.
|
|
|
| |
|
|
|
|
|
|
|
|
|
|
|
|
|
|
|
|
|
|
|
|
|
Data | Source |
|
|
Chicago Fed Nat Activity Index | Business Activity |
|
Today's Week |
|
|
|
|
|
|
|
|
|
|
|
|
| |
|
|
|
|
|
|
| DATA INFORMATION |
CFNAI |
| SOURCE |
The Conference Board |
| WEB |
http://www.conference-board.org |
| FREQUENCY |
Monthly |
| AVAILABILITY |
Third week of the month. |
| COVERAGE |
Data are for the previous month. Data for June are released in July. |
| REVISIONS |
Yes |
| IMPORTANCE |
Business Activity - Low Importance |
|
| |
|
|
|
|
|
|
|
|
|
|
|
|