|
 |
|
 |
Wholesale Trade Pre | Sales and Inventories |
|
 |
|
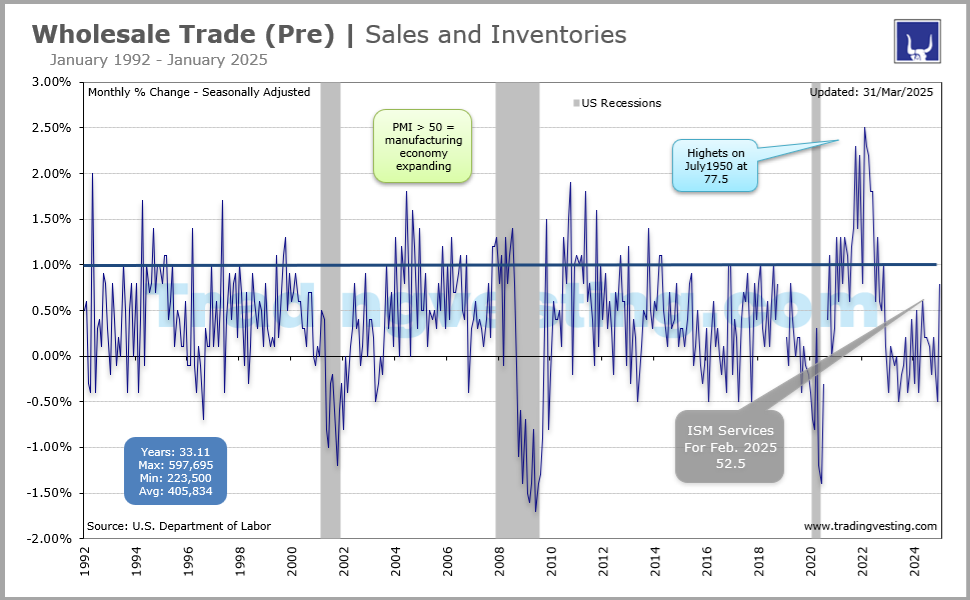
Wholesale inventory consists of finished good products received from manufacturers or distributors that have not yet been sold to customers.The second estimate of wholesale inventories.. Read More
|
|
|
|
|
|
|
| |
|
| |
 3. Wholesale Trade Pre (3 of 6)
 4. Wholesale Trade Adv (4 of 6)
 5. Retail inventories (5 of 6)
 6. E-Commerce (6 of 6)
 1. Retail Sales (1 of 6)
 2. Business Inventories (2 of 6)
|
 |
|
|
|
|
| |
|
→ Big Chart |
|
→ Release |
|
| |
|
US dollar es relative to inventorieds |
|
|
|
|
|
|
|
|
|
|
|
|
|
|
|
|
|
 |
|
Big Chart | Large Data |
 |
|
Wholesale Trade (Pre) | Sales and Inventories |
|
Today's Week |
 |
|
|
|
|
|
|
|
|
|
|
|
|
|
| |
|
|
|
|
|
|
|
|
|
|
|
|
|
|
|
|
|
|
|
|
|
Slides | Six 6 |
|
|
Wholesale Trade (Pre) | Sales and Inventories |
|
Today's Week |
|
|
|
|
|
|
|
|
|
|
|
|
|
|
| |
|
|
|
|
|
|
|
|
|
|
|
|
|
|
|
|
|
|
|
|
|
Release Schedule | 2026 |
|
|
Wholesale Trade (Pre) | Sales and Inventories |
|
Today's Week |
|
|
|
|
|
|
|
|
|
|
|
|
|
Wholesale Inventories (Pre) | Sales and Inventories (At 10:00 a.m ET)
| SCHEDULE 2026 |
No 1 |
No 2 |
No 3 |
No 4 |
No 5 |
No 6 |
No 7 |
No 8 |
No 9 |
No 10 |
No 11 |
No 12 |
| Release | Week |
|
|
|
|
|
|
|
|
|
|
|
|
| Release | Date |
|
|
|
|
|
|
|
|
|
|
|
|
| Release | Day |
|
|
|
|
|
|
|
|
|
|
|
|
 |
|
|
|
|
|
|
|
|
|
|
|
|
| Prior |
... |
0.2% |
0.2% |
... |
... |
... |
... |
... |
... |
... |
... |
... |
| Prior Revised |
... |
0.2% |
-0.1% |
... |
... |
... |
... |
... |
... |
... |
... |
... |
| Adv Flash^ |
... |
0.2% |
... |
... |
... |
... |
... |
... |
... |
... |
... |
... |
| CONSESNUS |
... |
... |
... |
... |
... |
... |
... |
... |
... |
... |
... |
... |
| Consensus Low |
... |
... |
... |
... |
... |
... |
... |
... |
... |
... |
... |
... |
| Consensus High |
... |
... |
... |
... |
... |
... |
... |
... |
... |
... |
... |
... |
| ACTUAL LEVEL |
... |
0.2% |
-0.5% |
... |
... |
... |
... |
... |
... |
... |
... |
... |
| Month For |
|
|
|
|
|
|
|
|
|
|
|
|
| RATING |
Nov-24 |
Dec 24 |
Jan-25 |
Feb-25 |
Mar-25 |
Apr-25 |
May-25 |
Jun-25 |
Jul-25 |
Aug-25 |
Sep-25 |
Oct-25 |
|
|
|
|
|
|
|
|
|
|
|
|
|
|
|
| |
|
| |
|
|
|
|
|
|
|
|
|
|
|
Release Schedule | 2025 |
|
|
Wholesale Trade (Pre) | Sales and Inventories |
|
Today's Week |
|
|
|
|
|
|
|
|
|
|
|
|
|
Wholesale Inventories (Pre) | Sales and Inventories (At 10:00 a.m ET)
| SCHEDULE 2025 |
No 1 |
No 2 |
No 3 |
No 4 |
No 5 |
No 6 |
No 7 |
No 8 |
No 9 |
No 10 |
No 11 |
No 12 |
| Release | Week |
|
|
|
|
|
|
|
|
|
|
|
|
| Release | Date |
|
|
|
|
|
|
|
|
|
|
|
|
| Release | Day |
|
|
|
|
|
|
|
|
|
|
|
|
|
|
|
|
|
|
|
|
|
|
|
|
|
| Prior |
0.2% |
-0.2% |
-0.5% |
0.8% |
0.3% |
0.4% |
0.2% |
-0.3% |
0.1% |
0.1% |
0.0% |
0.5% |
| Prior Revised |
0.0% |
-0.1% |
-0.4% |
... |
0.5% |
0.3% |
0.1% |
... |
0.2% |
0.1% |
-0.1% |
... |
| Adv Flash^ |
-0.2% |
-0.5% |
0.7% |
0.3% |
0.5% |
0.0% |
-0.3% |
0.2% |
0.2% |
-0.2% |
... |
... |
| CONSESNUS |
-0.2% |
-0.5% |
... |
0.3% |
0.5% |
0.0% |
-0.3% |
0.2% |
0.2% |
-0.2% |
0.1% |
0.2% |
| Consensus Low: |
-0.2% |
-0.5% |
... |
0.3% |
0.5% |
0.0% |
-0.3% |
0.2% |
-0.1% |
-0.2% |
-0.2% |
-0.1% |
| Consensus High: |
-0.2% |
-0.5% |
... |
0.5% |
0.6% |
0.0% |
0.0% |
0.2% |
0.3% |
0.1% |
0.2% |
0.3% |
| ACTUAL LEVEL: |
-0.2% |
-0.5% |
0.8% |
0.3% |
0.4% |
0.2% |
-0.3% |
0.1% |
0.1% |
0.0% |
0.5% |
0.2% |
| Month For: |
|
|
|
|
|
|
|
|
|
|
|
|
| RATING |
Nov-24 |
Dec 24 |
Jan-25 |
Feb-25 |
Mar-25 |
Apr-25 |
May-25 |
Jun-25 |
Jul-25 |
Aug-25 |
Sep-25 |
Oct-25 |
|
|
|
|
|
|
|
|
|
|
|
|
|
|
|
| |
|
| |
|
|
|
|
|
|
|
|
|
|
|
Release Schedule | 2024 |
|
|
Wholesale Trade (Pre) | Sales and Inventories |
|
Today's Week |
|
|
|
|
|
|
|
|
|
|
|
|
|
Wholesale Inventories (Pre) | Sales and Inventories (At 10:00 a.m ET)
| SCHEDULE 2024 |
No 1 |
No 2 |
No 3 |
No 4 |
No 5 |
No 6 |
No 7 |
No 8 |
No 9 |
No 10 |
No 11 |
No 12 |
| Released Week: |
|
|
|
|
|
|
|
|
|
|
|
|
| Released Date: |
|
|
|
|
|
|
|
|
|
|
|
|
| Released Day: |
|
|
|
|
|
|
|
|
|
|
|
|
| Prior: |
-0.4% |
-0.2% |
0.4% |
-0.3% |
0.5% |
-0.4% |
0.1% |
0.6% |
0.2% |
0.2% |
0.1% |
-0.2% |
| Prior Revised: |
... |
-0.4% |
... |
... |
... |
-0.5% |
0.2% |
0.5% |
0.0% |
... |
0.2% |
... |
| Flash: |
-0.2% |
0.4% |
-0.1% |
0.5% |
-0.4% |
0.2% |
0.6% |
0.2% |
0.3% |
0.2% |
-0.1% |
0.2% |
| Estimate: |
-0.1% |
0.4% |
-0.1% |
0.5% |
-0.4% |
0.2% |
0.6% |
0.2% |
0.3% |
0.2% |
... |
0.1% |
| Consensus Low: |
0.2% |
0.2% |
-0.5% |
0.1% |
-0.4% |
0.2% |
0.4% |
0.2% |
0.2% |
0.2% |
... |
0.0% |
| Consensus High: |
0.0% |
0.4% |
0.2% |
0.8% |
-0.1% |
0.2% |
0.6% |
0.6% |
0.3% |
0.2% |
... |
0.2% |
| ACTUAL LEVEL: |
-0.2% |
0.4% |
-0.3% |
0.5% |
-0.4% |
0.1% |
0.6% |
0.2% |
0.2% |
0.1% |
-0.2% |
0.2% |
| Month For: |
|
|
|
|
|
|
|
|
|
|
|
|
| RATING |
Nov-23 |
Dec 23 |
Jan-24 |
Feb-24 |
Mar-24 |
Apr-24 |
May-24 |
Jun-24 |
Jul-24 |
Aug-24 |
Sep-24 |
Oct-24 |
|
|
|
|
|
|
|
|
|
|
|
|
|
|
|
| |
|
| |
|
|
|
|
|
|
|
|
|
|
|
Release Schedule | 2023 |
|
|
Wholesale Trade (Pre) | Sales and Inventories |
|
Today's Week |
|
|
|
|
|
|
|
|
|
|
|
|
|
Wholesale Inventories (Pre) | Sales and Inventories (At 10:00 a.m ET)
| SCHEDULE 2023 |
No 1 |
No 2 |
No 3 |
No 4 |
No 5 |
No 6 |
No 7 |
No 8 |
No 9 |
No 10 |
No 11 |
No 12 |
| Released Week: |
|
|
|
|
|
|
|
|
|
|
|
|
| Released Date: |
|
|
|
|
|
|
|
|
|
|
|
|
| Released Day: |
|
|
|
|
|
|
|
|
|
|
|
|
| Prior: |
0.5% |
1.0% |
0.1% |
-0.4% |
0.1% |
0.0% |
-0.1% |
0.0% |
-0.5% |
-0.2% |
-0.1% |
0.2% |
| Prior Revised: |
... |
0.9% |
... |
-0.6% |
-0.6% |
-0.2% |
-0.3% |
-0.4% |
-0.7% |
-0.3% |
... |
0.0% |
| Consensus: |
1.0% |
0.1% |
-0.4% |
0.2% |
0.2% |
-0.2% |
-0.1% |
-0.3% |
-0.1% |
-0.1% |
0.0% |
-0.2% |
| Consensus Low: |
1.0% |
0.1% |
-0.5% |
-0.1% |
-0.1% |
-0.2% |
-0.1% |
-0.3% |
-0.3% |
-0.1% |
0.0% |
-0.2% |
| Consensus High: |
1.0% |
0.5% |
-0.1% |
0.3% |
0.3% |
-0.1% |
-0.1% |
-0.3% |
-0.1% |
0.2% |
0.2% |
0.2% |
| ACTUAL LEVEL: |
1.0% |
0.1% |
-0.4% |
0.1% |
0.1% |
-0.1% |
0.0% |
-0.5% |
-0.2% |
-0.1% |
0.2% |
-0.4% |
| Month For: |
|
|
|
|
|
|
|
|
|
|
|
|
| RATING |
Nov-22 |
Dec 22 |
Jan-23 |
Feb-23 |
Mar-23 |
Apr-23 |
May-23 |
Jun-23 |
Jul-23 |
Aug-23 |
Sep-23 |
Oct-23 |
|
|
|
|
|
|
|
|
|
|
|
|
|
|
|
| |
|
| |
|
|
|
|
|
|
|
|
|
|
|
Release Schedule | 2022 |
|
|
Wholesale Trade (Pre) | Sales and Inventories |
|
Today's Week |
|
|
|
|
|
|
|
|
|
|
|
|
|
Wholesale Inventories (Pre) | Sales and Inventories (At 10:00 a.m ET)
| SCHEDULE 2022 |
No 1 |
No 2 |
No 3 |
No 4 |
No 5 |
No 6 |
No 7 |
No 8 |
No 9 |
No 10 |
No 11 |
No 12 |
| Released Week: |
|
|
|
|
|
|
|
|
|
|
|
|
| Released Date: |
|
|
|
|
|
|
|
|
|
|
|
|
| Released Day: |
|
|
|
|
|
|
|
|
|
|
|
|
| Prior: |
2.3% |
1.4% |
2.2% |
0.8% |
2.5% |
2.3% |
2.2% |
1.8% |
1.8% |
0.6% |
1.3% |
0.6% |
| Prior Revised: |
2.5% |
1.7% |
2.6% |
1.2% |
2.8% |
2.7% |
... |
1.9% |
... |
... |
1.4% |
... |
| Consensus: |
1.2% |
2.0% |
0.8% |
1.5% |
2.3% |
2.1% |
2.0% |
1.9% |
0.8% |
1.3% |
0.8% |
0.8% |
| Consensus Low: |
0.5% |
0.7% |
0.7% |
0.5% |
1.8% |
2.1% |
2.0% |
1.0% |
0.8% |
1.1% |
0.6% |
0.3% |
| Consensus High: |
1.2% |
2.1% |
1.0% |
2.1% |
2.3% |
2.1% |
2.1% |
1.9% |
1.3% |
1.3% |
0.9% |
0.8% |
| ACTUAL LEVEL: |
1.4% |
2.2% |
0.8% |
2.5% |
2.3% |
2.2% |
1.8% |
1.8% |
0.6% |
1.3% |
0.6% |
0.5% |
| Month For: |
|
|
|
|
|
|
|
|
|
|
|
|
| RATING |
Nov-21 |
Dec 21 |
Jan-22 |
Feb-22 |
Mar-22 |
Apr-22 |
May-22 |
Jun-22 |
Jul-22 |
Aug-22 |
Sep-22 |
Oct-22 |
|
|
|
|
|
|
|
|
|
|
|
|
|
|
|
| |
|
| |
|
|
|
|
|
|
|
|
|
|
|
Release Schedule | 2021 |
|
|
Wholesale Trade (Pre) | Sales and Inventories |
|
Today's Week |
|
|
|
|
|
|
|
|
|
|
|
|
|
Wholesale Inventories (Pre) | Sales and Inventories (At 10:00 a.m ET)
| SCHEDULE 2021 |
No 1 |
No 2 |
No 3 |
No 4 |
No 5 |
No 6 |
No 7 |
No 8 |
No 9 |
No 10 |
No 11 |
No 12 |
| Released Week: |
|
|
|
|
|
|
|
|
|
|
|
|
| Released Date: |
|
|
|
|
|
|
|
|
|
|
|
|
| Released Day: |
|
|
|
|
|
|
|
|
|
|
|
|
| Prior: |
0.0% |
0.0% |
0.3% |
1.3% |
0.6% |
1.3% |
0.8% |
1.3% |
1.1% |
2.3% |
1.2% |
1.4% |
| Prior Revised: |
... |
... |
... |
... |
... |
1.2% |
1.1% |
... |
... |
... |
... |
... |
| Consensus: |
0.1% |
0.1% |
1.3% |
0.5% |
1.4% |
0.8% |
1.0% |
0.8% |
2.0% |
1.3% |
1.0% |
2.2% |
| Consensus Low: |
0.1% |
0.1% |
0.4% |
0.4% |
0.5% |
0.7% |
0.2% |
0.4% |
0.7% |
0.3% |
0.3% |
0.9% |
| Consensus High: |
0.2% |
0.2% |
1.3% |
1.0% |
1.4% |
1.0% |
1.1% |
1.1% |
2.7% |
1.1% |
1.1% |
3.1% |
| ACTUAL LEVEL: |
0.0% |
0.3% |
1.3% |
0.6% |
1.3% |
0.8% |
1.3% |
1.1% |
2.3% |
1.2% |
1.4% |
2.3% |
| Month For: |
|
|
|
|
|
|
|
|
|
|
|
|
| RATING |
Nov-20 |
Dec 20 |
Jan-21 |
Feb-21 |
Mar-21 |
Apr-21 |
May-21 |
Jun-21 |
Jul-21 |
Aug-21 |
Sep-21 |
Oct-21 |
|
|
|
|
|
|
|
|
|
|
|
|
|
|
|
| |
|
| |
|
Legends: |
 |
Delayed |
 |
Positive View |
 |
Negative View |
 |
Neutral View |
 |
Non Available |
|
|
|
|
|
|
|
|
|
|
|
|
|
|
|
|
|
|
|
|
| |
|
|
|
|
|
|
|
|
|
|
|
|
|
|
|
|
|
|
|
|
|
Brief News | 2026 |
|
|
Wholesale Trade (Pre) | Sales and Inventories |
|
Today's Week |
|
|
|
|
|
|
|
|
|
|
|
|
|
Wholesale Inventories (Pre) | Sales and Inventories (At 10:00 a.m ET)
| DATE/WEEK |
HIGHLIGHTS |
FOR |
ACTUAL |
|
Wholesale inventories |
No 12 |
... |
|
Oct-2025 |
|
| |
|
|
|
Wholesale inventories |
No 11 |
... |
|
Sep-2025 |
|
| |
|
|
|
Wholesale inventories |
No 10 |
... |
|
Aug-2025 |
|
| |
|
|
|
Wholesale inventories |
No 9 |
... |
|
Jul-2025 |
|
| |
|
|
|
Wholesale inventories |
No 8 |
... |
|
Jun-2025 |
|
| |
|
|
|
Wholesale inventories |
No 7 |
... |
|
May-2025 |
|
| |
|
|
|
Wholesale inventories |
No 6 |
... |
|
Apr-2025 |
|
| |
|
|
|
Wholesale inventories |
No 5 |
... |
|
Mar-2025 |
|
| |
|
|
|
Wholesale inventories |
No 4 |
... |
|
Feb-2025 |
|
| |
|
|
|
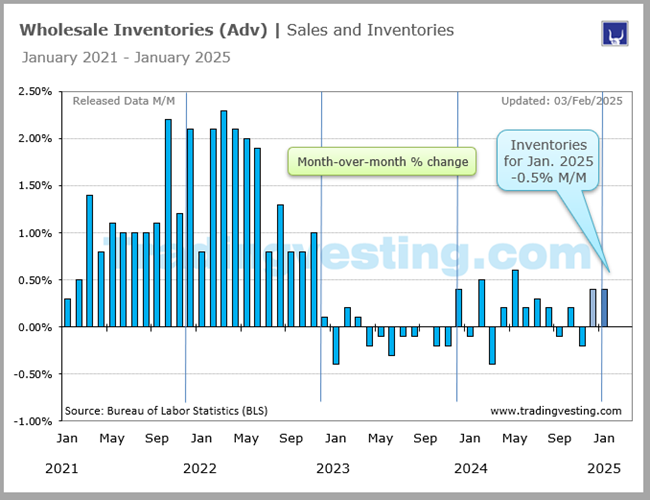
U.S. wholesale inventories dropped sharply January, a trend that if sustained could result in inventory investment being a drag on economic growth in the first quarter. Stocks at wholesalers decreased 0.5% after falling 0.1% in December, the Commerce Department's Census Bureau said on Thursday. Inventories, a key part of gross domestic product, increased 1.0% on a year-over-year basis in January. |
No 3 |
-0.5% |
|
Jan-2025 |
|
| |
|
|
|
Wholesale inventories |
No 2 |
0.2% |
|
Dec-2024 |
|
| |
|
|
|
Wholesale inventories |
No 1 |
... |
|
Nov-2024 |
|
| |
|
|
|
|
|
|
|
|
| |
|
|
|
|
|
| |
|
|
|
|
|
|
|
|
|
|
|
|
|
|
|
Brief News | 2025 |
|
|
Wholesale Trade (Pre) | Sales and Inventories |
|
Today's Week |
|
|
|
|
|
|
|
|
|
|
|
|
|
Wholesale Inventories (Pre) | Sales and Inventories (At 10:00 a.m ET)
| DATE/WEEK |
HIGHLIGHTS |
FOR |
ACTUAL |
|
Wholesale inventories |
No 12 |
0.5% |
|
Oct-2025 |
|
| |
|
|
|
Wholesale Inventories Pre: Delayed due to the government shut down, |
No 11 |
... |
|
Oct-2025 |
|
| |
|
|
|
Wholesale inventories |
No 12 |
0.0% |
|
Aug-2025 |
|
| |
|
|
|
Wholesale Inventories Pre: Delayed due to the government shut down, |
No 11 |
... |
|
Sep-2025 |
|
| |
|
|
|
Wholesale Inventories Pre: Delayed due to the government shut down, |
No 10 |
... |
|
Aug-2025 |
|
| |
|
|
|
Wholesale inventories |
No 9 |
0.1% |
|
Jul-2025 |
|
| |
|
|
|
Wholesale inventories |
No 8 |
0.1% |
|
Jun-2025 |
|
| |
|
|
|
Inventories for May 2025 amounted to $905.5 billion, marking a 0.3% decrease from April and a 1.4% increase from the previous year. Revised US wholesale inventories data for May 2025, released on July 9, 2025, showed a 0.3% decrease compared to April, with durable goods inventories falling 0.8% and nondurable goods increasing 0.5%. This revised figure was slightly different from the advance estimate and reflected an overall slight decrease, though wholesale sales saw a 0.3% increase, according to a Reuters survey of economists. |
No 7 |
-0.3% |
|
May-2025 |
|
| |
|
|
|
U.S. wholesale inventories increased in April amid stockpiling of prescription medication in anticipation of tariffs from the Trump administration. Stocks at wholesalers rose 0.2% instead of being unchanged, as estimated last month, the Commerce Department's Census Bureau said on Monday. Economists polled by Reuters had expected last month's estimate would be unrevised. |
No 6 |
0.2% |
|
Apr-2025 |
|
| |
|
|
|
U.S. wholesale inventories increased slightly less than initially estimated in March amid decreases in the stocks of electrical, lumber, apparel and farm products. Stocks at wholesalers rose 0.4%, revised down from the 0.5% gain estimated last month, the Commerce Department's Census Bureau said on Thursday. Economists polled by Reuters had expected the rise in inventories would be unrevised. |
No 5 |
0.4% |
|
Mar-2025 |
|
| |
|
|
|
U.S. wholesale inventories rebounded solidly in February, suggesting that inventories could contribute to economic growth in the first quarter. The Commerce Department's Census Bureau said on Wednesday that wholesale inventories rose 0.5% as estimated last month. Stocks at wholesalers fell 0.2% in January. Economists polled by Reuters had expected that inventories would be unrevised. |
No 4 |
0.3% |
|
Feb-2025 |
|
| |
|
|
|
U.S. business inventories rebounded in January as declining sales boosted stocks at wholesalers, which could see inventories contributing to economic growth in the first quarter. Inventories increased 0.3% after declining 0.2% in December, the Commerce Department's Census Bureau said on Monday. The rise in inventories, a key component of gross domestic product, was in line with economists' expectations. |
No 3 |
0.8% |
|
Jan-2025 |
|
| |
|
|
|
US wholesale inventories drop by unrevised 0.5% in December. U.S. wholesale inventories fell in December amid strong sales growth, government data showed on Friday. Stocks at wholesalers decreased by an unrevised 0.5%, the Commerce Department's Census Bureau confirmed, matching the consensus forecast of economists polled by Reuters. Inventories, a key part of gross domestic product, fell 0.1% on a year-on-year basis in December. Private inventory investment was a big drag on GDP in the fourth quarter, restricting economic growth to a 2.3% annualized rate. The economy grew at a 3.1% pace in the July-September quarter.
|
No 2 |
-0.5% |
|
Dec-2024 |
|
| |
|
|
|
Wholesale inventories remain steady, meeting forecasts. The latest data on wholesale inventories has been released, revealing that the total value of goods held in inventory by wholesalers has remained steady, with no change from the previous figure. The actual figure for the wholesale inventories came in at -0.2%, which aligns perfectly with the forecasted number. This consistency in the data indicates that the market predictions were accurate and that the wholesale sector is maintaining a steady pace, without any unexpected fluctuations. This demonstrates that there has been no change in the total value of goods held in inventory by wholesalers, indicating a stable market. The stability of the wholesale inventories is a positive sign for the USD. As per the economic principle, a higher than expected reading is considered negative or bearish for the USD, while a lower than expected reading is taken as positive or bullish. In this case, the reading was as expected, signaling neither a bearish nor bullish trend, but rather a steady, consistent performance in the wholesale inventories sector. |
No 1 |
-0.2% |
|
Nov-2024 |
|
| |
|
|
|
|
|
|
|
|
| |
|
|
|
|
|
| |
|
|
|
|
|
|
|
|
|
|
|
|
|
|
|
Brief News | 2024 |
|
|
Wholesale Trade (Pre) | Sales and Inventories |
|
Today's Week |
|
|
|
|
|
|
|
|
|
|
|
|
|
Wholesale Inventories (Pre) | Sales and Inventories (At 10:00 a.m ET)
| DATE/WEEK |
HIGHLIGHTS |
FOR |
ACTUAL |
|
Wholesale inventories rebound, meet forecast with 0.2% increase. The latest data on Wholesale Inventories has been released, showing a turnaround in the total value of goods held in inventory by wholesalers. The actual figure came in at 0.2%, meeting the forecasted number and indicating a positive shift from the previous month. This 0.2% increase aligns perfectly with the forecasted number, displaying a recovery from the previous month's dip. In the previous period, inventories had contracted by 0.2%, a negative turn that raised concerns among economists and market watchers.Nevertheless, the return to growth in Wholesale Inventories is a positive sign for the broader economy, potentially indicating increased business confidence and a stronger demand outlook. |
No 12 |
0.2% |
|
Oct-2024 |
|
| |
|
|
|
U.S. wholesale inventories fell more than initially thought in September amid a sharp decline in motor vehicle stocks. The Commerce Department's Census Bureau said on Thursday that wholesale inventories dropped 0.2% instead of the previously reported 0.1% dip. Stocks at wholesalers rose 0.2% in August. Economists polled by Reuters had expected that the drop in inventories, a key part of gross domestic product, would be unrevised at 0.1%. Inventories advanced 0.3% on a year-on-year basis in September. Wholesale motor vehicle inventories declined 1.7% after rising 0.3% in August..Wholesale inventory consists of finished good products received from manufacturers or distributors that have not yet been sold to customers. For September 2024 was M/M -0.2% and Prior was 0.1%. |
No 11 |
-0.2% |
|
Sep-2024 |
|
| |
|
|
|
Wholesale inventories revised to 0.1% in Q3. August wholesale trade sales -0.1% month/month vs. +0.4% est. & +1.1% prior. U.S. wholesale inventories rose less than initially thought in August amid a sharp moderation in the pace of increase in motor vehicle stocks, a trend that if sustained could temper expectations for robust economic growth in the third quarter. The Commerce Department's Census Bureau said on Wednesday that wholesale inventories edged up 0.1%, revised down from the 0.2% gain estimated last month. Stocks at wholesalers rose 0.2% in July. Economists polled by Reuters had expected that the rise in inventories, a key part of gross domestic product, would be unrevised at 0.2%. Inventories climbed 0.6% on a year-on-year basis in August. |
No 10 |
0.1% |
|
Aug-2024 |
|
| |
|
|
|
US wholesale July inventories revised slightly lower. U.S. wholesale inventories increased less than initially thought in July amid a sharp rebound in sales, casting doubt on whether inventory investment would contribute to economic growth in the third quarter. The Commerce Department's Census Bureau said on Monday that wholesale inventories rose 0.2%, revised down from the 0.3% gain estimated last month. Stocks at wholesalers were unchanged in June. Economists polled by Reuters had expected that the rise in inventories, a key part of gross domestic product, would be unrevised at 0.3%. Inventories advanced 0.4% on a year-on-year basis in July. Private inventory investment contributed to the economy's 3.0% annualized growth rate in the second quarter. There is hope that inventories could offset some the drag on GDP from a widening trade deficit |
No 9 |
0.2% |
|
Jul-2024 |
|
| |
|
|
|
US wholesale inventories rise in June. The Commerce Department's Census Bureau said on Thursday that wholesale inventories rose 0.2% in June as previously estimated. U.S. wholesale inventories increased in June, adding to economic growth in the second quarter. The Commerce Department's Census Bureau said on Thursday that wholesale inventories rose 0.2% in June as previously estimated. Stocks at wholesalers advanced by 0.5% in May. Economists polled by Reuters had expected that inventories, a key part of gross domestic product, would rise by an unrevised 0.2%. Inventories edged up 0.1% on a year-on-year basis in June. |
No 8 |
0.2% |
|
Jun-2024 |
|
| |
|
|
|
U.S. wholesale inventories increased solidly in May, likely putting inventory investment on track to support economic growth in the second quarter. The Commerce Department's Census Bureau said on Wednesday that wholesale inventories rose 0.6% as previously estimated last month. Stocks at wholesalers rose 0.2% in April. Economists polled by Reuters had expected that inventories, a key part of gross domestic product, would be unrevised. Inventories fell 0.5% on a year-on-year basis in May. Private inventory investment has been a drag on GDP for two straight quarters as businesses carefully managed stocks and domestic demand remained strong. |
No 7 |
0.6% |
|
May-2024 |
|
| |
|
|
|
Wholesale Inventories up 0.1% in April 2024. Total inventories were down 1.7 percent (±0.7 percent) from the revised April 2023 level. April 2024 sales of merchant wholesalers, except manufacturers’ sales branches and offices, after adjustment for seasonal variations and trading day differences but not for price changes, were $663.8 billion, up 0.1 percent (±0.4 percent)* from the revised March level and were up 1.4 percent (±0.9 percent) from the revised April 2023 level. The February 2024 to March 2024 percent change was unrevised from the preliminary estimate of down 1.3 percent (±0.4 percent). The April inventories/sales ratio for merchant wholesalers, except manufacturers’ sales branches and offices, based on seasonally adjusted data, was 1.35. The April 2023 ratio was 1.39. |
No 6 |
0.1% |
|
Apr-2024 |
|
| |
|
|
|
US wholesale inventories drop by unrevised 0.4% in March. U.S. wholesale inventories fell in March, confirming that inventory investment was a drag on economic growth in the first quarter. The Commerce Department's Census Bureau said on Wednesday that wholesale inventories fell 0.4% as estimated last month. Stocks at wholesalers rebounded 0.2% in February. Economists polled by Reuters had expected that inventories, a key part of gross domestic product, would be unrevised. Inventories dropped 2.3% on a year-on-year basis in March. inventories Private inventory investment cut 0.35% percentage point from GDP growth in the first quarter, the government reported last month. It was the second straight quarter that inventories subtracted from GDP. The economy grew at a 1.6% annualized rate in the January-March quarter, the slowest pace in nearly two years. |
No 5 |
-0.4% |
|
Mar-2024 |
|
| |
|
|
|
US wholesale inventories increase strongly in February. U.S. wholesale inventories rebounded solidly in February, suggesting that inventories could contribute to economic growth in the first quarter. The Commerce Department's Census Bureau said on Wednesday that wholesale inventories rose 0.5% as estimated last month. Stocks at wholesalers fell 0.2% in January. Economists polled by Reuters had expected that inventories would be unrevised. Inventories are a key part of gross domestic product. They dropped 1.5% on a year-on-year basis in February. |
No 4 |
|
|
Feb-2024 |
|
| |
|
|
|
US wholesale inventories revised down in January. U.S. wholesale inventories fell more than initially thought in January, which could negatively impact economic growth estimates for the first quarter. The Commerce Department's Census Bureau said on Wednesday that wholesale inventories dropped 0.3% instead of dipping 0.1% as estimated last month. Stocks at wholesalers increased 0.4% in December. Economists polled by Reuters had expected that inventories would be unrevised. Inventories are a key part of gross domestic product. They fell 2.5% on a year-on-year basis in January. Private inventory investment subtracted 0.3% percentage point from GDP growth last quarter after providing a large boost in the third quarter. The economy grew at a 3.2% annualized rate in the fourth quarter. |
No 3 |
-0.3% |
|
Jan-2024 |
|
| |
|
|
|
Wholesale inventories in U.S. rise 0.4% in December. Businesses benefit from stronger-than-expected sales. Wholesale inventories in the U.S. rose 0.4% in December, the government reported Thursday. and added to strong gross domestic product in the fourth quarter. Inventories are goods produced for sale that have not been sold yet. Businesses tend to increase inventories when sales a rising. Sales in the month jumped 0.7%. |
No 2 |
0.4% |
|
Dec-2023 |
|
| |
|
|
|
US wholesale inventories unrevised in November. U.S. wholesale inventories fell for a second straight month in November, suggesting that a slow pace of inventory accumulation could undercut economic growth in the fourth quarter. The Commerce Department's Census Bureau said on Wednesday that wholesale inventories slipped 0.2% as estimated last month. Stocks at wholesalers dropped 0.3% in October. Economists polled by Reuters had expected that inventories would be unrevised. Inventories are a key part of gross domestic product. They declined 3.0% on a year-on-year basis in November. |
No 1 |
-0.2% |
|
Nov-2023 |
|
| |
|
|
|
|
|
|
|
|
| |
|
|
|
|
|
| |
|
|
|
|
|
|
|
|
|
|
|
|
|
|
|
Brief News | 2023 |
|
|
Wholesale Trade (Pre) | Sales and Inventories |
|
Today's Week |
|
|
|
|
|
|
|
|
|
|
|
|
|
Wholesale Inventories (Pre) | Sales and Inventories (At 10:00 a.m ET)
| DATE/WEEK |
HIGHLIGHTS |
FOR |
ACTUAL |
|
U.S. wholesale inventories fell more than initially estimated in October, suggesting that inventory investment could be a drag on economic growth this quarter. The Commerce Department's Census Bureau said on Thursday that wholesale inventories dropped 0.4%, instead of 0.2% as previously reported last month. Stocks at wholesalers were unchanged in September. Economists polled by Reuters had expected that inventories would be unrevised. Inventories are a key part of gross domestic product. They decreased 2.3% on a year-on-year basis in October. |
No 12 |
-0.4% |
|
Oct-2023 |
|
| |
|
|
|
The U.S. Census Bureau shared its latest wholesale trade statistics for September 2023 on Nov. 8, showing an unexpected rise in inventories both month-to-month and year-over-year. Inventories at merchant wholesalers were up 0.2% at the end of September compared to a month earlier and up 1.2% year-over-year. It was the first monthly gain since February and topped economists’ estimate that inventories would go unchanged — matching the Bureau’s advance estimate issued on Oct. 26. |
No 11 |
0.2% |
|
Sep-2023 |
|
| |
|
|
|
U.S. wholesale inventories fell for a sixth straight month in August, but the pace of decline slowed amid a surge in sales. The Commerce Department said on Tuesday that wholesale inventories slipped 0.1% as previously reported last month. Stocks at wholesalers fell 0.3% in July. Economists polled by Reuters had expected that inventories would be unrevised. Inventories are a key part of gross domestic product. They dropped 1.0% on a year-on-year basis in August. |
No 10 |
-0.1% |
|
Aug-2023 |
|
| |
|
|
|
U.S. wholesale inventories slip in July while sales jump. Biggest rise in sales in more than a year pushes down inventories-to-sales ratio to lowest level since February. Wholesale inventories in the U.S. fell 0.2% in July, the Commerce Department said Friday. It is the second straight monthly decline. Economists polled by the Wall Street Journal expected a 0.1% fall. |
No 9 |
-0.2% |
|
Jul-2023 |
|
| |
|
|
|
Total wholesale inventories—the stock of goods available for sale by wholesalers and a factor that may influence the country's Gross Domestic Product (GDP)—fell 0.5% to $905.2 billion in June compared to May but were 1.3% higher over the June last year, the Census Bureau reported Tuesday. Wholesale inventories or value of goods available for sale by wholesalers fell 0.5% in June compared to the prior month but were up 1.3% from June last year. June wholesale sales fell 0.7% compared to the prior month but were down 6.7% versus a year ago. With some caveats, the Fed looks to wholesale inventories as an indicator of consumer spending. |
No 8 |
-0.5% |
|
Jun-2023 |
|
| |
|
|
|
U.S. wholesale inventories were unchanged in May after declining for two straight months, suggesting inventory investment could support economic growth in the second quarter. The Commerce Department said on Monday that wholesale inventories were unchanged instead of dipping 0.1% as previously reported last month. Stocks at wholesalers fell 0.3% in April Economists polled by Reuters had expected that inventories would be unrevised. Inventories are a key part of gross domestic product. They increased 3.7% on a year-on-year basis in May. Private inventory investment rose at its slowest pace in 1-1/2 years in the first quarter, helping to restrict GDP growth to a 2.0% annualized pace in that three-month period. |
No 7 |
0.0% |
|
May-2023 |
|
| |
|
|
|
U.S. wholesale inventories fell a bit less in April than initially estimated, which could provide a lift to economic growth in the second quarter. The Commerce Department said on Thursday that wholesale inventories slipped 0.1% instead of falling 0.2% as previously reported last month. Stocks at wholesalers dropped 0.2% in March. Economists polled by Reuters had expected that inventories would be unrevised. Inventories are a key part of gross domestic product. They increased 6.3% on a year-on-year basis in April. Private inventory investment rose at its slowest pace in 1-1/2 years in the first quarter, helping to restrict GDP growth to a 1.3% annualized pace in that three-month period. |
No 6 |
-0.1% |
|
Apr-2023 |
|
| |
|
|
|
U.S. wholesale inventories were unchanged for the second straight month in March, while softening demand meant that it would now take wholesalers the longest time in nearly three years to clear the current stock of goods. The Commerce Department last month estimated wholesale inventories gained 0.1% in March. Economists polled by Reuters had expected that inventories would be unrevised. Inventories are a key part of gross domestic product. They increased 9.1% in March on a year-on-year basis. Excluding autos, wholesale inventories fell 0.2% in March. This component goes into the calculation of GDP. At March’s sales pace it would take wholesalers 1.40 months to clear shelves, the highest since June 2020, from 1.37 months in February. |
No 5 |
0.1% |
|
Mar-2023 |
|
| |
|
|
|
U.S. business inventories rose moderately in February, suggesting that inventory investment could subtract from economic growth in the first quarter. Business inventories increased 0.2% after falling 0.2% in January, the Commerce Department said on Friday. Economists polled by Reuters had expected inventories, a key component of gross domestic product, to rise 0.3%. Inventories increased 9.1% on a year-on-year basis in February. Inventory accumulation surged in the fourth quarter, mostly reflecting an unwanted piling up of goods, as growth in consumer spending decelerated because of higher interest rates. Retail inventories increased 0.7% instead of 0.8% as estimated in an advance report published last month. They were unchanged in January. |
No 4 |
|
|
Feb-2023 |
|
| |
|
|
|
U.S. wholesale inventories fell as initially estimated in January, according to government data on Tuesday, which also showed sales at wholesalers rebounding. The Commerce Department said wholesale inventories dropped 0.4% as previously reported last month. Stocks at wholesalers gained 0.1% in December. Economists polled by Reuters had expected that inventories would be unrevised. Inventories are a key part gross domestic product. They increased 15.8% in January on a year-on-year basis. Inventory accumulation surged in the fourth quarter, mostly reflecting an unwanted piling up of goods, as growth in consumer spending decelerated because of higher interest rates. |
No 3 |
-0.4% |
|
Jan-2023 |
|
| |
|
|
|
U.S. wholesale inventories recorded their smallest increase in nearly 2-1/2 years in December, suggesting that businesses were holding back on placing new orders for goods amid a stagnation in sales as higher interest rates curb demand. The Commerce Department said on Wednesday that wholesale inventories edged up 0.1% as previously reported last month. That was the smallest gain since July 2020. Stocks at wholesalers increased 0.9% in November. Economists polled by Reuters had expected that inventories would be unrevised. |
No 2 |
0.1% |
|
Dec-2022 |
|
| |
|
|
|
Wholesale inventories increase strongly in November. The inventories of U.S. wholesalers increased sharply in November over October, as inventories-to-sales ratios climbed to the highest levels in more than two years. Data from the U.S. Department of Commerce indicates wholesale inventories rose 1% for the month. Economists polled by Reuters had expected inventories to show no change. Inventories were up for nearly all durable goods, including furniture, lumber, machinery and hardware. Furniture inventories rose 1.4% for the month; lumber had a 1% increase. |
No 1 |
1.0% |
|
Nov-2022 |
|
| |
|
|
|
|
|
|
|
|
| |
|
|
|
|
|
| |
|
|
|
|
|
|
|
|
|
|
|
|
|
|
|
Brief News | 2022 |
|
|
Wholesale Trade (Pre) | Sales and Inventories |
|
Today's Week |
|
|
|
|
|
|
|
|
|
|
|
|
|
Wholesale Inventories (Pre) | Sales and Inventories (At 10:00 a.m ET)
| DATE/WEEK |
HIGHLIGHTS |
FOR |
ACTUAL |
|
U.S. wholesale inventories increased less than initially thought in October, suggesting that businesses were carefully managing their inventory amid slowing demand. The Commerce Department said on Friday that wholesale inventories rose 0.5% instead of 0.8% as reported last month. Stocks at wholesalers increased 0.6% in September. Economists polled by Reuters had expected that inventories would be unrevised. Wholesale inventories increased 21.9% in October on a year-on-year basis. Inventories are a key part of gross domestic product. There were decreases in furniture, computer and professional equipment stocks. Wholesale motor vehicle inventories were unchanged after rising 1.4% in September. |
No 12 |
0.5% |
|
Oct-2022 |
|
| |
|
|
|
U.S. wholesale inventories revised lower in September. U.S. wholesale inventories increased less than initially thought in September amid decreases in stocks of petroleum and computer equipment, also suggesting that businesses were carefully managing their inventory amid slowing demand. The Commerce Department said on Wednesday that wholesale inventories rose 0.6% instead of 0.8% as reported last month. Stocks at wholesalers advanced 1.4% in August. Economists polled by Reuters had expected that inventories would be unrevised |
No 11 |
0.6% |
|
Sep-2022 |
|
| |
|
|
|
U.S. wholesale inventories fell for a sixth straight month in August, but the pace of decline slowed amid a surge in sales. The Commerce Department said on Tuesday that wholesale inventories slipped 0.1% as previously reported last month. Stocks at wholesalers fell 0.3% in July. Economists polled by Reuters had expected that inventories would be unrevised. Inventories are a key part of gross domestic product. They dropped 1.0% on a year-on-year basis in August. Economists expect business inventories will provide a boost to gross domestic product in the third quarter. Private inventory investment was neutral to GDP in the second quarter after being a major drag in the first three months of the year. |
No 10 |
1.3% |
|
Aug-2022 |
|
| |
|
|
|
U.S. wholesale inventories increased less than initially thought in July as businesses slowed the replenishment of their stocks. The Commerce Department said on Friday that wholesale inventories rose 0.6%, instead of 0.8% as reported last month. Stocks at wholesalers advanced 1.8% in June. Economists polled by Reuters had expected July inventories would be unrevised. Wholesale inventories increased 25.1% in July on a year-on-year basis. Inventories are a key component of gross domestic product. Wholesale motor vehicle inventories rose 1.7% after rising 3.0% in June. Wholesale inventories, excluding autos, increased 0.5% in July. This component goes into the calculation of GDP |
No 9 |
0.6% |
|
Jul-2022 |
|
| |
|
|
|
U.S. wholesale inventories increased less than initially thought in June as businesses slowed the replenishment of their stocks as they continue to draw down on excess inventories amid softening consumer spending. The Commerce Department said on Wednesday that wholesale inventories rose 1.8%, instead of 1.9% as reported last month. Stocks at wholesalers advanced 1.9% in May. Economists polled by Reuters had expected June inventories would be unrevised. Wholesale inventories increased 25.5% in June on a year-on-year basis. Inventories are a key component of gross domestic product. Wholesale motor vehicle inventories rose 2.6% after rising 2.5% in May. Wholesale inventories, excluding autos, increased 1.7% in June. This component goes into the calculation of GDP. |
No 8 |
1.8% |
|
Jun-2022 |
|
| |
|
|
|
U.S. wholesale inventories increased less than initially thought in May, suggesting that inventory investment could subtract from gross domestic product in the second quarter. The Commerce Department said on Friday that wholesale inventories rose 1.8%, instead of 2.0% as reported last month. Stocks at wholesalers advanced 2.3% in April. Economists polled by Reuters had expected May inventories would be unrevised. Wholesale inventories increased 24.7% in May on a year-on-year basis. Inventories are a key part of gross domestic product. |
No 7 |
1.8% |
|
May-2022 |
|
| |
|
|
|
U.S. wholesale inventories increased slightly more than initially thought in April, suggesting that inventory investment could provide a lift to economic growth this quarter. The rise in stocks reported by the Commerce Department on Wednesday, however, came as sales growth moderated. Inventories are being closely watched amid rising fears of a recession next year as the Federal Reserve raises interest rates to cool demand in its battle against high inflation. Major U.S. retailers, including Walmart, and Target said last month that they were carrying too much merchandise. Wholesale inventories advanced 2.2%, instead of 2.1% as reported last month. Data for March was revised higher to show stocks at wholesalers rising 2.7% instead of the previously reported 2.3%. |
No 6 |
2.2% |
|
Apr-2022 |
|
| |
|
|
|
U.S. wholesale inventories increased solidly in March and the pace of accumulation in the prior month was stronger than previously reported, which could lead to a small upward revision to the first-quarter gross domestic product estimate. The Commerce Department said on Monday that wholesale inventories rose 2.3% in March as reported last month. Data for February was revised higher to show stocks at wholesalers climbing 2.8% instead of the previously reported 2.6%. Economists polled by Reuters had expected March inventories would be unrevised. Wholesale inventories advanced 22.0% in March on a year-on-year basis. Inventories are a key part of gross domestic product. Wholesale motor vehicle inventories accelerated 2.4% after rebounding 1.9% in February. Wholesale inventories, excluding autos, rose 2.3% in March. |
No 5 |
2.3% |
|
Mar-2022 |
|
| |
|
|
|
U.S. wholesale inventories increased more than initially thought in February, but inventory investment probably offered little or no boost to economic growth in the first quarter. The Commerce Department said on Friday wholesale inventories rose 2.5% in February, instead of 2.1% as reported last month. Stocks at wholesalers advanced 1.2% in January. Economists polled by Reuters had expected inventories would be unrevised. Wholesale inventories surged 19.9% in February on a year-on-year basis. Inventories are a key part of gross domestic product. Wholesale motor vehicle inventories rebounded 1.4% after declining 2.3% in January. |
No 4 |
2.5% |
|
Feb-2022 |
|
| |
|
|
|
Wholesale inventories rose by an unrevised 0.8% in January 2022 after increasing 2.6% in December. Wholesale inventories advanced 18.1% in January on a year-on-year basis. Inventories are a key part of gross domestic product. Wholesale motor vehicle inventories fell 2.2% after vaulting 5.5% in December. Wholesale inventories, excluding autos, increased 1.1% in January. This component goes into the calculation of GDP. The increase in wholesale inventories in January was the smallest in six months amid a decline in motor vehicle stocks. The reports support views of significantly slower gross domestic product growth this quarter after a robust performance in the final three months of 2021. |
No 3 |
0.8% |
|
Jan-2022 |
|
| |
|
|
|
Wholesale trade experienced more than $7.1 trillion in sales in 2021, a greater than 22% increase over 2020 when the industry recorded just over $5.8 trillion in revenues, the U.S. Census Bureau reported Thursday. It was a record year for the industry, also besting the last pre-pandemic year of 2019, which saw roughly $6.1 trillion in wholesale revenues. December 2021 sales of merchant wholesalers — except manufacturers’ sales branches and offices, after seasonal adjustments — were $634.6 billion, up 0.2% from the revised November level and up 21.8% from the revised December 2020 level. Total inventories of merchant wholesalers, after seasonal adjustments and variations, were $790.8 billion at the end of December 2021, up 2.2% from the revised November level. Total inventories were up 18.5% from the revised December 2020 level. |
No 2 |
2.2% |
|
Dec-2021 |
|
| |
|
|
|
The second estimate of November 2021 wholesale inventories is a build of 1.2 percent, unchanged from the first estimate. Wholesale trade measures the dollar value of sales made and inventories held by merchant wholesalers. It is a component of business sales and inventories..Indications that the worst of the global supply-chain problems are behind us have mounted in recent weeks. Wholesale inventories rose 1.4% in November, instead of 1.2% as estimated last month. Stocks at wholesalers increased 2.5% in October. Inventories are a key part of gross domestic product. |
No 1 |
1.4% |
|
Nov-2021 |
|
| |
|
|
|
|
|
|
|
|
| |
|
|
|
|
|
| |
|
|
|
|
|
|
|
|
|
|
|
|
|
|
|
Brief News | 2021 |
|
|
Wholesale Trade (Pre) | Sales and Inventories |
|
Today's Week |
|
|
|
|
|
|
|
|
|
|
|
|
|
Wholesale Inventories (Pre) | Sales and Inventories (At 10:00 a.m ET)
| DATE/WEEK |
HIGHLIGHTS |
FOR |
ACTUAL |
|
U.S. wholesale inventories increased a bit more than initially thought in October 2021, suggesting that the restocking of warehouses could again support economic growth this quarter. The Commerce Department said on Thursday that wholesale inventories accelerated 2.3%, instead of 2.2% as estimated last month. Stocks at wholesalers increased 1.4% in September. Economists polled by Reuters had expected inventories would be unrevised. Wholesale inventories jumped 14.4% in October from a year earlier. Inventories are a key part of gross domestic product. Wholesale inventories, excluding autos, advanced 2.3% in October. |
No 12 |
2.3% |
|
Oct-2021 |
|
| |
|
|
|
U.S. Wholesale Inventories Revised Higher in September 2021. U.S. wholesale inventories increased more than initially thought in September, but automobile stocks declined further amid a global semiconductor shortage, which is undercutting motor vehicle production. The Commerce Department said on Wednesday that wholesale inventories increased 1.4%, instead of 1.1% as estimated last month. Stocks at wholesalers rose 1.3% in August. Wholesale inventories jumped 13.1% in September from a year earlier. |
No 11 |
1.4% |
|
Sep-2021 |
|
| |
|
|
|
Wholesale Trade Sales Down 1.1% in August 2021. Wholesale trade slowed in August, but it was still ahead of revised 2020 levels for the same period, according to the U.S. Census Bureau. Wholesale trade sales dropped 1.1% in August compared to July 2021, but sales were up 20.6% from revised 2020 levels for the same period, according to the latest report from the U.S. Census Bureau.Total inventories of merchant wholesalers, except manufacturers’ sales branches and offices, after adjustment for seasonal variations and trading day differences, but not for price changes, were $731.1 billion at the end of August, up 1.2% from the revised July level. |
No 10 |
1.2% |
|
Aug-2021 |
|
| |
|
|
|
Wholesale trade improved in July 2021 compared to the same month a year ago and was up from the previous month of June, according to the latest report from the U.S. Census Bureau. July 2021 sales of merchant wholesalers, except manufacturers’ sales branches and offices, after adjustment for seasonal variations and trading day differences but not for price changes, were $601.3 billion, up 23.7% from the revised July 2020 level and up 2% from the revised June level. The May 2021 to June 2021 percent change was revised from the preliminary estimate of up 2% to up 2.3%. |
No 9 |
2.3% |
|
Jul-2021 |
|
| |
|
|
|
Wholesale trade improved in June 2021 compared to the same month a year ago and was up from the previous month of May, according to the latest report from the U.S. Census Bureau. June 2021 sales of merchant wholesalers, except manufacturers’ sales branches and offices, after adjustment for seasonal variations and trading day differences but not for price changes, were $588.1 billion, up 27.5% from the revised June 2020 level and up 2% from the revised May level. The April 2021 to May 2021 percent change was unrevised from the preliminary estimate of 0.8%. Total inventories of merchant wholesalers, except manufacturers’ sales branches and offices, after adjustment for seasonal variations and trading day differences, but not for price changes, were $717.6 billion at the end of June, up 1.1% from the revised May level. |
No 8 |
1.1% |
|
jun-2021 |
|
| |
|
|
|
Wholesale trade improved in May 2021 compared to the same month a year ago and was up slightly from the previous month of April, according to a Friday report by the U.S. Census Bureau. May sales of merchant wholesalers, except manufacturers’ sales branches and offices, after adjustment for seasonal variations and trading day differences but not for price changes, were $576.5 billion, up 0.8% from the revised April level and were up 36.8% from the revised May 2020 level. The March 2021 to April 2021 percent change was revised from the preliminary estimate of up 0.8% to up 1.1%. The April 2021 to May 2021 percent change was revised from the advance estimate of up 1.1% to up 1.3%. |
No 7 |
1.3% |
|
May-2021 |
|
| |
|
|
|
Wholesale trade improved in April 2021 compared to the same month a year ago and was up from the previous month of March, according to the latest report from the U.S. Census Bureau. April 2021 sales of merchant wholesalers, except manufacturers’ sales branches and offices, after adjustment for seasonal variations and trading day differences but not for price changes, were $570.8 billion, up 0.8% from the revised March level and were up 43.6% from the revised April 2020 level. The February 2021 to March 2021 percent change was revised from the preliminary estimate of up 4.6% to up 4.3%. |
No 6 |
0.8% |
|
Apr-2021 |
|
| |
|
|
|
U.S. wholesale inventories rose sightly less than initially estimated in March 2021as sales surged amid robust demand. The Commerce Department said on Friday that wholesale inventories increased 1.3%, instead of 1.4% as estimated last month. Stocks at wholesalers gained 1.0% in February. The component of wholesale inventories that goes into the calculation of gross domestic product increased 1.3% in March. Wholesale inventories shot up 4.5% in March from a year earlier. Sales at wholesalers jumped 4.6% after being unchanged in February. Overall, business inventories were depleted in the first quarter amid a burst in domestic demand. The inventory drawdown subtracted 2.64 percentage points from GDP growth last quarter. Still, the economy grew at a robust 6.4% annualized rate in the March-January period after expanding at a 4.3% pace in the fourth quarter. At March's sales pace it would take wholesalers 1.22 months to clear shelves, down from 1.26 months in February. |
No 5 |
1.3% |
|
Mar-2021 |
|
| |
|
|
|
U.S. wholesale inventories increased slightly more than initially estimated in February 2021 amid a decline in sales. The Commerce Department said on Friday that wholesale inventories rose 0.6%, instead of 0.5% as estimated last month. Stocks at wholesalers surged 1.4% in January. The component of wholesale inventories that goes into the calculation of gross domestic product increased a solid 0.8% in February. |
No 4 |
|
|
Feb-2021 |
|
| |
|
|
|
U.S. wholesale stocks rise; inventories-to-sales ratio lowest in six years. U.S. wholesale inventories increased solidly in January 2021 even as sales surged and it is taking wholesalers the shortest time in six years to clear shelves, a sign of strengthening demand that aligns with expectations for faster economic growth this year. The Commerce Department said on Monday that wholesale inventories rose 1.3% as estimated last month. |
No 3 |
1.3% |
|
Jan-2021 |
|
| |
|
|
|
Wholesale trade improved in December 2020 compared to the same month a year ago and with November, according to the latest report from the U.S. Census Bureau. December 2020 sales of merchant wholesalers, except manufacturers’ sales branches and offices, after adjustment for seasonal variations and trading day differences but not for price changes, were $503.8 billion, up 1.7% from the revised December 2019 level and up 1.2% from the revised November 2020 level. The October 2020 to November 2020 percent change was revised from the preliminary estimate of up 0.2% to up 0.3%. |
No 2 |
0.3% |
|
Dec-2020 |
|
| |
|
|
|
Wholesale trade dipped slightly in November 2020 compared to the same month a year ago but improved compared with October 2020, according to the latest report from the U.S. Census Bureau. November 2020 sales of merchant wholesalers, except manufacturers’ sales branches and offices, after adjustment for seasonal variations and trading day differences but not for price changes, were $496.7 billion, down 0.2% from the revised November 2019 level but up 0.2% from the revised October level. The September 2020 to October 2020 percent change was revised from the preliminary estimate of up 1.8% to up 1.7%. |
No 1 |
0.0% |
|
Nov-2020 |
|
| |
|
|
|
|
|
|
|
|
| |
|
|
|
|
|
| |
|
Legends: |
|
Delayed |
|
Positive View |
|
Negative View |
|
Neutral View |
|
Non Available |
|
|
|
|
|
|
|
|
|
|
|
|
|
|
|
|
|
|
|
|
| |
|
|
|
|
|
|
|
|
|
|
|
|
|
|
|
|
|
|
|
|
|
Definitions | Explain |
|
|
Wholesale Trade (Pre) | Sales and Inventories |
|
Today's Week |
|
|
|
|
|
|
|
|
|
|
|
|
| |
|
|
|
|
| |
|
| WHOLESALE TRADE |
The consistency in the wholesale inventories figures over time is a positive sign for the USD, as a lower than expected reading is taken as bullish for the currency. This could potentially lead to a strengthening of the USD in the global markets, boosting the country's trade competitiveness. However, it is essential to note that while this trend is positive, it also underlines the importance of maintaining a healthy balance in the economy. A continuous decrease in inventories could potentially lead to supply shortages, which could negatively impact the economy in the long run.
Why Do Inventories and Wholesale Sales Matter?
The return to positive growth is a welcome sign of stability in the wholesale sector, which plays a crucial role in the broader U.S. economy. This change suggests that wholesalers are now holding more inventory, a sign that they anticipate increased demand in the future. The shift from a contraction to an expansion suggests increased confidence among wholesalers and could indicate a more robust economic outlook. A higher than expected reading is typically seen as negative or bearish for the U.S. dollar, while a lower than expected reading is viewed as positive or bullish. Nevertheless, the return to growth in Wholesale Inventories is a positive sign for the broader economy, potentially indicating increased business confidence and a stronger demand outlook.
The sales figures do not move the market as they do not reflect personal consumption while wholesale inventories may change the aggregate inventory profile which can influence the GDP forecast. A high inventory suggests economic slowing in the US, that is seen as negative (or bearish) for the USD, whereas a low reading is seen as positive (or bullish).lower inventory numbers might signal high consumer demand, while high inventories might signal lower consumer demand.
Wholesale Inventories measures the change in the total value of goods held in inventory by wholesalers. A higher than expected reading should be taken as negative/bearish for the USD, while a lower than expected reading should be taken as positive/bullish for the USD. A high inventory level is generally not a good sign. It can signal that the company is struggling to sell its stuff for the prices that it wants. Usually what follows is a decline in profit margins (the company resorts to selling its stuff at a discounted price in order to reduce inventory). Wholesale-trade data gives investors a closer look at the consumer economy, as wholesalers' sales and inventory numbers can be a leading indicator of consumer trends.
By looking at the ratio of sales to inventories, investors can see whether or not production may grow or slow in the future. Having high inventory levels in your warehouses generally means your company is struggling to manage its inventory and make proper sales. For example, an excessive increase in inventories may signal that aggregate demand is slowing down and that firms will soon cut back production and output in face of such a fall in the demand for goods and services.
Wholesalers are the business operating as a link between manufacturers and retailers, and the Fed may view wholesale inventories as indicative of consumer behavior—lower inventory numbers might signal high consumer demand, while high inventories might signal lower consumer demand. Wholesale inventories are a part of the broader business inventories, which help measure economic activity and, by extension, the GDP by acting as signals for demand. While a change in inventories doesn't necessarily have a direct bearing on the GDP, the pace of change in inventories does. For example, the rate of change of
inventories over the prior quarter could impact GDP calculations as it did in the first quarter of 2022. That said, wholesale inventory and sales data are issued on a two-month lag and have a large error factor.
An Eye On Inventory/Sales Ratio
The inventory/sales ratio rose to 1.41 in June compared to 1.3 a year ago. This ratio—calculated by dividing the dollar value of inventory by the dollar value of sales—indicates how quickly wholesalers can sell existing inventory. U.S. Census Bureau. "Monthly Wholesale Trade Definitions." That means the higher the ratio, the longer it takes for the inventory to get sold, which could be a sign of slowing demand, usually indicative of slowing economic activity.
Wholesale Inventories
Inventories are a key component of gross domestic product (GDP) changes. A rise in inventories can add poins to quarters GDP.
Although, in general, wholesaling normally denotes sales in large volumes, durable nonconsumer goods may be sold in single units.
The Wholesale Trade Sector comprises establishments engaged in wholesaling merchandise, generally without transformation, and rendering services incidental to the sale of merchandise. The wholesale sector is the intermediary between the factory and retail sectors.
Wholesalers make up about 30% of all business stockpiles. Factory inventories comprise about 38% of the total. Retail stockpiles make up the rest.
Wholesalers stockpiles of durable goods, or those meant to last several years. Stockpiles of non-durable goods, which are often influenced by swings in prices.
Sales of capital or durable nonconsumer goods used in the production of goods and services, such as farm machinery, medium and heavy duty trucks, and industrial machinery, are always included in wholesale trade.
Businesses may be cutting inventories in line with slowing demand as wholesalers had enough goods on hand to last several months at the current sales pace.
Weak consumer spending and fiscal worries in the U.S. may be making businesses cautious about growing stockpiles.Businesses are not going to want to be accumulating inventories going into year-end.
Evidence of weakness on the industrial side is a rise in inventories of related goods while related sales mostly declined. An indication of strength on the consumer side is another big sales gain for autos combined with another big inventory build.
The wholesale inventories figure is more significant than the sales figure, because high or low inventory levels reflect how strong or weak retail demand is, which determines whether manufacturing production increases or declines. Wholesalers’ stock levels tell you whether GDP (gross domestic product) is going to expand, contract, or stay the same.
Advance Report
Wholesale inventories measure the monthly dollar value of inventories held by merchant wholesalers and are tracked to gauge inventory change in quarterly GDP.
The advance report is released late in the month for the following month and is part of the Monthly Advance Economic Indicators report (which also includes data on retail inventories and international trade in goods).
Final monthly data for wholesale inventories are released about two weeks later with the Wholesale Trade report which also includes initial monthly data on wholesale sales.
Preliminary
The second estimate of wholesale inventories. Wholesale trade measures the dollar value of sales made and inventories held by merchant wholesalers. It is a component of business sales and inventories.
Rating Inventories
Wholesalers are basically the middle step in the retail supply chain. They buy goods from manufacturers that they’re hoping to sell to retailers. They’re speculating on the future so wholesale inventory growth is absolutely an optimistic indicator. It is optimistic because wholesalers believe consumers are going to be spending more. Products are just flying off the shelves as soon as retailers can get their hands on them and that’s a sign the economy has plenty of room to grow. Sales could be even better if we could actually get our hands on the supplies and products that consumers and businesses want.
|
|
|
| |
|
|
|
|
|
|
|
|
|
|
|
|
|
|
|
|
|
|
|
|
|
Data | Source |
|
|
Wholesale Trade (Pre) | Sales and Inventories |
|
Today's Week |
|
|
|
|
|
|
|
|
|
|
|
|
| |
|
|
|
|
|
|
| DATA INFORMATION |
WHOLESALE TRADE PRE |
| SOURCE |
Bureau of the Census, U.S. Department of Commerce. |
| WEB |
www.census.gov |
| FREQUENCY |
Monthly |
| AVAILABILITY |
Mid-month |
| COVERAGE |
Data are for the previous month. Data for June are released in July. |
| REVISIONS |
Yes |
| IMPORTANCE |
Sales and Inventories - Very Important |
|
| |
|
|
|
|
|
|
|
|
|
|
|
|