 |
 |
|
 |
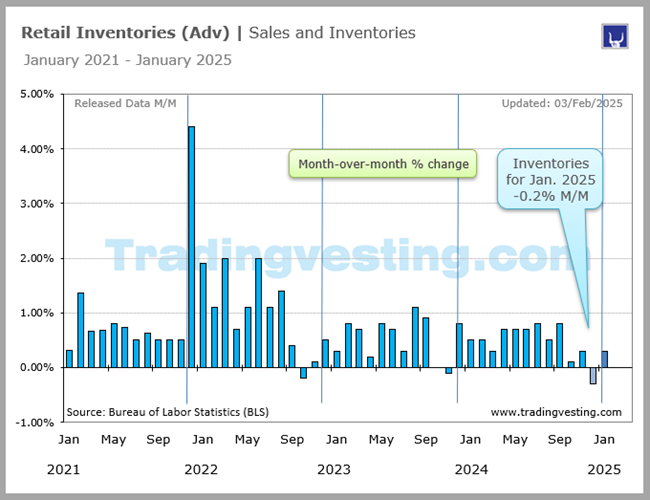
Retail Inventories (Adv) | Sales and Inventories |
|
 |
|
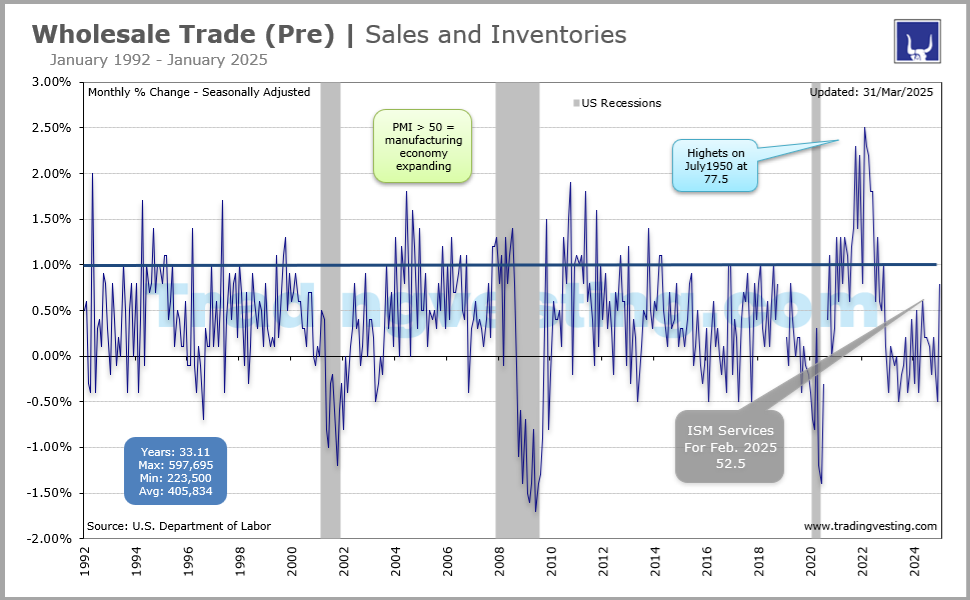
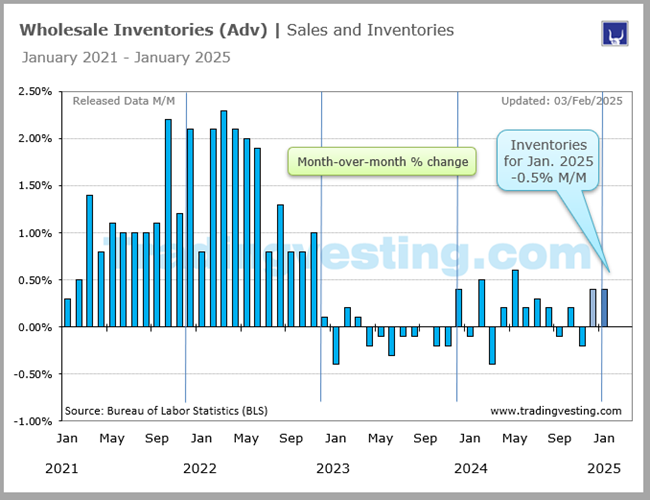
The Wholesale Trade or Wholesale Inventories report is the stock of goods available for sale by wholesalers and a factor that may influence the country's GDP. The second estimate of wholesale inventories.. Read More...
|
|
|
|
|
|
|
| |
|
| |
 5. Retail inventories (5 of 6)
 6. E-Commerce (6 of 6)
 1. Retail Sales (1 of 6)
 2. Business Inventories (2 of 6)
 3. Wholesale Trade Pre (3 of 6)
 4. Wholesale Trade Adv (4 of 6)
|
 |
|
|
|
|
| |
|
→ Big Chart |
|
→ Release |
|
| |
|
|
|
|
|
|
|
|
|
|
|
|
|
|
|
|
|
|
|
 |
|
Big Chart | Large Data |
 |
|
Retail Inventories (Adv) | Sales and Inventories |
|
Today's Week |
 |
|
|
|
|
|
|
|
|
|
|
|
|
|
| |
|
|
|
|
|
|
|
|
|
|
|
|
|
|
|
|
|
|
|
|
|
Slides | Five 5 |
|
|
Retail Inventories (Adv) | Sales and Inventories |
|
Today's Week |
|
|
|
|
|
|
|
|
|
|
|
|
|
|
| |
|
|
|
|
|
|
|
|
|
|
|
|
|
|
|
|
|
|
|
|
|
Release Schedule | 2026 |
|
|
Retail Inventories (Adv) | Sales and Inventories |
|
Today's Week |
|
|
|
|
|
|
|
|
|
|
|
|
|
Retail Inventories Advance
(At 8:30 a.m ET)
| SCHEDULE 2026 |
No 1 |
No 2 |
No 3 |
No 4 |
No 5 |
No 6 |
No 7 |
No 8 |
No 9 |
No 10 |
No 11 |
No 12 |
| Release | Week |
|
|
|
|
|
|
|
|
|
|
|
|
| Release | Date |
|
|
|
|
|
|
|
|
|
|
|
|
| Release | Day |
|
|
|
|
|
|
|
|
|
|
|
|
 |
|
|
|
|
|
|
|
|
|
|
|
|
| Prior |
... |
0.0% |
... |
... |
... |
... |
... |
... |
... |
... |
... |
... |
| Prior Revised |
-0.5% |
... |
... |
0.3% |
... |
... |
... |
... |
... |
... |
... |
... |
| Consensus |
... |
... |
... |
... |
... |
... |
... |
... |
... |
... |
... |
... |
| Consensus Low |
... |
... |
... |
... |
... |
... |
... |
... |
... |
... |
... |
... |
| Consensus High |
... |
... |
... |
... |
... |
... |
... |
... |
... |
... |
... |
... |
| ACTUAL LEVEL |
0.0% |
... |
... |
0.7% |
... |
... |
... |
... |
... |
... |
... |
... |
| Month For |
|
|
|
|
|
|
|
|
|
|
|
|
| RATING |
Dec-25 |
Jan-26 |
Feb-26 |
Mar-26 |
Apr-26 |
May-26 |
Jun-26 |
Jul-26 |
Aug-26 |
Sep-26 |
Oct-26 |
Nov-26 |
|
|
|
|
|
|
|
|
|
|
|
|
|
|
|
| |
|
| |
|
|
|
|
|
|
|
|
|
|
|
Release Schedule | 2025 |
|
|
Retail Inventories (Adv) | Sales and Inventories |
|
Today's Week |
|
|
|
|
|
|
|
|
|
|
|
|
|
Retail Inventories Advance
(At 8:30 a.m ET)
| SCHEDULE 2025 |
No 1 |
No 2 |
No 3 |
No 4 |
No 5 |
No 6 |
No 7 |
No 8 |
No 9 |
No 10 |
No 11 |
No 12 |
| Released Week: |
|
|
|
|
|
|
|
|
|
|
|
|
| Released Date: |
|
|
|
|
|
|
|
|
|
|
|
|
| Released Day: |
|
|
|
|
|
|
|
|
|
|
|
|
| Prior: |
0.3% |
-0.3% |
-0.1% |
0.1% |
-0.1% |
-0.1% |
0.3% |
0.3% |
0.2% |
... |
... |
... |
| Prior Revised: |
0.0% |
-0.5% |
0.1% |
-0.1% |
-0.3% |
0.0% |
... |
0.2% |
0.1% |
... |
... |
... |
| Consensus: |
... |
... |
... |
... |
... |
... |
... |
... |
... |
... |
... |
... |
| Consensus Low: |
... |
... |
... |
... |
... |
... |
... |
... |
... |
... |
... |
... |
| Consensus High: |
... |
... |
... |
... |
... |
... |
... |
... |
... |
... |
... |
... |
| ACTUAL LEVEL: |
-0.3% |
-0.1% |
0.1% |
-0.1% |
-0.1% |
0.3% |
0.3% |
0.2% |
0.0% |
... |
... |
... |
| Month For: |
|
|
|
|
|
|
|
|
|
|
|
|
| RATING |
Dec-24 |
Jan-25 |
Feb-25 |
Mar-25 |
Apr-25 |
May-25 |
Jun-25 |
Jul-25 |
Aug-25 |
Sep-25 |
Oct-25 |
Nov-25 |
|
|
|
|
|
|
|
|
|
|
|
|
|
|
|
| |
|
| |
|
|
|
|
|
|
|
|
|
|
|
Release Schedule | 2024 |
|
|
Retail Inventories | Sales and Inventories |
|
Today's Week |
|
|
|
|
|
|
|
|
|
|
|
|
|
Retail Inventories Advance
(At 8:30)
| SCHEDULE 2024 |
No 1 |
No 2 |
No 3 |
No 4 |
No 5 |
No 6 |
No 7 |
No 8 |
No 9 |
No 10 |
No 11 |
No 12 |
| Released Week: |
|
|
|
|
|
|
|
|
|
|
|
|
| Released Date: |
|
|
|
|
|
|
|
|
|
|
|
|
| Released Day: |
|
|
|
|
|
|
|
|
|
|
|
|
| Prior: |
-0.1% |
0.8% |
0.5% |
0.5% |
0.3% |
0.7% |
0.7% |
0.7% |
0.8% |
0.5% |
0.8% |
0.1% |
| Prior Revised: |
0.1% |
0.6% |
... |
... |
0.1% |
... |
0.6% |
0.9% |
... |
0.7% |
0.6% |
0.2% |
| Consensus: |
... |
... |
... |
... |
... |
... |
... |
... |
... |
... |
... |
... |
| Consensus Low: |
... |
... |
... |
... |
... |
... |
... |
... |
... |
... |
... |
... |
| Consensus High: |
... |
... |
... |
... |
... |
... |
... |
... |
... |
... |
... |
... |
| ACTUAL LEVEL: |
0.8% |
0.5% |
0.5% |
0.3% |
0.7% |
0.7% |
0.7% |
0.8% |
0.5% |
0.8% |
0.1% |
0.3% |
| Month For: |
|
|
|
|
|
|
|
|
|
|
|
|
| RATING |
Dec-23 |
Jan-24 |
Feb-24 |
Mar-24 |
Apr-24 |
May-24 |
Jun-24 |
Jul-24 |
Aug-24 |
Sep-24 |
Oct-24 |
Nov-24 |
|
|
|
|
|
|
|
|
|
|
|
|
|
|
|
| |
|
| |
|
|
|
|
|
|
|
|
|
|
|
Release Schedule | 2023 |
|
|
Retail Inventories | Sales and Inventories |
|
Today's Week |
|
|
|
|
|
|
|
|
|
|
|
|
|
Retail Inventories
(Advance)
| SCHEDULE 2023 |
No 1 |
No 2 |
No 3 |
No 4 |
No 5 |
No 6 |
No 7 |
No 8 |
No 9 |
No 10 |
No 11 |
No 12 |
| Released Week: |
|
|
|
|
|
|
|
|
|
|
|
|
| Released Date: |
|
|
|
|
|
|
|
|
|
|
|
|
| Released Day: |
|
|
|
|
|
|
|
|
|
|
|
|
| Prior: |
0.1% |
0.5% |
0.3% |
0.8% |
0.7% |
0.2% |
0.8% |
0.7% |
0.3% |
1.1% |
0.9% |
0.0% |
| Prior Revised: |
0.0% |
0.4% |
0.1% |
0.3% |
0.5% |
0.3% |
0.7% |
0.5% |
0.5% |
No |
0.4% |
-0.1% |
| Consensus: |
... |
... |
... |
... |
... |
... |
... |
... |
... |
... |
... |
... |
| Consensus Low: |
... |
... |
... |
... |
... |
... |
... |
... |
... |
... |
... |
... |
| Consensus High: |
... |
... |
... |
... |
... |
... |
... |
... |
... |
... |
... |
... |
| ACTUAL LEVEL: |
0.5% |
0.3% |
0.8% |
0.7% |
0.2% |
0.8% |
0.7% |
0.3% |
1.1% |
0.9% |
0.0% |
-0.1% |
| Month For: |
|
|
|
|
|
|
|
|
|
|
|
|
| RATING |
Dec 22 |
Jan-23 |
Feb-23 |
Mar-23 |
Apr-23 |
May-23 |
Jun-23 |
Jul-23 |
Aug-23 |
Sep-23 |
Oct-23 |
Nov-23 |
|
|
|
|
|
|
|
|
|
|
|
|
|
|
|
| |
|
| |
|
|
|
|
|
|
|
|
|
|
|
Release Schedule | 2022 |
|
|
Retail Inventories | Sales and Inventories |
|
Today's Week |
|
|
|
|
|
|
|
|
|
|
|
|
|
Retail Inventories
(Advance)
| SCHEDULE 2022 |
No 1 |
No 2 |
No 3 |
No 4 |
No 5 |
No 6 |
No 7 |
No 8 |
No 9 |
No 10 |
No 11 |
No 12 |
| Released Week: |
|
|
|
|
|
|
|
|
|
|
|
|
| Released Date: |
|
|
|
|
|
|
|
|
|
|
|
|
| Released Day: |
|
|
|
|
|
|
|
|
|
|
|
|
| Prior: |
2.0% |
4.4% |
1.9% |
1.1% |
2.0% |
0.7% |
1.1% |
2.0% |
1.1% |
1.4% |
0.4% |
-0.2% |
| Prior Revised: |
... |
4.7% |
... |
1.5% |
3.0% |
... |
... |
1.9% |
... |
... |
-0.1% |
-0.4% |
| Consensus: |
... |
... |
... |
... |
... |
... |
... |
... |
... |
... |
... |
... |
| Consensus Low: |
... |
... |
... |
... |
... |
... |
... |
... |
... |
... |
... |
... |
| Consensus High: |
... |
... |
... |
... |
... |
... |
... |
... |
... |
... |
... |
... |
| ACTUAL LEVEL: |
4.4% |
1.9% |
1.1% |
2.0% |
0.7% |
1.1% |
2.0% |
1.1% |
1.4% |
0.4% |
-0.2% |
0.1% |
| Month For: |
|
|
|
|
|
|
|
|
|
|
|
|
| RATING |
Dec 21 |
Jan-22 |
Feb-22 |
Mar-22 |
Apr-22 |
May-22 |
Jun-22 |
Jul-22 |
Aug-22 |
Sep-22 |
Oct-22 |
Nov-22 |
|
|
|
|
|
|
|
|
|
|
|
|
|
|
|
| |
|
| |
|
|
|
|
|
|
|
|
|
|
|
Release Schedule | 2021 |
|
|
Retail Inventories | Sales and Inventories |
|
Today's Week |
|
|
|
|
|
|
|
|
|
|
|
|
|
Retail Inventories
(Advance)
| SCHEDULE 2021 |
No 1 |
No 2 |
No 3 |
No 4 |
No 5 |
No 6 |
No 7 |
No 8 |
No 9 |
No 10 |
No 11 |
No 12 |
| Released Week: |
|
|
|
|
|
|
|
|
|
|
|
|
| Released Date: |
|
|
|
|
|
|
|
|
|
|
|
|
| Released Day: |
|
|
|
|
|
|
|
|
|
|
|
|
| Prior: |
0.306% |
1.476% |
0.313% |
1.369% |
0.656% |
0.686% |
0.795% |
0.732% |
0.499% |
... |
... |
... |
| Prior Revised: |
... |
... |
... |
... |
... |
... |
... |
... |
... |
... |
... |
... |
| Consensus: |
... |
... |
... |
... |
... |
... |
... |
... |
... |
... |
... |
... |
| Consensus Low: |
... |
... |
... |
... |
... |
... |
... |
... |
... |
... |
... |
... |
| Consensus High: |
... |
... |
... |
... |
... |
... |
... |
... |
... |
... |
... |
... |
| ACTUAL LEVEL: |
1.476% |
0.313% |
1.369% |
0.656% |
0.686% |
0.795% |
0.732% |
0.499% |
0.635% |
... |
... |
2.0% |
| Month For: |
|
|
|
|
|
|
|
|
|
|
|
|
| RATING |
Dec 20 |
Jan-21 |
Feb-21 |
Mar-21 |
Apr-21 |
May-21 |
Jun-21 |
Jul-21 |
Aug-21 |
Sep-21 |
Oct-21 |
Nov-21 |
|
|
|
|
|
|
|
|
|
|
|
|
|
|
|
| |
|
| |
|
Legends: |
 |
Delayed |
 |
Positive View |
 |
Negative View |
 |
Neutral View |
 |
Non Available |
|
|
|
|
|
|
|
|
|
|
|
|
|
|
|
|
|
|
|
|
| |
|
|
|
|
|
|
|
|
|
|
|
|
|
|
|
|
|
|
|
|
|
Brief News | 2026 |
|
|
Retail Inventories (Adv) | Sales and Inventories |
|
Today's Week |
|
|
|
|
|
|
|
|
|
|
|
|
|
Retail -Inventories Advance | Sales and Inventories
| DATE/WEEK |
HIGHLIGHTS |
FOR |
Y/Y |
|
Retail Inventories |
No 12 |
... |
|
Nov-2025 |
|
| |
|
|
|
Retail Inventories |
No 11 |
... |
|
Oct-2025 |
|
| |
|
|
|
Retail Inventories |
No 10 |
... |
|
Sep-2025 |
|
| |
|
|
|
Retail Inventories |
No 9 |
... |
|
Aug-2025 |
|
| |
|
|
|
Retail Inventories |
No 8 |
... |
|
Jul-2025 |
|
| |
|
|
|
Retail Inventories |
No 7 |
... |
|
Jun-2025 |
|
| |
|
|
|
Retail Inventories |
No 6 |
... |
|
May-2025 |
|
| |
|
|
|
Retail Inventories |
No 5 |
... |
|
Apr-2025 |
|
| |
|
|
|
Retail Inventories |
No 4 |
... |
|
Mar-2025 |
|
| |
|
|
|
Retail Inventories |
No 3 |
... |
|
Feb-2025 |
|
| |
|
|
|
Retail Inventories |
No 2 |
... |
|
Jan-2025 |
|
| |
|
|
|
Retail Inventories |
No 1 |
... |
|
Dec-2024 |
|
| |
|
|
|
|
|
|
|
|
| |
|
|
|
|
|
| |
|
|
|
|
|
|
|
|
|
|
|
|
|
|
|
Brief News | 2025 |
|
|
Retail Inventories (Adv) | Sales and Inventories |
|
Today's Week |
|
|
|
|
|
|
|
|
|
|
|
|
|
Retail -Inventories Advance | Sales and Inventories
| DATE/WEEK |
HIGHLIGHTS |
FOR |
Y/Y |
|
Case-Shiller Index |
No 12 |
... |
|
Nov-2025 |
|
| |
|
|
|
Case-Shiller Index |
No 11 |
... |
|
Oct-2025 |
|
| |
|
|
|
Case-Shiller Index |
No 10 |
... |
|
Sep-2025 |
|
| |
|
|
|
Retail inventories are flat in August from July. That reflects an offsetting decline of 0.4 percent in motor vehicles and parts and increase of 0.3 percent in the total excluding motor vehicles and parts. For July, the total is revised to show a 0.1 percent rise versus 0.2 percent previously reported. |
No 9 |
0.0% |
|
Aug-2025 |
|
| |
|
|
|
The U.S. Census Bureau's Advance Retail Inventories report for July 2025 shows that retail inventories increased by 0.2% from the previous month, June 2025. This represents a shift from the preliminary estimate of a 0.1% rise, with the final July figures showing a stronger increase in both overall retail inventories and motor vehicle inventories, which rose 0.5%. |
No 8 |
0.2% |
|
Jul-2025 |
|
| |
|
|
|
The U.S. Census Bureau did not release advance retail inventories for June 2025 on July 29; the advance report for June 2025 retail inventories was published on August 15, 2025. The release stated that retail inventories rose by 0.3% in June 2025, which was an upward revision from the preliminary estimate. |
No 7 |
0.3% |
|
Jun-2025 |
|
| |
|
|
|
The advance estimate for U.S. retail inventories in May 2025 shows a 0.3% increase from April 2025, a figure that was higher than the initial expectation of a 0.1% decrease. This rise in retail stockpiles is notable as the prior month (April) saw a 0.1% decrease, and the year-over-year change for May 2025 was a 3.2% increase. |
No 6 |
0.3% |
|
May-2025 |
|
| |
|
|
|
US Retail Inventories advanced by 0.1% in April 2025, according to Trading Economics. This follows a 0.1% increase in March and aligns with market expectations. While wholesale inventories rose and factory inventories declined, retail inventories specifically remained unchanged according to one source. However, another source indicates a 0.1% rise in retail inventories in April after a 0.3% decrease in March, which is a revision from the advance estimate. |
No 5 |
-0.1% |
|
Apr-2025 |
|
| |
|
|
|
US Retail Inventories declined by 0.1% in March 2025, a downward revision from the preliminary estimate and a reversal of the previous month's slight increase. This decline contributed to a marginal increase of 0.1% in total business inventories for March, with strong sales growth at retailers depleting their stocks. |
No 4 |
-0.1% |
|
Mar-2025 |
|
| |
|
|
|
US retail inventories increased by 0.1% in February 2025, matching the previous month's unchanged figure, according to the Advance Monthly Retail Inventories report from the Census Bureau. Core retail inventories, which exclude motor vehicle and parts, also increased by 0.1%, while motor vehicle inventories remained unchanged. |
No 3 |
0.1% |
|
Feb-2025 |
|
| |
|
|
|
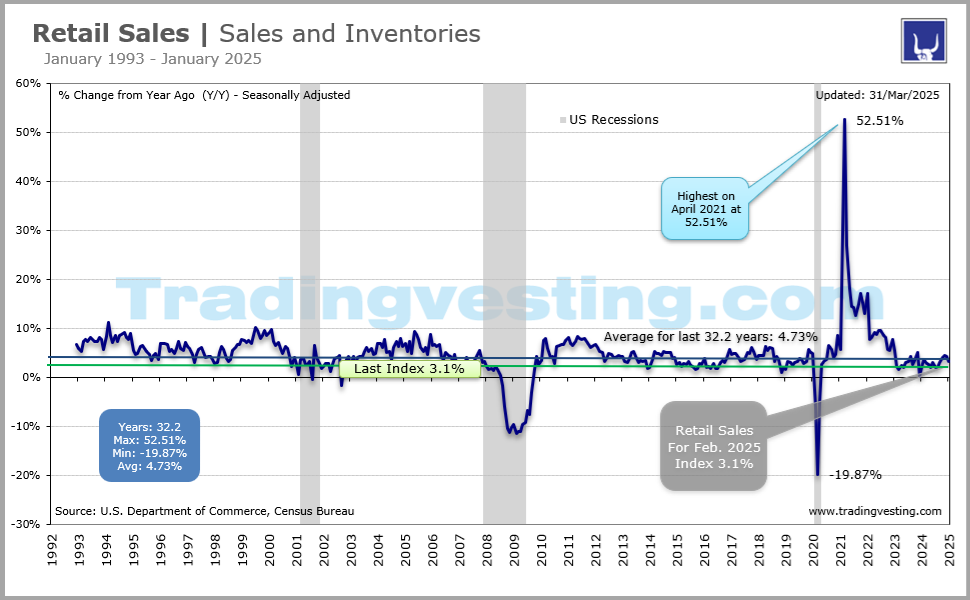
Retail inventories for January, adjusted for seasonal variations and trading day differences, but not for price changes, were estimated at an end-of-month level of $821.3 billion, down 0.1 percent (±0.2 percent)* from December 2024, and were up 4.9 percent (±0.7 percent) from January 2024. |
No 2 |
-0.1% |
|
Jan-2025 |
|
| |
|
|
|
Retail advance inventories in the U.S. were an estimated $823.3 billion in December 2024, a decrease of 0.3% from November 2024 (seasonally adjusted), according to the U.S. Census Bureau. This figure represents the value of goods held by retailers. |
No 1 |
-0.3% |
|
Dec-2024 |
|
| |
|
|
|
|
|
|
|
|
| |
|
|
|
|
|
| |
|
|
|
|
|
|
|
|
|
|
|
|
|
|
|
Brief News | 2024 |
|
|
Retail Inventories (Adv) | Sales and Inventories |
|
Today's Week |
|
|
|
|
|
|
|
|
|
|
|
|
|
Retail Inventories (Adv) | Sales and Inventories
| DATE/WEEK |
HIGHLIGHTS |
FOR |
Y/Y |
|
Retail Sales |
No 12 |
0.3% |
|
Nov-2024 |
|
| |
|
|
|
Retail Sales |
No 11 |
0.1% |
|
Oct-2024 |
|
| |
|
|
|
Retail Sales |
No 10 |
|
|
Sep-2024 |
|
| |
|
|
|
home |
No 9 |
0.5% |
|
Aug-2024 |
|
| |
|
|
|
home |
No 8 |
0.8% |
|
Jul-2024 |
|
| |
|
|
|
home |
No 7 |
0.7% |
|
Jun-2024 |
|
| |
|
|
|
home |
No 6 |
0.7% |
|
May-2024 |
|
| |
|
|
|
home |
No 5 |
0.7% |
|
Apr-2024 |
|
| |
|
|
|
home |
No 4 |
0.3% |
|
Mar-2024 |
|
| |
|
|
|
home |
No 3 |
0.5% |
|
Feb-2024 |
|
| |
|
|
|
home |
No 2 |
0.5% |
|
Jan-2024 |
|
| |
|
|
|
home |
No 1 |
0.8% |
|
Dec-2023 |
|
| |
|
|
|
|
|
|
|
|
| |
|
|
|
|
|
| |
|
|
|
|
|
|
|
|
|
|
|
|
|
|
|
Brief News | 2023 |
|
|
Retail Inventories | Sales and Inventories |
|
Today's Week |
|
|
|
|
|
|
|
|
|
|
|
|
|
Retail Inventories (Adv) | Sales and Inventories
| DATE/WEEK |
HIGHLIGHTS |
FOR |
ACTUAL |
|
home |
No 12 |
-0.1% |
|
Nov-2023 |
|
| |
|
|
|
home |
No 11 |
0.0% |
|
Oct-2023 |
|
| |
|
|
|
home |
No 10 |
|
|
Sep-2023 |
|
| |
|
|
|
home |
No 9 |
1.1% |
|
Aug-2023 |
|
| |
|
|
|
home |
No 8 |
0.3% |
|
Jul-2023 |
|
| |
|
|
|
home |
No 7 |
0.7% |
|
Jun-2023 |
|
| |
|
|
|
home |
No 6 |
0.8% |
|
May-2023 |
|
| |
|
|
|
home |
No 5 |
0.2% |
|
Apr-2023 |
|
| |
|
|
|
home |
No 4 |
0.7% |
|
Mar-2023 |
|
| |
|
|
|
home |
No 3 |
0.8% |
|
Feb-2023 |
|
| |
|
|
|
home |
No 2 |
0.3% |
|
Jan-2023 |
|
| |
|
|
|
home |
No 1 |
0.5% |
|
Dec-2022 |
|
| |
|
|
|
|
|
|
|
|
| |
|
|
|
|
|
| |
|
|
|
|
|
|
|
|
|
|
|
|
|
|
|
Brief News | 2021-2022 |
|
|
Retail Inventories | Sales and Inventories |
|
Today's Week |
|
|
|
|
|
|
|
|
|
|
|
|
|
Retail Inventories Advance | Sales & Inventories
| DATE/WEEK |
HIGHLIGHTS |
FOR |
ACTUAL |
|
home |
No 12 |
|
|
Nov-2022 |
|
| |
|
|
|
home |
No 11 |
1.1% |
|
Oct-2022 |
|
| |
|
|
|
home |
No 10 |
|
|
Sep-2022 |
|
| |
|
|
|
home |
No 9 |
1.1% |
|
Aug-2022 |
|
| |
|
|
|
home |
No 8 |
|
|
Jul-2022 |
|
| |
|
|
|
home |
No 7 |
1.1% |
|
Jun-2022 |
|
| |
|
|
|
home |
No 6 |
|
|
May-2022 |
|
| |
|
|
|
home |
No 5 |
1.1% |
|
Apr-2022 |
|
| |
|
|
|
home |
No 4 |
|
|
Mar-2022 |
|
| |
|
|
|
Retail Inventories up 1.1% in February 2022. Mar. 28, 2022 8:32 AM. Retail Inventories (Advance): +1.1% in February to $665.6B vs. prior +1.9%. |
No 3 |
1.1% |
|
Feb-2022 |
|
| |
|
|
|
Retail Inventories climb 1.9% in January 2021. Feb. 28, 2022 8:31 AM. Retail Inventories (Advance): +1.9% in January to $658.1B vs. +4.7% prior (revised from +4.2%) |
No 2 |
|
|
Jan-2022 |
|
| |
|
|
|
Retail Inventories +4.4% in December 2021. Jan. 26, 2022 8:31 AM. Retail Inventories (Advance): +4.4% in December 2021 to $643.8B vs. +2% prior. |
No 1 |
4.4% |
|
Dec-2021 |
|
| |
|
|
|
|
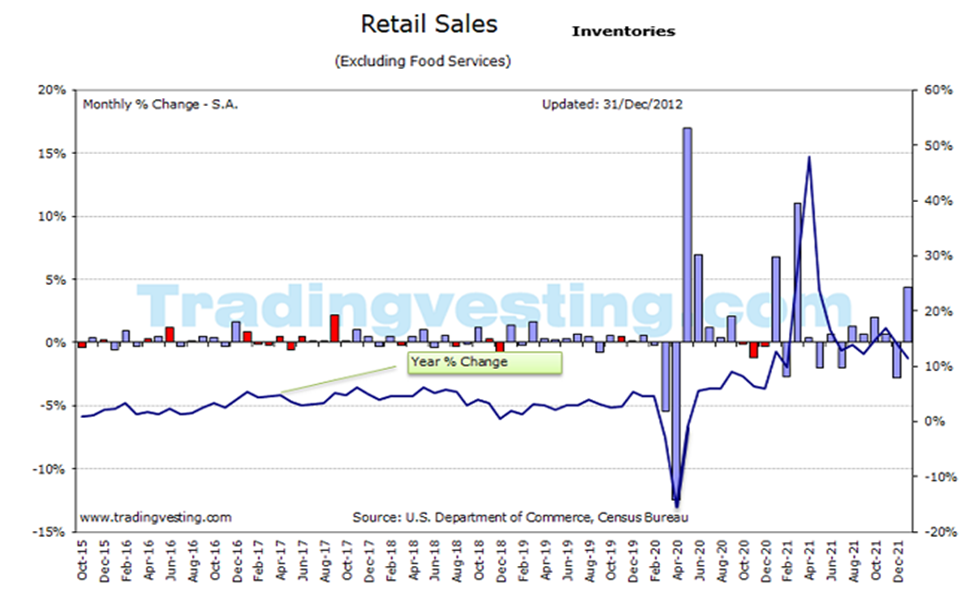
Retail Inventories +2.0% in November 2021. Dec. 29, 2021 8:31 AM. Retail Inventories (Advance): +2.0% in November to $616.9B vs. +0.1% prior. Retail inventories excluding autos, which go into the calculation of GDP, increased 0.5%, rather than 0.4% as estimated last month, nov. |
No 12 |
|
|
Nov-2021 |
|
| |
|
|
|
Retail Inventories +0.1% in October 2021. Nov. 24, 2021 8:30 AM. Retail Inventories (Advance): +0.1% in October to $603.6B vs. -0.2% prior. |
No 11 |
60.8 |
|
Oct-2021 |
|
| |
|
|
|
Retail Inventories -0.2% in September 2021. Oct. 27, 2021 8:30 AM. Retail Inventories (Advance): -0.2% in September to $602.9B vs. +0.1% prior. |
No 10 |
|
|
Sep-2021 |
|
| |
|
|
|
Retail Inventories +0.8% in August 2021. Sep. 29, 2020 8:32 AM. Retail Inventories (Advance): +0.8% in August to $599.7B vs. +1.2% prior. September 29, 2021, 7:00 AM . U.S. retailers gearing up for the holiday shopping season were having some success acquiring imported merchandise at the start of the peak shipping season. The Commerce Department’s advance economic indicators report on Tuesday showed a 0.6% gain in inventories at retailers excluding motor vehicle dealers in August. Compared with a year earlier, when the nation was still contending with the fallout from coronavirus, inventories were up 10.8% after a record 11.1% year-over-year surge in July. |
No 9 |
59.9 |
|
Aug-2021 |
|
| |
|
|
|
Retail Inventories +0.4% in July 2021. Aug. 27, 2021 8:31 AM. Retail Inventories (Advance): +0.4% in July to $603.2B vs. +0.3% prior. |
No 8 |
|
|
Jul-2021 |
|
| |
|
|
|
Wednesday, 28 July 2021 14:48 GMT. Retail inventories excluding autos, which go into the calculation of GDP, climbed 0.6% after advancing 0.9% in May 2021. Business inventories were drawn down in the first quarter. Overall, it looks like real inventories fell sharply in the second quarter on net, but the weakness was most severe early in the quarter. Goods trade deficit increases 3.5% in June 2021. Wholesale inventories rise 0.8%; retail stocks up 0.3%. |
No 7 |
60.6 |
|
Jun-2021 |
|
| |
|
|
|
Retail inventories decreased fell 0.8% in May 2021 as estimated in an advance report published last month. That followed a 1.7% decrease in April 2021. Motor vehicle inventories decreased 5.5%, rather than 5.3% as estimated in an advance report published last month. A global semiconductor shortage is undercutting auto production, leading to stocks being run down and prices of used car and trucks soaring, boosting inflation. Retail inventories excluding autos, which go into the calculation of GDP, increased 0.9% as estimated last month. |
No 6 |
|
|
May-2021 |
|
| |
|
|
|
home |
No 5 |
60.7 |
|
Apr-2021 |
|
| |
|
|
|
home |
No 4 |
|
|
Mar-2021 |
|
| |
|
|
|
Retail Inventories flay M/M in February 2021. Mar. 26, 2021 8:31 AM. Retail Inventories (Advance): flat in February to $625.9B vs. -0.3% prior (revised from -0.5%). |
No 3 |
0.5% |
|
Feb-2021 |
|
| |
|
|
|
home |
No 2 |
|
|
Jan-2021 |
|
| |
|
|
|
home |
No 1 |
0.0% |
|
Dec-2020 |
|
| |
|
|
|
|
|
|
|
|
| |
|
|
|
|
|
| |
|
Legends: |
|
Delayed |
|
Positive View |
|
Negative View |
|
Neutral View |
|
Non Available |
|
|
|
|
|
|
|
|
|
|
|
|
|
|
|
|
|
|
|
|
| |
|
|
|
|
|
|
|
|
|
|
|
|
|
|
|
|
|
|
|
|
|
Definitions | Explain |
|
|
Retail Inventories | Sales and Inventories |
|
Today's Week |
|
|
|
|
|
|
|
|
|
|
|
|
| |
|
|
|
|
| |
|
|
|
| |
|
|
|
|
|
|
|
|
|
|
|
|
|
|
|
|
|
|
|
|
|
Data | Source |
|
|
Retail Inventories | Sales and Inventories |
|
Today's Week |
|
|
|
|
|
|
|
|
|
|
|
|
| |
|
|
|
|
|
|
| DATA INFORMATION |
RETAIL INVENTORIES |
| SOURCE |
Bureau of the Census, U.S. Department of Commerce. |
| WEB |
www.census.gov |
| FREQUENCY |
Monthly |
| AVAILABILITY |
Mid-month |
| COVERAGE |
Data are for the previous month. Data for June are released in July. |
| REVISIONS |
Yes |
| IMPORTANCE |
Sales and Inventories - Very Important |
|
| |
|
|
|
|
|
|
|
|
|
|
|