 |
 |
|
 |
|
Small Charts | Tradingvesting.com |
|
 |
|
|
|
|
|
| INTEREST RATES |
INTEREST RATES - CHART |
Already-low interest rates rose steadily in 2009 as the economy slowly began to recover, with the yield on the benchmark 10-year note hitting 4.01% in the spring of 2010.
But since then, extreme fear has settled in, sending investors fleeing for the safety of government-backed U.S. Treasuries, sending 10-year yields tumbling to all-time lows.
When interest rates spike, which they will at some point, the U.S. might have to cut out welfare, Social Security, and military spending just to pay the interest.
Interest rates are largely a function of perceived risk. The higher creditors' deem the risk of investing in U.S. treasuries goes, the higher interest rates we will have to pay.
The U.S. has effectively sold its debt by way of US Treasury bonds. When those become due, the U.S. is supposed to pay them back with interest. The U.S. can't issue new bonds to pay for the old ones. |
 |
| 10-YEAR YIELD |
10 YEAR TREASURY NOTES - CHART |
Our models suggest that 10-year U.S. Treasury yields should be trading at 2.5% now, but they are not there because Treasurys have been bought as the ultimate liquid safe asset.
The 10-year yield was at 1.411%, its lowest level since the early 1800s.
In other words, the last time the U.S. Treasury yields were this low, the British were attacking the Inner Harbor in Baltimore while Francis Scott Key penned the national anthem.
The Fed can't keep U.S. interest rate at virtual zero for ever. So if there are any improvements in the perception that risk is subsiding, that could lead investors to offload those Treasury assets and if that happens quickly it would be dangerous for the bond market because it would lead to a weaker dollar. Sooner or later, other countries will stop buying US Treasury bonds, and we will have no means to keep our economy / government spending afloat. We will have to default on our debt, and all sorts of negative things happen for all of us - including an economic depression that would be much worse than the Great Depression.
|
 |
| ECONOMIC GROWTH |
GDP - CHART |
When the economy expands, more people work and they work more hours at higher wages. That leads to more tax revenues.
At the same time, when more people work, fewer people tend to need unemployment benefits, which helps lead to lower spending.
During the first three months of 2009, the economy slumped at an annual rate of 6.7%.
Since then GDP has been growing and slowly recovering, but the rebound has been a lackluster one compared to those following prior recessions.
Raising taxes has never made the economy grow |
 |
| INFLATION |
CPI - CHART |
Gas and food prices have had a few temporary growth spurts in the past few years, but overall, inflation has remained relatively low, held back by falling home prices and stagnant wages.
As the rate of inflation changes and as expectations on inflation change, the markets adjust interest rates. The effect ripples across stocks, bonds, commodities, and your portfolio, often in a dramatic fashion.
Inflation (along with various risks) basically explains how interest rates are set on everything from your mortgage and auto loans to Treasury bills, notes and bonds.
If someone borrows $100 dollars from you today and promises to repay it in one year with interest, how much interest should you charge.
A: The answer depends largely on inflation as you know the $100 will not be able to buy the same amount of goods and services a year from now.
Very simply, hyperinflation is runaway inflation or inflation that is "out of control." The definition used by most economists is “an inflationary cycle without any tendency toward equilibrium
|
 |
| GAS PRICE |
GAS PRICES - CHART |
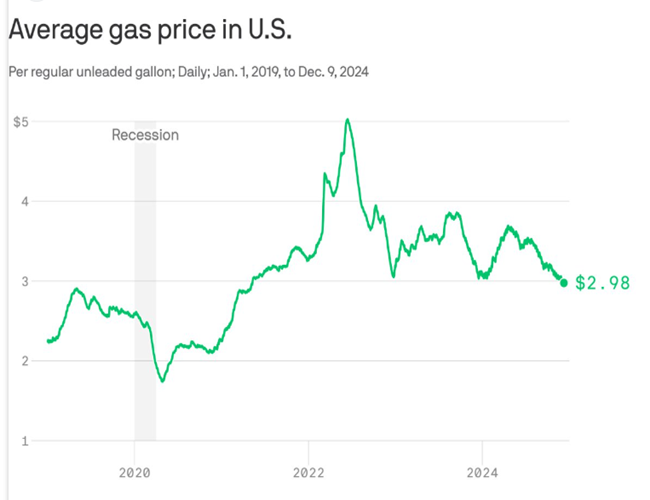
Three-and-a-half years ago, filling up at the pump cost around $1.60 a gallon. But then, gas prices began to climb, eventually topping out at nearly $4 a gallon in mid-2011, and coming pretty close again in 2012.
Since then, prices have fallen back a bit, but at $3.35 a gallon, are still nowhere near 2009 levels.
|
 |
| JOB GROWTH |
JOB GROWTH - CHART |
Here's a look at where the economy stands,
Non Farm Payrolls: US President Barack Obama entered office on Jan. 20, 2009.
How many jobs does the econmy create?
|
 |
| EMPLOYMENT RATE |
UNEMPLOYMENT - CHART |
The unemployment rate measures the number of unemployed as a percentage of the labor force.
The unemployment rate surged to 10% in Obama's first year in office and has fallen gradually since then, landing at 8.2% as of June. Part of the decline has come as some Americans have gone back to work, but also because many workers have dropped out of the labor force.
|
 |
| HOME PRICES |
S&P CASE SHILLER - CHART |
Home prices have moved up and down since the start of Obama's term. Lifted in 2010 on the back of the Recovery Act's homebuyer tax credit, prices later fell when the credit expired. But overall, the trend has been lower, and housing remains in a major slump .
More than 3 million Americans have lost their homes to foreclosure since early 2009, but bank repossessions have fallen in half since they peaked in September 2010.
National Median Home Price: 185K |
 |
| INDUSTRIAL |
INDUSTRIAL - CHART |
Manufacturing slowed through much of 2009, bottoming out midway through the year.
Since then, the sector has steadily rebounded, with industrial production hitting a nearly four-year high in April.
87.4 to 98
|
 |
| CONSUMER SPENDING |
CONSUMER SPENDING - CHART |
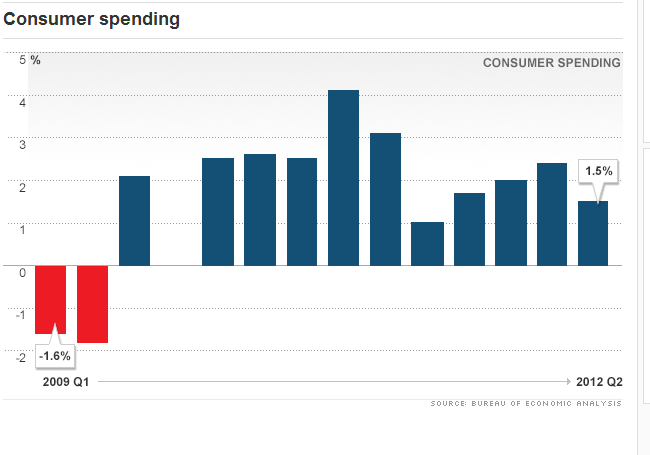
Amid slumping home prices and rising unemployment, consumers pulled back on their spending during the recession.
Stimulus programs temporarily boosted auto sales and home purchases in 2009, but since then, spending has picked up only gradually. Consumers are focusing on paying down debt instead
.Between Obama's inauguration day on January 20, 2009, through Oct 2, 2012, the TOTAL OF ALL DEBT ACCUMULATED THROUGHOUT THE ENTIRE HISTORY OF OUR NATION, was INCREASED BY OVER 65%, adding over 5.5 trillion dollars to our nation's crushing debt burden!
|
 |
| DXEBT TO GDP |
DEBT - CHART |
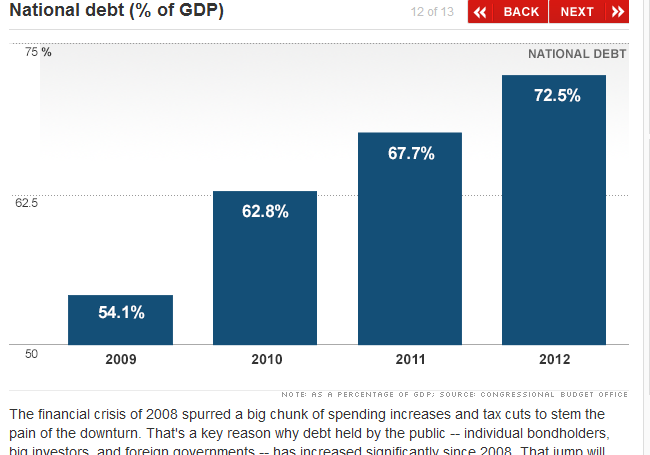
The financial crisis of 2008 spurred a big chunk of spending increases and tax cuts to stem the pain of the downturn.
That's a key reason why debt held by the public -- individual bondholders, big investors, and foreign governments -- has increased significantly since 2008. That jump will have to be paid off with interest.
Much of those emergency measures will end, so for the next decade annual deficits should be much lower than they've been recently. But over the long run, debt is still projected to grow faster than the economy.
Americans effectively sell our debt by way of US Treasury bonds. When those become due, americans are supposed to pay them back with interest. Because we can't, we issue new bonds to pay for the old ones. Repeat many, many times.
Ver
|
 |
| GOVERNMENT SPENDING |
GOV SPENDING - CHART |
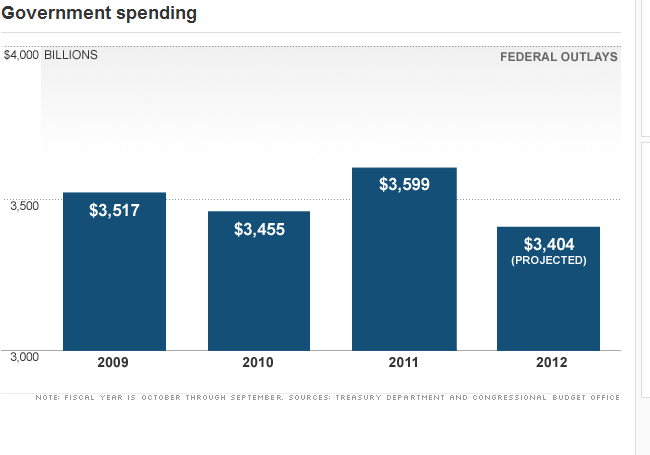
The bank bailout and federal stimulus programs aimed at juicing the economy pushed up spending significantly in fiscal 2009, which began in October of 2008. Revenue, meanwhile, fell to 60-year lows as the economy slumped and millions of people lost their jobs. That, in turn, increased safety net spending. We effectively sell our debt by way of US Treasury bonds. When those become due, we are supposed to pay them back with interest. Because we can't, we issue new bonds to pay for the old ones. Repeat many, many times.
Sooner or later, other countries will stop buying US Treasury bonds, and we will have no means to keep our economy / government spending afloat. We will have to default on our debt, and all sorts of negative things happen for all of us - including an economic depression that would be much worse than the Great Depression. So yes, the deficit is very important, but the government just keeps spending like it means nothing
ver
|
 |
| U.S. DOLLAR |
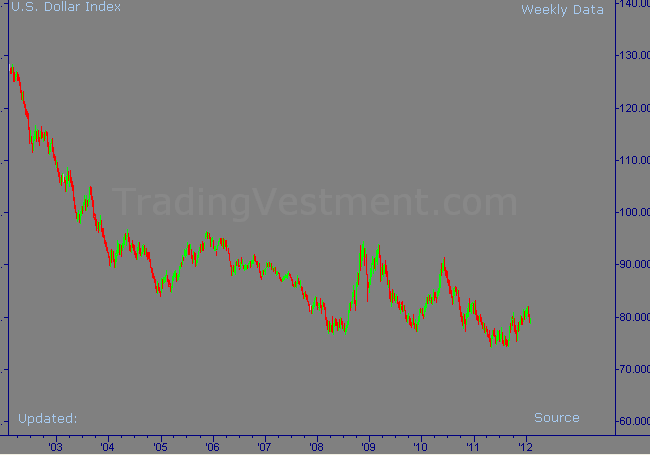
US DOLLAR - CHART |
The more we owe the less our currency is worth. So when we borrow to keep government running or pay for more government than our money is worth less and everything we want to buy apparently cost more. We have a fit about a 5% tax increase and completely ignore this hidden tax that's in the thousands of percents.
2000 years ago in ancient Rome a man could buy a fine new toga, a good meal, and a fine pair of sandals for an ounce of gold. Today an ounce of Gold is worth around 1300 dollars which could get you a high quality suit, fine leather shoes and if you didn't go nuts on the suit you could get a good meal for yourself after shopping. In 2000 years the commodity is worth pretty much exactly the same thing. In 60 years our dollar has devalued around 4000%.
We can print more of our false money (Federal Reserve Notes), which does nothing but drag the value of the US Dollar down while making prices rise. Eventually, unless we can get the debt under control, the party ends and we have to pay it all back. Since we can't, and we won't really reduce the deficit, we're in for a really long, hard time.
|
 |
| CORPORATE PROFIT |
CORPOARTE PROFIT - CHART |
Even as U.S. unemployment has remained above 8 percent for 43 months, the country's biggest banks are making almost as much as they ever have. The combined $63 billion in profit reported by the six largest U.S. lenders over the four quarters through June is more than they earned in any calendar year since the peak in 2006.The $63 billion profit for the 12 months ended June 30 was exceeded only in calendar years 2005 and 2006, when combined net income was $68 billion and $83 billion. While the latest figure is about half of what the six banks earned in 2006 when firms purchased during the financial crisis are included, they are still among the nation's biggest money-makers. Fewer than 20 companies, including the banks, made $10 billion in the four quarters though June.Our country and our government have spent a lot of money stabilizing the banking industry. Profit tells only part of the story. What strikes closer to Wall Street's core is return on equity, a measure of how efficiently a company generates income.The big problem is the return they're making on shareholders' equity. Banks increased leverage, a measure of how much they've borrowed, to boost returns before the financial crisis.
|
 |
| BANKING |
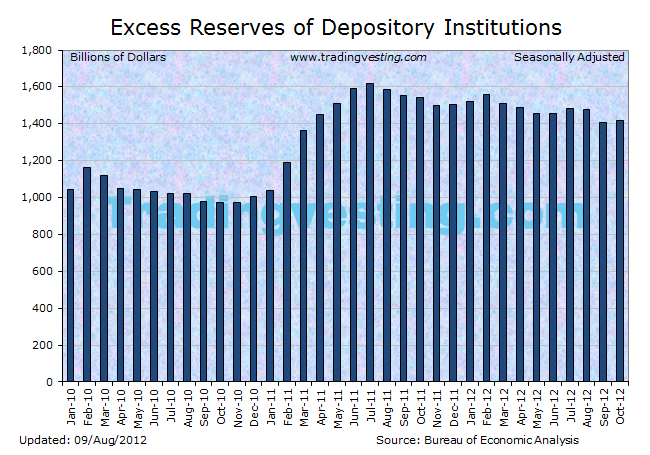
BANKING SYSTEM - CHART |
The problem is you're simultaneously reducing the amount of leverage in the system at the same time you're limiting revenues for these larger banks.
Banks had benefited after the Fed cut its federal funds target rate to almost zero in 2008, borrowing cheaply while collecting interest on existing loans. New loans at lower rates erode profit.
The "very low interest-rate environment that bailed these guys out was also a curse,"
Those three banks, along with Goldman Sachs, are trading at a discount to tangible book value, which means investors value the company less than what shareholders would receive if it were liquidated
investors have little confidence in banks because they've grown since the financial crisis and have managed to delay or water down regulation.
|
 |
| S&P 500 |
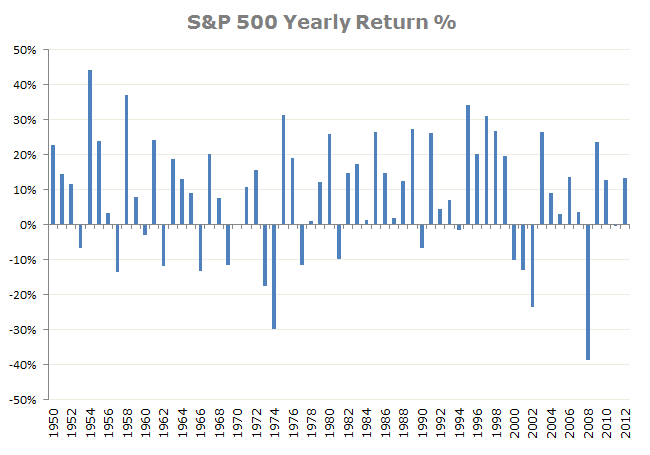
S&P 500 - CHART |
banks will have to maintain bigger capital cushions to protect against losses. Tangible common equity, a measure that ignores intangible assets such as goodwill, has doubled at the six banks since 2007. It was 7 percent of total assets on average in the second quarter, an increase of 88 percent over the five years.
|
 |
 |
|
|
|
|
| |
|
| |
|
The Top 10 S&P 500 Stocks By Weight
The top 10 holdings of the S&P 500 represent 32.5% or a third of the index. The weights below are based on holdings of the SPDR S&P 500 ETF Trust (SPY) that closely mimics the S&P 500 index. The table was compiled on May 21, 2024. |
|


