 |
 |
|
 |
Wholesale Trade Adv | Sales and Inventories |
|
 |
|
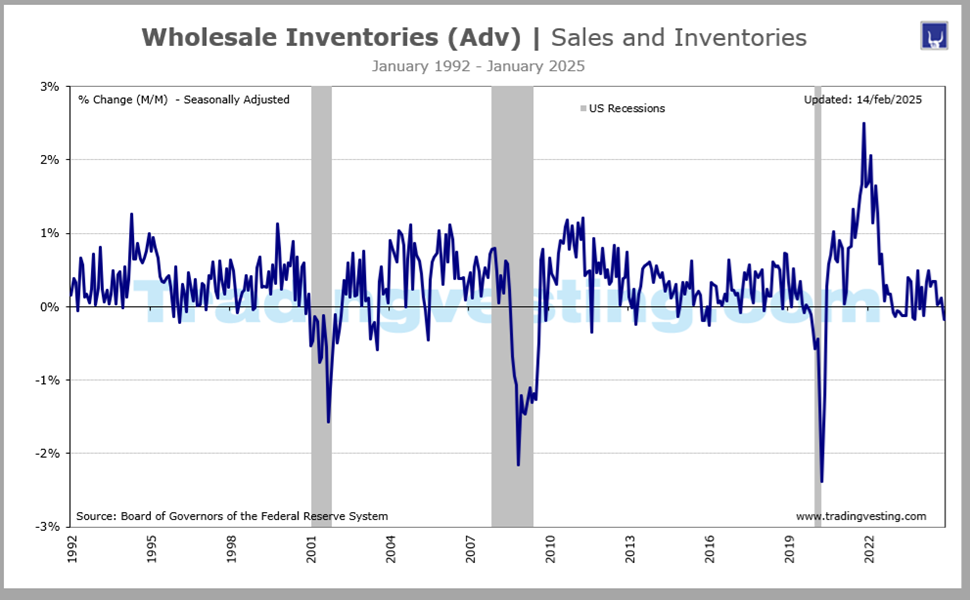
The Wholesale Trade or Wholesale Inventories report is the stock of goods available for sale by wholesalers and a factor that may influence the country's GDP. The second estimate of wholesale inventories.. Read More...
|
|
|
|
|
|
|
| |
|
| |
 4. Wholesale Trade Adv (4 of 6)
 5. Retail inventories (5 of 6)
 6. E-Commerce (6 of 6)
 1. Retail Sales (1 of 6)
 2. Business Inventories (2 of 6)
 3. Wholesale Trade Pre (3 of 6)
|
 |
|
|
|
|
| |
|
→ Big Chart |
|
→ Release |
|
| |
|
|
|
|
|
|
|
|
|
|
|
|
|
|
|
|
|
|
|
 |
|
Big Chart | Large Data |
 |
|
Wholesale Trade (Adv) | Sales and Inventories |
|
Today's Week |
 |
|
|
|
|
|
|
|
|
|
|
|
|
|
| |
|
|
|
|
|
|
|
|
|
|
|
|
|
|
|
|
|
|
|
|
|
Slides | Five 5 |
|
|
Wholesale Trade (Adv) | Sales and Inventories |
|
Today's Week |
|
|
|
|
|
|
|
|
|
|
|
|
|
|
| |
|
|
|
|
|
|
|
|
|
|
|
|
|
|
|
|
|
|
|
|
|
Release Schedule | 2026 |
|
|
Wholesale Trade (Adv) | Sales and Inventories |
|
Today's Week |
|
|
|
|
|
|
|
|
|
|
|
|
|
Wholesale Trade Advance
(At 8:30 a.m ET)
| SCHEDULE 2026 |
No 1 |
No 2 |
No 3 |
No 4 |
No 5 |
No 6 |
No 7 |
No 8 |
No 9 |
No 10 |
No 11 |
No 12 |
| Release | Week |
|
|
|
|
|
|
|
|
|
|
|
|
| Release | Date |
|
|
|
|
|
|
|
|
|
|
|
|
| Release | Day |
|
|
|
|
|
|
|
|
|
|
|
|
 |
|
|
|
|
|
|
|
|
|
|
|
|
| Prior: |
... |
0.2% |
... |
... |
... |
... |
... |
... |
... |
... |
... |
... |
| Prior Revised: |
... |
... |
... |
.0.9% |
... |
... |
... |
... |
... |
... |
... |
... |
| CONSEDSNUS |
... |
0.2% |
... |
... |
... |
... |
... |
... |
... |
... |
... |
... |
| Consensus Low: |
... |
0.1% |
... |
... |
... |
... |
... |
... |
... |
... |
... |
... |
| Consensus High: |
... |
0.2% |
... |
... |
... |
... |
... |
... |
... |
... |
... |
... |
| ACTUAL LEVEL: |
0.2% |
... |
... |
1.4% |
... |
... |
... |
... |
... |
... |
... |
... |
| Month For: |
|
|
|
|
|
|
|
|
|
|
|
|
| RATING |
Dec-25 |
Jan-26 |
Feb-26 |
Mar-26 |
Apr-26 |
May-26 |
Jun-26 |
Jul-26 |
Aug-26 |
Sep-26 |
Oct-26 |
Nov-26 |
|
|
|
|
|
|
|
|
|
|
|
|
|
|
|
| |
|
| |
|
|
|
|
|
|
|
|
|
|
|
Release Schedule | 2025 |
|
|
Wholesale Trade (Adv) | Sales and Inventories |
|
Today's Week |
|
|
|
|
|
|
|
|
|
|
|
|
|
Wholesale Trade Advance
(At 8:30 a.m ET)
| SCHEDULE 2025 |
No 1 |
No 2 |
No 3 |
No 4 |
No 5 |
No 6 |
No 7 |
No 8 |
No 9 |
No 10 |
No 11 |
No 12 |
| Release | Week |
|
|
|
|
|
|
|
|
|
|
|
|
| Release | Date |
|
|
|
|
|
|
|
|
|
|
|
|
| Release | Day |
|
|
|
|
|
|
|
|
|
|
|
|
|
|
|
|
|
|
|
|
|
|
|
|
|
| Prior: |
-0.2% |
-0.5% |
0.7% |
0.3% |
0.5% |
0.0% |
-0.3% |
0.2% |
0.2% |
... |
... |
... |
| Prior Revised: |
-0.1% |
-0.4% |
0.8% |
0.5% |
0.3% |
0.1% |
0.1% |
0.1% |
0.0% |
... |
... |
... |
| CONSEDSNUS |
0.3% |
.. |
.. |
0.6% |
.. |
.. |
0.0% |
... |
0.1% |
... |
... |
... |
| Consensus Low: |
0.1% |
... |
... |
0.5% |
... |
... |
-0.1% |
... |
-0.1% |
... |
... |
... |
| Consensus High: |
0.4% |
... |
... |
0.7% |
... |
... |
0.2% |
... |
0.2% |
... |
... |
... |
| ACTUAL LEVEL: |
-0.5% |
0.7% |
0.3% |
0.5% |
0.0% |
-0.3% |
0.2% |
0.2% |
-0.2% |
... |
... |
... |
| Month For: |
|
|
|
|
|
|
|
|
|
|
|
|
| RATING |
Dec-24 |
Jan-25 |
Feb-25 |
Mar-25 |
Apr-25 |
May-25 |
Jun-25 |
Jul-25 |
Aug-25 |
Sep-25 |
Oct-25 |
Nov-25 |
|
|
|
|
|
|
|
|
|
|
|
|
|
|
|
| Note: The (Pre) is the most important one and contains the (Adv) or Flash |
|
| |
|
|
|
|
|
|
|
|
|
|
|
Release Schedule | 2024 |
|
|
Wholesale Trade (Adv) | Sales and Inventories |
|
Today's Week |
|
|
|
|
|
|
|
|
|
|
|
|
|
Wholesale Trade Advance
(At 8:30 a.m ET)
| SCHEDULE 2024 |
No 1 |
No 2 |
No 3 |
No 4 |
No 5 |
No 6 |
No 7 |
No 8 |
No 9 |
No 10 |
No 11 |
No 12 |
| Released Week: |
|
|
|
|
|
|
|
|
|
|
|
|
| Released Date: |
|
|
|
|
|
|
|
|
|
|
|
|
| Released Day: |
|
|
|
|
|
|
|
|
|
|
|
|
| Prior: |
-0.2% |
0.4% |
-0.1% |
0.5% |
-0.4% |
0.2% |
0.6% |
0.2% |
0.3% |
0.3% |
-0.1% |
0.2% |
| Prior Revised: |
-0.4% |
... |
-0.2% |
0.4% |
... |
... |
... |
0.1% |
... |
... |
-0.2% |
0.1% |
| Consensus: |
-0.2% |
0.1% |
0.2% |
0.3% |
-0.1% |
0.3% |
0.2% |
... |
0.2% |
0.1% |
0.0% |
0.1% |
| Consensus Low: |
-0.3% |
0.0% |
0.1% |
0.2% |
-0.1% |
0.1% |
0.1% |
... |
0.1% |
0.0% |
0.0% |
0.1% |
| Consensus High: |
-0.2% |
0.2% |
0.2% |
0.5% |
-0.1% |
0.3% |
0.3% |
... |
0.2% |
0.2% |
0.0% |
0.2% |
| ACTUAL LEVEL: |
0.4% |
-0.1% |
0.5% |
-0.4% |
0.2% |
0.6% |
0.2% |
0.3% |
0.2% |
-0.1% |
0.2% |
-0.2% |
| Month For: |
|
|
|
|
|
|
|
|
|
|
|
|
| RATING |
Dec-23 |
Jan-24 |
Feb-24 |
Mar-24 |
Apr-24 |
May-24 |
Jun-24 |
Jul-24 |
Aug-24 |
Sep-24 |
Oct-24 |
Nov-24 |
|
|
|
|
|
|
|
|
|
|
|
|
|
|
|
| |
|
| |
|
|
|
|
|
|
|
|
|
|
|
Release Schedule | 2023 |
|
|
Wholesale Trade (Adv) | Sales and Inventories |
|
Today's Week |
|
|
|
|
|
|
|
|
|
|
|
|
|
Wholesale Trade Advance
(At 8:30 a.m ET)
| SCHEDULE 2023 |
No 1 |
No 2 |
No 3 |
No 4 |
No 5 |
No 6 |
No 7 |
No 8 |
No 9 |
No 10 |
No 11 |
No 12 |
| Released Week: |
|
|
|
|
|
|
|
|
|
|
|
|
| Released Date: |
|
|
|
|
|
|
|
|
|
|
|
|
| Released Day: |
|
|
|
|
|
|
|
|
|
|
|
|
| Prior: |
1.0% |
0.1% |
-0.4% |
0.2% |
0.1% |
-0.2% |
-0.1% |
-0.3% |
-0.1% |
-0.1% |
0.0% |
-0.2% |
| Prior Revised: |
0.9% |
... |
-0.5% |
0.1% |
0.1% |
-0.3% |
-0.3% |
-0.7% |
-0.2% |
... |
0.1% |
-0.3% |
| Consensus: |
0.5% |
0.0% |
-0.2% |
0.2% |
-0.3% |
0.0% |
0.1% |
... |
-0.1% |
0.1% |
0.2% |
-0.2% |
| Consensus Low: |
0.4% |
-0.1% |
-0.2% |
0.0% |
... |
-0.2% |
-0.1% |
... |
-0.2% |
-0.1% |
0.1% |
-0.2% |
| Consensus High: |
0.8% |
0.1% |
-0.1% |
0.3% |
... |
0.1% |
0.1% |
... |
-0.1% |
0.1% |
0.2% |
-0.2% |
| ACTUAL LEVEL: |
0.1% |
-0.4% |
0.2% |
0.1% |
-0.2% |
-0.1% |
-0.3% |
-0.1% |
-0.1% |
0.0% |
-0.2% |
-0.2% |
| Month For: |
|
|
|
|
|
|
|
|
|
|
|
|
| RATING |
Dec 22 |
Jan-23 |
Feb-23 |
Mar-23 |
Apr-23 |
May-23 |
Jun-23 |
Jul-23 |
Aug-23 |
Sep-23 |
Oct-23 |
Nov-23 |
|
|
|
|
|
|
|
|
|
|
|
|
|
|
|
| |
|
| |
|
|
|
|
|
|
|
|
|
|
|
Release Schedule | 2022 |
|
|
Wholesale Trade (Adv) | Sales and Inventories |
|
Today's Week |
|
|
|
|
|
|
|
|
|
|
|
|
|
Wholesale Trade Advance
(At 8:30 a.m ET)
| SCHEDULE 2022 |
No 1 |
No 2 |
No 3 |
No 4 |
No 5 |
No 6 |
No 7 |
No 8 |
No 9 |
No 10 |
No 11 |
No 12 |
| Released Week: |
|
|
|
|
|
|
|
|
|
|
|
|
| Released Date: |
|
|
|
|
|
|
|
|
|
|
|
|
| Released Day: |
|
|
|
|
|
|
|
|
|
|
|
|
| Prior: |
1.2% |
2.1% |
0.8% |
2.1% |
2.3% |
2.1% |
2.0% |
1.9% |
0.8% |
1.3% |
0.8% |
0.8% |
| Prior Revised: |
1.7% |
2.3% |
1.1% |
2.6% |
2.7% |
2.3% |
... |
1.9% |
0.6% |
1.4% |
0.6% |
0.5% |
| Consensus: |
1.3% |
1.9% |
0.7% |
1.4% |
2.0% |
2.1.% |
... |
1.3% |
0.4% |
1.1% |
0.5% |
0.6% |
| Consensus Low: |
0.4% |
1.0% |
0.4% |
0.8% |
... |
1.9% |
... |
1.3% |
0.3% |
0.9% |
0.5% |
0.3% |
| Consensus High: |
1.4% |
2.0% |
1.5% |
1.8% |
... |
2.1% |
... |
1.4% |
0.6% |
1.1% |
0.5% |
0.4% |
| ACTUAL LEVEL: |
2.1% |
0.8% |
2.1% |
2.3% |
2.1% |
2.0% |
1.9% |
0.8% |
1.3% |
0.8% |
0.8% |
1.0% |
| Month For: |
|
|
|
|
|
|
|
|
|
|
|
|
| RATING |
Dec 21 |
Jan-22 |
Feb-22 |
Mar-22 |
Apr-22 |
May-22 |
Jun-22 |
Jul-22 |
Aug-22 |
Sep-22 |
Oct-22 |
Nov-22 |
|
|
|
|
|
|
|
|
|
|
|
|
|
|
|
| |
|
| |
|
|
|
|
|
|
|
|
|
|
|
Release Schedule | 2021 |
|
|
Wholesale Trade (Adv) | Sales and Inventories |
|
Today's Week |
|
|
|
|
|
|
|
|
|
|
|
|
|
Wholesale Trade Advance
(At 8:30 a.m ET)
| SCHEDULE 2021 |
No 1 |
No 2 |
No 3 |
No 4 |
No 5 |
No 6 |
No 7 |
No 8 |
No 9 |
No 10 |
No 11 |
No 12 |
| Released Week: |
|
|
|
|
|
|
|
|
|
|
|
|
| Released Date: |
|
|
|
|
|
|
|
|
|
|
|
|
| Released Day: |
|
|
|
|
|
|
|
|
|
|
|
|
| Prior: |
-0.1% |
0.1% |
1.3% |
0.5% |
1.4% |
0.8% |
1.1% |
0.8% |
0.6% |
1.2% |
1.1% |
2.2% |
| Prior Revised: |
... |
... |
... |
0.9% |
... |
1.9% |
... |
... |
... |
... |
1.4% |
2.5% |
| Consensus: |
0.1% |
0.1% |
0.3% |
0.6% |
... |
0.4% |
... |
... |
... |
... |
0.8% |
1.6% |
| Consensus Low: |
0.1% |
0.1% |
0.1% |
0.1% |
... |
0.1% |
... |
... |
... |
... |
0.2% |
0.6% |
| Consensus High: |
0.2% |
0.2% |
0.4% |
0.7% |
... |
0.8% |
... |
... |
... |
... |
1.0% |
2.3% |
| ACTUAL LEVEL: |
0.1% |
1.3% |
0.5% |
1.4% |
0.8% |
1.1% |
0.8% |
0.6% |
1.2% |
1.1% |
2.2% |
1.2% |
| Month For: |
|
|
|
|
|
|
|
|
|
|
|
|
| RATING |
Dec 20 |
Jan-21 |
Feb-21 |
Mar-21 |
Apr-21 |
May-21 |
Jun-21 |
Jul-21 |
Aug-21 |
Sep-21 |
Oct-21 |
Nov-21 |
|
|
|
|
|
|
|
|
|
|
|
|
|
|
|
| |
|
|
| |
|
|
|
|
|
|
|
|
|
|
|
|
|
|
|
|
|
|
|
|
|
Brief News | 2026 |
|
|
Wholesale Trade (Adv) | Sales and Inventories |
|
Today's Week |
|
|
|
|
|
|
|
|
|
|
|
|
|
Wholesale Trade Advance
(At 8:30 a.m ET)
| DATE/WEEK |
HIGHLIGHTS |
FOR |
Y/Y |
|
Wholesale Trade |
No 12 |
... |
|
Nov-2025 |
|
| |
|
|
|
Wholesale Trade |
No 11 |
... |
|
Oct-2025 |
|
| |
|
|
|
Wholesale Trade |
No 10 |
... |
|
Sep-2025 |
|
| |
|
|
|
Wholesale Trade |
No 9 |
... |
|
Aug-2025 |
|
| |
|
|
|
Wholesale Trade |
No 8 |
... |
|
Jul-2025 |
|
| |
|
|
|
Wholesale Trade |
No 7 |
... |
|
Jun-2025 |
|
| |
|
|
|
Wholesale Trade |
No 6 |
... |
|
May-2025 |
|
| |
|
|
|
Wholesale Trade |
No 5 |
... |
|
Apr-2025 |
|
| |
|
|
|
Wholesale Trade |
No 4 |
... |
|
Mar-2025 |
|
| |
|
|
|
Wholesale Trade |
No 3 |
... |
|
Feb-2025 |
|
| |
|
|
|
Wholesale Trade |
No 2 |
... |
|
Jan-2025 |
|
| |
|
|
|
Wholesale Trade |
No 1 |
... |
|
Dec-2024 |
|
| |
|
|
|
|
|
|
|
|
| |
|
|
|
|
|
| |
|
|
|
|
|
|
|
|
|
|
|
|
|
|
|
Brief News | 2025 |
|
|
Wholesale Trade (Adv) | Sales and Inventories |
|
Today's Week |
|
|
|
|
|
|
|
|
|
|
|
|
|
Wholesale Trade Advance
(At 8:30 a.m ET)
| DATE/WEEK |
HIGHLIGHTS |
FOR |
Y/Y |
|
Retail Sales |
No 12 |
... |
|
Nov-2025 |
|
| |
|
|
|
Retail Sales |
No 11 |
... |
|
Oct-2025 |
|
| |
|
|
|
Retail Sales |
No 10 |
|
|
Sep-2025 |
|
| |
|
|
|
On September 25, 2025, the U.S. Census.gov released data showing that advance wholesale inventories for August 2025 decreased by 0.2% from July to $905.2 billion, and were up 0.7% from August 2024. The month-over-month decline was larger than the initial forecast of a 0.1% increase and was driven by a 0.6% drop in non-durable goods inventories, as durable goods inventories remained flat. |
No 9 |
-0.2% |
|
Aug-2025 |
|
| |
|
|
|
On August 29, 2025, the U.S. Census Bureau released its advance statistics for July 2025 wholesale inventories, which rose 0.2% month-over-month to $908.4 billion, meeting expectations and showing an acceleration from the prior month's growth. This increase was a result of both durable and non-durable goods inventories rising by 0.2% each, and it represented a 1.3% increase compared to July 2024. |
No 8 |
0.2% |
|
Jul-2025 |
|
| |
|
|
|
For the period ending in July 2025, U.S. wholesale inventories were reported by the U.S. Census Bureau to have risen by 0.2% from the previous month. |
No 7 |
0.2% |
|
Jun-2025 |
|
| |
|
|
|
U.S. wholesale inventories in May 2025 had fallen by 0.3%. On June 26, 2025, US Wholesale Inventories unexpectedly dropped by 0.3% for the May 2025 period, a figure that was anticipated to be 0.2% according to preliminary forecasts, showing a slight decline instead of the expected increase. |
No 6 |
-0.3% |
|
May-2025 |
|
| |
|
|
|
The initial report on wholesale inventories for April shows no change from March and a smaller revised increase of 0.3 percent for March compared with the 0.4 percent increase in the preliminary report. Wholesale inventories rose 2.1 percent from a year ago. Within the report for April, durable goods inventories were down 0.2 percent and non-durables up 0.4 percent. On the year, durables inventories gained 0.9 percent and non-durables increased 4.4 percent. |
No 5 |
0.0% |
|
Apr-2025 |
|
| |
|
|
|
On April 29, 2025, the US Census Bureau released its advance report for March 2025 wholesale inventories, showing a monthly increase of 0.5%, which was below economists' forecasts of 0.6% to 0.7%. The total value of U.S. wholesale inventories at the end of March was $908 billion, marking a 0.5% rise from February and a 2.3% increase year-over-year. |
No 4 |
0.5% |
|
Mar-2025 |
|
| |
|
|
|
For the 27th of March 2025, wholesale inventories in the United States increased by 0.3 percent, according to the advance estimate released on that date. This followed a preliminary 0.7 percent increase for February 2025. A final report from the Census Bureau shows total merchant wholesaler inventories increased by a revised 0.4 percent from February to March 2025. The advance wholesale inventories report shows an increase of 0.3 percent for February from January. Durable goods inventories rose 0.3 percent on the month while nondurables were up 0.5 percent. |
No 3 |
0.3% |
|
Feb-2025 |
|
| |
|
|
|
Wholesale inventories for January rose 0.7 percent on the month after December's revised 0.4 percent decline. Inventories of durables rose 0.8 percent with nondurables also up 0.6 percent. It was a reversal of the previous declining trend. This also represented the largest increase in over a year and exceeded expectations. |
No 2 |
0.7% |
|
Jan-2025 |
|
| |
|
|
|
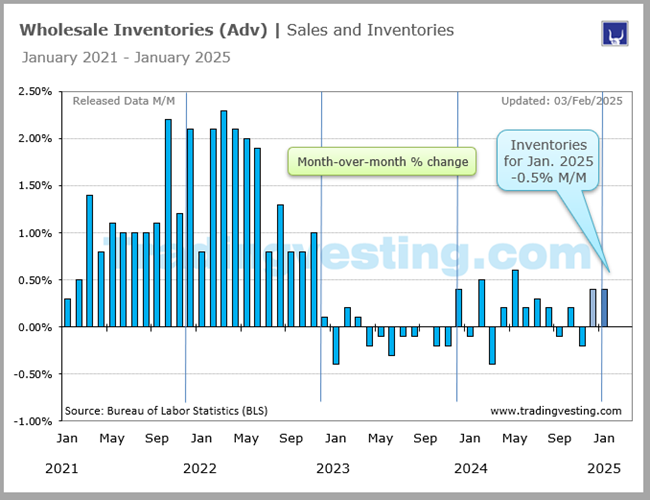
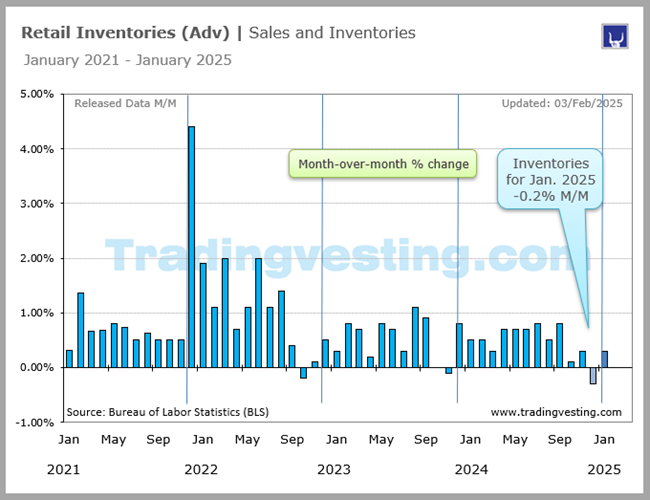
Wholesale inventories fell 0.5% while stocks at retailers declined 0.3% last month. Wholesale inventories for December fell 0.5 percent on the month after November's revised 0.1 percent decline. This is a steeper decline than the consensus. Inventories of durables fell 0.5 percent with nondurables also down 0.3 percent. The consensus looks for an increase of 0.3 percent. |
No 1 |
-0.5% |
|
Dec-2024 |
|
| |
|
|
|
|
|
|
|
|
| |
|
|
|
|
|
| |
|
|
|
|
|
|
|
|
|
|
|
|
|
|
|
Brief News | 2024 |
|
|
Wholesale Trade (Adv) | Sales and Inventories |
|
Today's Week |
|
|
|
|
|
|
|
|
|
|
|
|
|
Wholesale Trade Advance
(At 8:30 a.m ET)
| DATE/WEEK |
HIGHLIGHTS |
FOR |
Y/Y |
|
In a surprising turn, US Wholesale Inventories have recorded a decrease, according to the latest economic data. The actual number has come in at -0.2%, a significant shift from the forecasted 0.1% increase. This unexpected drop indicates a lower value of goods held in inventory by wholesalers, a key economic indicator. The forecast had predicted a slight increase, continuing the previous trend where wholesale inventories rose by 0.2%. However, the actual figure has not only missed the forecast but also posted a negative growth, marking a stark contrast to the previous month's performance. |
No 12 |
-0.2% |
|
Nov-2024 |
|
| |
|
|
|
Wholesale inventories for October rose 0.2 percent on the month, up from September's 0.2 percent decline. Inventories of durables rose 0.1 percent with nondurables up 0.4 percent. Market Consensus Before Announcement. No change on the month is the call for wholesale inventories in the advance report. |
No 11 |
0.2% |
|
Oct-2024 |
|
| |
|
|
|
In September 2024, the dollar value of U.S. wholesale inventories, adjusted for seasonal changes, decreased by 0.1%. In late October 2024, US wholesale inventories were estimated to have risen by 0.2% from the previous month, following a 0.2% decline in September. This small increase occurred with a slight drop in wholesale sales, leading to the inventories/sales ratio remaining unchanged at 1.34 |
No 10 |
|
|
Sep-2024 |
|
| |
|
|
|
Wholesale inventories for August rose 0.2 percent on the month, down from July's 0.3 percent rise. Inventories of durables rose 0.3 percent with nondurables steady at 0.0 percent. Market Consensus Before Announcement: Wholesale inventories are seen rising 0.2 percent in August following July's 0.3 percent increase. Wholesale inventories measure the monthly dollar value of inventories held by merchant wholesalers and are tracked to gauge inventory change in quarterly GDP. The advance report is released late in the month for the following month. |
No 9 |
0.2% |
|
Aug-2024 |
|
| |
|
|
|
U.S. wholesale inventories increased by 0.3% in July 2024. According to Commerce Department data released Thursday, wholesale inventories in the U.S. rose by 0.3% in July compared to the previous month. The figure, which measures the change in the total value of goods held in inventory by wholesalers, was estimated at $904.9 billion, according to the advance figures. The figure for June was revised down from $903.3 billion to $901.9 billion, or from an increase of 0.2% to a gain of 0.1%, the agency said in a statement. Annually, wholesale inventories in July were up 0.6%, compared to the same month in 20 |
No 8 |
0.3% |
|
Jul-2024 |
|
| |
|
|
|
Wholesale inventories rise 0.2%; retail stocks up 0.7%. Some of the imports in June likely ended up in the warehouses of wholesalers and retailers. The report from the Census Bureau also showed wholesale inventories increased 0.2% in June after rising 0.6% in May. Retail inventories climbed 0.7%, boosted by a 1.8% gain in stocks at motor vehicles and parts dealers. Retail inventories advanced 0.6% in May. Excluding motor vehicles and parts, retail inventories gained 0.2% in June after dipping 0.1% in May. This category goes into the calculation of GDP. Business inventories are estimated to have added roughly 1.5 percentage points to GDP growth last quarter after subtracting from growth for two straight quarters. Both trade and inventory investment subtracted from GDP in the first quarter, with the economy growing at a 1.4% pace during that period. Economists expect the trade gap to remain large, with businesses, wary of new tariffs on foreign goods, front-loading imports ahead of the Nov. 5 presidential election. |
No 7 |
0.2% |
|
Jun-2024 |
|
| |
|
|
|
Wholesale inventories jumped 0.6 percent in May and follow a 0.2 percent rise in April. May's build was balanced between a 0.5 percent gain for durable goods and a 0.6 percent rise for nondurable goods. This report together with a sharp build for retail inventories also reported this morning are, for second-quarter GDP, offsets to the widening US trade deficit and what have been weakness in recent retail sales data. Market Consensus Before Announcement. Wholesale inventories are expected to increase 0.3 percent in the advance report for May that would follow a 0.1 percent rise in April. |
No 6 |
0.6% |
|
May-2024 |
|
| |
|
|
|
Wholesale inventories rose 0.2 percent in April which together with a 0.7 percent build for April's retail inventories get the second-quarter inventory component of GDP off to a favorable start. The build on the wholesale side was centered in durable goods which offset a draw for nondurables. Market Consensus Before Announcement: Wholesale inventories are expected to decrease 0.1 percent in the advance report for April that would follow a 0.4 percent draw in March. |
No 5 |
0.2% |
|
Apr-2024 |
|
| |
|
|
|
A significant factor pulling down first-quarter GDP, inventories for March showed contraction for wholesale inventories and a slowing build for retail. Wholesale inventories fell 0.4 percent on the month to reverse February's 0.4 percent gain, while inventories for retailers rose 0.3 percent which was down from February's 0.5 percent build. Details for wholesalers show no change for durable goods in March that followed a 0.9 percent February build. Inventories for nondurable goods fell 1.1 percent on top of February's 0.4 percent decline. Market Consensus Before Announcement: Wholesale inventories are expected to increase 0.3 percent in the advance report for March that would follow a sharp 0.5 percent build in February. |
No 4 |
-0.4% |
|
Mar-2024 |
|
| |
|
|
|
Wholesale inventories rose a sizable 0.5 percent in February which is well above Econoday's consensus for 0.2 percent. In only a partial offset, the build follows a marginal downward revision in January to a 0.2 percent draw . Details in the advance report are limited to the split between durable and non-durable goods, with the former up 1.0 percent in February and the latter down 0.4 percent. This report together with a 0.5 percent monthly build at retailers also reported this morning point to a positive inventory contribution to first-quarter GDP that would follow a negative contribution in the fourth quarter (a half percentage point). Market Consensus Before Announcement: Wholesale inventories are expected to increase 0.2 percent in the advance report for February that would follow a 0.1 percent draw in January. |
No 3 |
0.5% |
|
Feb-2024 |
|
| |
|
|
|
The first estimate for wholesale inventories is down 0.1 percent in January, well down from a 0.4 percent build in December to get first-quarter inventories off to a slow start. January's decline reflects a 0.9 percent draw for nondurable goods that offset a 0.4 percent build for durables. Market Consensus Before Announcement: Wholesale inventories are expected to increase 0.1 percent in the advance report for January that would follow a 0.4 percent rise in December. |
No 2 |
-0.1% |
|
Jan-2024 |
|
| |
|
|
|
hThe U.S. Census Bureau announced the following international trade, wholesale inventories, and retail inventories advance statistics for December 2023: table The international trade deficit was $88.5 billion in December, down $0.9 billion from $89.3 billion in November. Exports of goods for December were $169.8 billion, $4.1 billion more than November exports. Imports of goods for December were $258.3 billion, $3.2 billion more than November importsWholesale inventories for December, adjusted for seasonal variations and trading day differences, but not for price changes, were estimated at an end-of-month level of $897.7 billion, up 0.4 percent (±0.4 percent)* from November 2023, and were down 2.7 percent (±1.1 percent) from December 2022. The October 2023 to November 2023percentage change was revised from down 0.2 percent (±0.4 percent)* to down 0.4 percent (±0.4 percent). Advance Retail Inventories Retail inventories for December, adjusted for seasonal variations and trading day differences, but not for price changes, were estimated at an end-of-month level of $803.3 billion, up 0.8 percent (±0.2 percent) from Noveme |
No 1 |
0.4% |
|
Dec-2023 |
|
| |
|
|
|
|
|
|
|
|
| |
|
|
|
|
|
| |
|
|
|
|
|
|
|
|
|
|
|
|
|
|
|
Brief News | 2023 |
|
|
Wholesale Trade (Adv) | Sales and Inventories |
|
Today's Week |
|
|
|
|
|
|
|
|
|
|
|
|
|
Wholesale Trade Advance
(At 8:30 a.m ET)
| DATE/WEEK |
HIGHLIGHTS |
FOR |
ACTUAL |
|
Advance Wholesale Inventories. Wholesale inventories for November, adjusted for seasonal variations and trading day differences, but not for price changes, were estimated at an end-of-month level of $895.7 billion, down 0.2% from October 2023, and were down 3.1% from November 2022. The September 2023 to October 2023 percentage change was revised from down 0.4% to down 0.3%. |
No 12 |
-0.2% |
|
Nov-2023 |
|
| |
|
|
|
Extending a run of flat showings, wholesale inventories fell 0.2 percent in October following a revised 0.1 percent rise in September. Year-over-year, wholesale inventories were down 2.0 percent compared to October last year. October's results together with no change for retail inventories get inventories off to a slow start for fourth quarter GDP. Market Consensus Before Announcement: Wholesale inventories are expected to increase 0.2 percent in the advance report for October that would follow a 0.2 percent rise in September. |
No 11 |
-0.2% |
|
Oct-2023 |
|
| |
|
|
|
Wholesale inventories were unchanged in September overall and unchanged for both durable and nondurable goods. This follows a 0.1 percent draw in August to extend a run of flat readings at the wholesale level. Year-over-year, September wholesale inventories were down 1.3 percent. Market Consensus Before Announcement. Wholesale inventories are expected to increase 0.1 percent in the advance report for September that would follow a 0.1 percent dip in August. |
No 10 |
|
|
Sep-2023 |
|
| |
|
|
|
US wholesale inventories fall 0.1% in August. Inventories down 0.9% on annual basis. US wholesale inventories decreased by 0.1% in August, compared to July, according to the Commerce Department's advanced figures released Friday. The figure, which measures the change in the total value of goods held in inventory by wholesalers, was at $901.2 billion at the end of August, it said in a statement. The market expectation for wholesale inventories was to show a gain of 0.1% last month. The figure for July was $901.9 billion, which was revised from a contraction of 0.1% to a decline of 0.2%. Annually, wholesale inventories in August were down 0.9%, compared to the same month last year. US August advanced wholesale inventories -0.1% versus -0.2% prior. US wholesale and retail inventories for August 2023. Advance Wholesale Inventories: Inventories vs $903.1 billion prior. Change from Augurst 2022 % vs +0.5% prior. |
No 9 |
-0.1% |
|
Aug-2023 |
|
| |
|
|
|
Wholesale inventories fell 0.1 percent in July which is a big improvement from June's downward revised 0.7 percent and a plus for the inventory component of second-quarter GDP. A 0.2 percent build for nondurable goods at the wholesale level was offset by a 0.3 percent draw for durable goods. |
No 8 |
-0.1% |
|
Jul-2023 |
|
| |
|
|
|
Wholesale inventories for June, adjusted for seasonal variations and trading day differences, but not for price changes, were estimated at an end-of-month level of $908.0 billion, down 0.3 percent (±0.2 percent) from May 2023, and were up 1.7 percent (±0.9 percent) from June 2022. |
No 7 |
-0.3% |
|
Jun-2023 |
|
| |
|
|
|
Wholesale inventories dip 0.1%; retail stocks rise 0.8%. The report also showed that retail inventories increased 0.8% last month after gaining 0.3% in April. Motor vehicle inventories shot up 2.9% following a 1.6% advance in the prior month. Excluding motor vehicles, retail inventories were unchanged after decreasing 0.3% in April. This component goes into the calculation of GDP. Wholesale inventories dipped 0.1% last month after dropping 0.3% in April. Private inventory investment rose at its slowest pace in 1-1/2 years in the first quarter, chopping off 2.10 percentage points from GDP growth in that period. |
No 6 |
-0.1% |
|
May-2023 |
|
| |
|
|
|
U.S. wholesale inventories fell a bit less in April than initially estimated, which could provide a lift to economic growth in the second quarter. The Commerce Department said on Thursday that wholesale inventories slipped 0.1% instead of falling 0.2% as previously reported last month. Stocks at wholesalers dropped 0.2% in March. Economists polled by Reuters had expected that inventories would be unrevised. Inventories are a key part of gross domestic product. They increased 6.3% on a year-on-year basis in April. |
No 5 |
-0.2% |
|
Apr-2023 |
|
| |
|
|
|
Advance Wholesale Inventories. Wholesale inventories for March, adjusted for seasonal variations and trading day differences, but not for price changes, were estimated at an end-of-month level of $919.9 billion, up 0.1 percent (±0.2 percent)* from February 2023, and were up 9.3 percent (±0.9 percent) from March 2022. The January 2023 to February 2023 percentage change was unrevised from the preliminary estimate of up 0.1 percent (±0.4 percent). |
No 4 |
0.1% |
|
Mar-2023 |
|
| |
|
|
|
US Wholesale Inventories Unexpectedly Increased in February. According to the preliminary data published by the Census Bureau, US wholesale inventories inched up 0.20% m-o-m in February to $920.30 billion, following a decline of 0.50% in the earlier month. Economists had anticipated a 0.10% decline in wholesale inventories. Retail inventories rose by 0.80%m-o-m in February to $747.30 billion, following an increase of 0.10% in the earlier month. On a y-o-y basis, retail inventories jumped 10.80% in February 2023. |
No 3 |
0.2% |
|
Feb-2023 |
|
| |
|
|
|
U.S. inventories are growing at twice the rate of sales. With demand remaining strong, middle market firms have been increasing their inventories during the current quarter, with just under a majority expecting to do so over the next six months, according to the RSM US Middle Market Business Index. Inventories are now growing at twice the rate of sales on a composite basis inside the manufacturing and trade ecosystems, according to composite data from the U.S. Census. The surge in inventories raises the possibility that firms will be caught with excess supplies just as demand begins to slow down this year. |
No 2 |
-0.4% |
|
Jan-2023 |
|
| |
|
|
|
Wholesale inventories rose only 0.1 percent in December as a 1.6 percent decline for nondurable goods offset a 1.2 percent rise for durables. These data track dollars not volumes suggesting that the decline for nondurables is related to price declines for energy-related products. Further details will be available in the second estimate for December wholesale trade on February 8. Market Consensus Before Announcement: Wholesale inventories are expected to increase 0.5 percent in the advance report for December that would follow a 1.0 percent build in November. |
No 1 |
0.1% |
|
Dec-2022 |
|
| |
|
|
|
|
|
|
|
|
| |
|
|
|
|
|
| |
|
|
|
|
|
|
|
|
|
|
|
|
|
|
|
Brief News | 2022 |
|
|
Wholesale Trade (Adv) | Sales and Inventories |
|
Today's Week |
|
|
|
|
|
|
|
|
|
|
|
|
|
Wholesale Trade Advance
(At 8:30 a.m ET)
| DATE/WEEK |
HIGHLIGHTS |
FOR |
ACTUAL |
|
US wholesale inventories grow more than expected in November. Wholesale inventories jump 21% on annual basis. Wholesale inventories in the US rose 1% in November to $933.6 billion, according to the Commerce Department data released on Tuesday. The figure, which measures the change in the total value of goods held in inventory by wholesalers, was expected to show an increase of 0.4% from the previous month. The 0.5% increase in November was revised to up to a 0.6% monthly gain. On an annual basis, wholesale inventories in November jumped 21% compared to the same month of last year. |
No 12 |
1.0% |
|
Nov-2022 |
|
| |
|
|
|
U.S. wholesale inventories increased less than initially thought in October, suggesting that businesses were carefully managing their inventory amid slowing demand. The Commerce Department said on Friday that wholesale inventories rose 0.5% instead of 0.8% as reported last month. Stocks at wholesalers increased 0.6% in September. Economists polled by Reuters had expected that inventories would be unrevised. Wholesale inventories increased 21.9% in October on a year-on-year basis. Inventories are a key part of gross domestic product. There were decreases in furniture, computer and professional equipment stocks. Wholesale motor vehicle inventories were unchanged after rising 1.4% in September. Wholesale inventories, excluding autos, increased 0.6% in October. This component goes into the calculation of GDP. Inventories have been a drag on GDP for two straight quarters, subtracting almost one percentage point in the third quarter. The economy grew at a 2.9% annualized rate last quarter after contracting in the first half of the year. |
No 11 |
0.8% |
|
Oct-2022 |
|
| |
|
|
|
U.S. wholesale inventories increased less than initially thought in September amid decreases in stocks of petroleum and computer equipment, also suggesting that businesses were carefully managing their inventory amid slowing demand. The Commerce Department said on Wednesday that wholesale inventories rose 0.6% instead of 0.8% as reported last month. Stocks at wholesalers advanced 1.4% in August. Economists polled by Reuters had expected that inventories would be unrevised. Wholesale inventories increased 24.1% in September on a year-on-year basis. Inventories are a key part of gross domestic product. Petroleum stocks fell 3.8% after rising 3.4% in August, while those of computers and electronic products slipped 0.5%. |
No 10 |
0.8% |
|
Sep-2022 |
|
| |
|
|
|
In August 2022, U.S. wholesale inventories increased by 1.3% (month-over-month) and 18.2% year-over-year, based on an advance report from the U.S. Census Bureau. This rise was slightly less than the 0.9% increase economists had forecast, with total business inventories rising 0.8% in August. The increase in inventories was driven by the accumulation of unsold goods, a trend caused by slowing demand due to high inflation and rising interest rates. |
No 9 |
1.3% |
|
Aug-2022 |
|
| |
|
|
|
U.S. wholesale inventories increased less than initially thought in July as businesses slowed the replenishment of their stocks. The Commerce Department said on Friday that wholesale inventories rose 0.6%, instead of 0.8% as reported last month. Stocks at wholesalers advanced 1.8% in June. Economists polled by Reuters had expected July inventories would be unrevised. Wholesale inventories increased 25.1% in July on a year-on-year basis. Inventories are a key component of gross domestic product. The U.S. economy unexpectedly contracted in the second quarter, at odds with a robust labor market. The decline largely reflected the hangover of excess inventory accumulation by businesses late last year, leaving stock to clear before more is ordered at a time when consumer spending has softened. Sales at wholesalers fell 1.4% in July after increasing 1.6% in June. At July's sales pace it would take wholesalers 1.29 months to clear shelves, up from 1.26 in June. |
No 8 |
0.8% |
|
Jul-2022 |
|
| |
|
|
|
U.S. wholesale inventories increased less than initially thought in June as businesses slowed the replenishment of their stocks as they continue to draw down on excess inventories amid softening consumer spending. The Commerce Department said on Wednesday that wholesale inventories rose 1.8%, instead of 1.9% as reported last month. Stocks at wholesalers advanced 1.9% in May. Economists polled by Reuters had expected June inventories would be unrevised. Wholesale inventories increased 25.5% in June on a year-on-year basis. Inventories are a key component of gross domestic product. |
No 7 |
1.9% |
|
Jun-2022 |
|
| |
|
|
|
In May 2022, U.S. wholesale inventories advanced by 2.0%, reaching an estimated $880.6 billion, a 2.0% increase from April 2022. This rise marked a 25.0% increase year-over-year, from May 2021 levels. The growth was at a somewhat softer pace compared to the previous three months, with durable and nondurable goods sectors contributing to the increase. |
No 6 |
2.0% |
|
May-2022 |
|
| |
|
|
|
U.S. wholesale inventories increased slightly more than initially thought in April, suggesting that inventory investment could provide a lift to economic growth this quarter. The rise in stocks reported by the Commerce Department on Wednesday, however, came as sales growth moderated. Inventories are being closely watched amid rising fears of a recession next year as the Federal Reserve raises interest rates to cool demand in its battle against high inflation. Major U.S. retailers, including Walmart (WMT.N), opens new tab and Target (TGT.N), opens new tab, said last month that they were carrying too much merchandise. Wholesale inventories advanced 2.2%, instead of 2.1% as reported last month. Data for March was revised higher to show stocks at wholesalers rising 2.7% instead of the previously reported 2.3%. Economists polled by Reuters had expected April inventories would be unrevised. Wholesale inventories increased 24.0% in April on a year-on-year basis. Inventories are a key part of gross domestic product. Wholesale motor vehicle inventories rose 1.3% after accelerating 2.4% in March. Wholesale apparel stocks surged 6.4% after rising 4.0% in March. |
No 5 |
2.1% |
|
Apr-2022 |
|
| |
|
|
|
Wholesale inventories in the U.S. showed another substantial increase in the month of March, according to a report released by the Commerce Department on Monday. The report showed wholesale inventories shot up by 2.3 percent in February after surging by an upwardly revised 2.8 percent in February. The spike in inventories matched the preliminary estimate as well as economist expectations. |
No 4 |
2.3% |
|
Mar-2022 |
|
| |
|
|
|
While businesses continued to replenish inventories in February 2022, the pace was less frantic than in the last months of 2021. Wholesale stocks increased 2.1% in February 2022 after climbing 1.1% in January 2022. Retail inventories increase 1.1%; wholesale up 2.1%. Inventory investment accelerated at a robust seasonally adjusted annualized rate of $171.2 billion in the fourth quarter, contributing 4.90 percentage points to the quarter's 7.0% growth pace. Despite February's rise, inventories are likely to be neutral to GDP growth this quarter as they would need to increase at a similarly fast rate as the fourth quarter to contribute to growth. First-quarter GDP growth estimates are mostly below a 1.0% pace. |
No 3 |
2.1% |
|
Feb-2022 |
|
| |
|
|
|
Wholesale Inventories (Advance): +0.8% to $798.2B vs. +1.3 consensus, -2.2% prior. Wholesale and retail inventories grew solidly in January 2022. The first month of 2022 saw wholesale inventories expand by 0.8% and retail stockpiles by 1.9%. Among wholesale categories, durable-goods inventories grew 1% while nondurable goods increased 0.5%. Excluding motor vehicles and parts, retail inventories grew 1.7%. For consecutive months, motor vehicle and parts dealers have posted a strong inventory build, growing 2.4% from December to January. |
No 2 |
0.8% |
|
Jan-2022 |
|
| |
|
|
|
US advanced wholesale inventories for December 2021 2.1% versus 1.3% estimate. The US preliminary wholesale inventories for December 2021. Prior was 1.4% revised to 1.7. Wholesale inventories come in stronger at 2.1% vs estimate of 1.3% wholesale inventories YoY are up 18.3% from December 2020 retail inventories rose 4.4% and were up 3.8% from December 2020. The prior month was revised at up 2.0%. Retail inventories excluding autos +3.6%. Wholesale inventories have been up for 17 consecutive months as inventory replenishment continues post the pandemic. |
No 1 |
2.1% |
|
Dec-2021 |
|
| |
|
|
|
|
|
|
|
|
| |
|
|
|
|
|
| |
|
|
|
|
|
|
|
|
|
|
|
|
|
|
|
Brief News | 2021 |
|
|
Wholesale Trade (Adv) | Sales and Inventories |
|
Today's Week |
|
|
|
|
|
|
|
|
|
|
|
|
|
Wholesale Trade (Adv) | Sales & Inventories
| DATE/WEEK |
HIGHLIGHTS |
FOR |
ACTUAL |
|
The so-called Advance Indicators report also showed wholesale inventories climbed 1.2% last month, while retail inventories increased 2.0%. Retail inventories, excluding autos, which go into the calculation of gross domestic product, edged up by 1.3% to $465.2 billion, the latest in a string of record-high readings. |
No 12 |
1.2% |
|
Nov-2021 |
|
| |
|
|
|
An advance of the wholesale inventories in USA for October lower than earlier predictions, indicating that businesses precisely controlled inventory flanked by retreated demand. U.S. wholesale inventories increased a bit more than initially thought in October, suggesting that the restocking of warehouses could again support economic growth this quarter. The Commerce Department said on Thursday that wholesale inventories accelerated 2.3%, instead of 2.2% as estimated last month. Stocks at wholesalers increased 1.4% in September. Economists polled by Reuters had expected inventories would be unrevised. Wholesale inventories jumped 14.4% in October from a year earlier. Inventories are a key part of gross domestic product. Wholesale inventories, excluding autos, advanced 2.3% in October. This component goes into the calculation of GDP. |
No 11 |
2.2% |
|
Oct-2021 |
|
| |
|
|
|
Inventories were depleted in the first half of the year. Economists believe the pace of decline lessened in the third quarter, accounting for the bulk of expected GDP growth. Trade has been a drag on GDP growth for a year, while inventories have subtracted from output for two straight quarters. |
No 10 |
1.1% |
|
Sep-2021 |
|
| |
|
|
|
US wholesale sales in August increased 0.1% to US$698.0B from revised July level, up 16.1% from revised August 2021 level; inventories rose 1.3% in August to US$912.6B, up 25.0% year-over-year: Dept. of Commerce |
No 9 |
1.2% |
|
Aug-2021 |
|
| |
|
|
|
Advance Wholesale Inventories. Wholesale inventories for July 2021, adjusted for seasonal variations and trading day differences, but not for price changes, were estimated at an end-of-month level of $722.5 billion, up 0.6 percent (±0.4 percent) from June 2021, and were up 11.5 percent (±1.4 percent) from July 2020. The May 2021 to June 2021 percentage change was revised from up 1.1 percent (±0.2 percent) to up 1.2 percent (±0.2 percent). |
No 8 |
0.6% |
|
Jul-2021 |
|
| |
|
|
|
US wholesale inventory is for June 2021 0.8% versus 1.2% estimate. US wholesale and retail inventories for June 2021 wholesale inventory for June rose 0.8%. The expectations was for a rise of 1.2%. Versus a year ago, wholesale inventories were up 10.2%. The prior month increased by 1.3% which was unchanged. wholesale inventories totaled $715 billion. retail inventories were up 0.3% from May 2021 and up 3.7% from a year ago. The prior month remained unchanged at +0.8%. advanced retail inventories totaled $600 billion |
No 7 |
0.8% |
|
Jun-2021 |
|
| |
|
|
|
The May 2021 advance wholesale inventories, adjusted for seasonal variations but not for price changes, were estimated at an end-of-month level of $707.5 billion, this represents a 1.1% (±0.2%) increase from April 2021 and a 7.8% (±1.2%) rise relative to May 2020. The percentage change from March 2021 to April 2021 was amended from up 0.8% (±0.4%) to up 1.0% (±0.4%). |
No 6 |
1.1% |
|
May-2021 |
|
| |
|
|
|
Advance Wholesale Inventories. Wholesale inventories for April 2021, adjusted for seasonal variations and trading day differences, but not for price changes, were estimated at an end-of-month level of $698.3 billion, up 0.8 percent (±0.4 percent) from March 2021, and were up 5.2 percent (±1.4 percent) from April 2020. The February 2021 to March 2021 percentage change was revised from up 1.3 percent (±0.4 percent) to up 1.1 percent (±0.4 percent). |
No 5 |
0.8% |
|
Apr-2021 |
|
| |
|
|
|
March advance wholesale inventories sees post-Covid surge while retail inventories drop. The Census Bureau on Wednesday released numbers that showed wholesale inventories rose 1.4% from February 2021 o March 2021. Wholesalers are basically the middle step in the retail supply chain. They buy goods from manufacturers that they’re hoping to sell to retailers. “So they’re speculating on the future,” said Tim Fiore, with the Institute for Supply Management. “So wholesale inventory growth is absolutely an optimistic indicator.” It is optimistic because wholesalers believe consumers are going to be spending more. And that’s already starting to happen, according to Wells Fargo senior economist Sarah House: “Products are just flying off the shelves as soon as retailers can get their hands on them.” House said that’s a sign the economy has plenty of room to grow. “Sales could be even better if we could actually get our hands on the supplies and products that consumers and businesses want.” |
No 4 |
1.4% |
|
Mar-2021 |
|
| |
|
|
|
Advance Wholesale Inventories. Wholesale inventories for February 2021, adjusted for seasonal variations and trading day differences, but not for price changes, were estimated at an end-of-month level of $681.1 billion, up 0.5 percent (±0.4 percent) from January 2021, and were up 1.8 percent (±1.1 percent) from February 2020. The December 2020 to January 2021 percentage change was unrevised at up 1.4 percent (±0.9 percent). |
No 3 |
0.5% |
|
Feb-2021 |
|
| |
|
|
|
Advance Wholesale Inventories. Wholesale inventories for January 2021, adjusted for seasonal variations but not for price changes, were estimated at an end-of-month level of $661.6 billion, up 1.3 percent (±0.4 percent) from December 2020, and were up 0.5 percent (±0.7 percent) from January 2020. The November 2020 to December 2020 percentage change was revised from up 0.3 percent (±0.4 percent) to up 0.5 percent (±0.4 percent). |
No 2 |
1.3% |
|
Jan-2021 |
|
| |
|
|
|
Advance Wholesale Inventories. Wholesale inventories for December 2020, adjusted for seasonal variations but not for price changes, were estimated at an end-of-month level of $650.4 billion, up 0.1 percent (±0.4 percent)* from November 2020, and were down 1.8 percent (±0.9 percent) from December 2019. The October 2020 to November 2020 percentage change was unrevised from the preliminary estimate of virtually unchanged (±0.2 percent). |
No 1 |
0.1% |
|
Dec-2020 |
|
| |
|
|
|
|
|
|
|
|
| |
|
|
|
|
|
|
| |
|
|
|
|
|
|
|
|
|
|
|
|
|
|
|
|
|
|
|
|
|
Definitions | Explain |
|
|
Wholesale Trade (Adv) | Sales and Inventories |
|
Today's Week |
|
|
|
|
|
|
|
|
|
|
|
|
| |
|
|
|
|
| |
|
| WHOLESALE TRADE |
Wholesale Inventories
Wholesale inventories measure the monthly dollar value of inventories held by merchant wholesalers and are tracked to gauge inventory change in quarterly GDP. The advance report is released late in the month for the following month and is part of the Monthly Advance Economic Indicators report (which also includes data on retail inventories and international trade in goods). Final monthly data for wholesale inventories are released about two weeks later with the Wholesale Trade report which also includes initial monthly data on wholesale sales.
Higher inventories add to gross domestic product, the official scorecard of the U.S. economy. The increase in inventories is likely to spur Wall Street economists to raise first-quarter GDP forecasts
|
|
|
| |
|
|
|
|
|
|
|
|
|
|
|
|
|
|
|
|
|
|
|
|
|
Data | Source |
|
|
Wholesale Trade (Adv) | Sales and Inventories |
|
Today's Week |
|
|
|
|
|
|
|
|
|
|
|
|
| |
|
|
|
|
|
|
| DATA INFORMATION |
WHOLESALE TRADE ADV |
| SOURCE |
Bureau of the Census, U.S. Department of Commerce. |
| WEB |
www.census.gov |
| FREQUENCY |
Monthly |
| AVAILABILITY |
Mid-month |
| COVERAGE |
Data are for the previous month. Data for June are released in July. |
| REVISIONS |
Yes |
| IMPORTANCE |
Sales and Inventories - Very Important |
|
| |
|
|
|
|
|
|
|
|
|
|
|
|