10-Year Treasury Yield
U.S. Treasury yields were lower on Thursday as investors reacted to a number of labor market data releases Thursday that revealed more signs of weakness. The 10-year Treasury yield dropped 8 basis points to 4.198%, and the 30-year Treasury yield was more than 6 basis points lower at 4.852%. The 2-year Treasury note yield was down more than 9 basis points at 3.467%. News
PMI Mfg Index
The S&P Global US Manufacturing PMI increased to 52.4 in January 2026, above the preliminary estimate of 51.9 and up from December’s five-month low of 51.8. The latest reading points to a firmer pace of expansion in manufacturing activity, broadly in line with the survey’s long-run average. Output rose sharply, marking the strongest increase since last August and the joint-fastest pace since May 20.
ISM Mfg Index
U.S. factory activity grew for the first time in a year in January as businesses placed new orders after the holiday season, but the improvement was likely temporary, with manufacturers still complaining about the uncertainty wrought by a fluid trade polic. Respondents in the Institute for Supply Management survey on Monday were markedly more downbeat than optimistic. Some survey respondents noted the emergence of what they called an anti-American buyer sentiment while others said the Trump administration's policies had made it difficult to plan ahead.
US Dollar Index
The U.S. dollar's recent recovery will be short-lived, holding steady before resuming a broader decline later in the year, a Reuters survey of currency strategists showed, as markets cling to interest rate cut expectations amid concerns about the Federal Reserve’s independence. The dollar has fallen nearly 11% since U.S. President Donald Trump took office a little over a year ago, with his repeated calls for much lower interest rates and his recent expression of indifference to a weaker dollar accelerating a recent decline. (.DXY).
Crypto World Bitcoin
Bitcoin drops 15%, briefly breaking below $61,000 as sell-off intensifies, doubts about crypto grow. Bitcoin briefly sank below $61,000 on Thursday evening as investor confidence continued to falter in the asset once hailed as “digital gold” and a unique store of value. At one point, the token slid to $60,062.00, as the crypto sell-off intensified in overnight trading. Bitcoin was last down about 15% at 7:37 p.m. ET, trading at $62,448.00.
MBA Mortgage Applications
A higher than expected reading should be taken as positive/bullish for the USD, while a lower than expected reading should be taken as negative/bearish for the USD. The MBA mortgage applications index is 8.9 percent lower in the January 30 week. It is 22.2 percent higher than four weeks ago and 47.2 percent higher than a year earlier. The purchase index is 14.4 percent lower in the current week and 3.8 percent higher than four weeks ago and 5.6 percent higher than a year earlier. The refinancing index is 4.7 percent lower and is 35.5 percent higher than four weeks ago and 117.3 percent higher than a year earlier. In the January 30 week, refinancing accounted for 57.1 percent of mortgage applications compared to 56.2 percent in the prior week.
ADP Employment Report
Private payrolls rose by just 22,000 in January, far short of expectations, ADP says Private companies added just 22,000 positions for January. The total was less than the downwardly revised 37,000 increase in December and below the consensus forecast for 45,000. The report starts 2026 off on basically the same note where 2025 ended: a lackluster job market in a low-hire, low-fire environment. The U.S. labor market barely budged in January, with hiring below even muted expectations, according to a report Wednesday from payrolls processing firm ADP.
PMI Composite Final
The S&P Global US Composite PMI rose to 53.0 in January 2026, above the preliminary 52.8 and December’s 52.7, pointing to a solid expansion in private-sector activity. Output growth strengthened across both manufacturing and services, supported by faster gains in new business. Employment increased only marginally, while business confidence softened. Cost pressures remained elevated, though input inflation eased from late 2025, with a similar moderation in output price growth.
ISM Services Index
The US ISM Services Index held steady at 53.8% in January 2026, signaling continued expansion in the services sector for the second consecutive month. While the headline number indicates steady growth, mixed sub-index results showed increased business activity but a slight dip in new orders and employment.
EIA Crude Oil Report
Crude Oil Invedories -3.5M Barrels.U.S. crude oil inventories fell last week as a decline in production amid winter storm Fern partially offset a rise in imports, according to data released Wednesday by the U.S. Energy Information Administration. Commercial crude oil stocks excluding the Strategic Petroleum Reserve fell by 3.5 million barrels to 420.3 million barrels in the week ended Jan. 30 and were about 4% below the five-year average for the time of year, the EIA said. Crude stocks were seen unchanged in a Wall Street Journal survey of analysts.
Hedging Gold
Precious metals continued their sharp retreat today, with both gold and silver failing to reclaim critical technical levels that had previously served as support, triggering further liquidation in an already fragile market environment. The renewed weakness underscores the severity of the technical damage inflicted during last Friday's historic sell-off and raises questions about the sustainability of what had been the most powerful bull runs in metals history.
Google Earnings
Google parent beats on revenue, projects significant AI spending increase. Alphabet beat Wall Street’s expectations for earnings and revenue. The company reported Capex spend in the range of $175 billion to $185 billion — nearly double its 2025 spend. The company saw revenue increase almost 18% year over year. Net income came in at $34.46 billion, up almost 30% compared to the year prior. Here’s how the company did, compared with estimates from analysts polled by LSEG: Earnings per share: $2.82 vs. $2.63 estimated Revenue: $113.83 billion vs. $111.43 billion estimated. Alphabet beat on the top and bottom lines in its fourth-quarter earnings report on Wednesday, and said it expects to significantly increase spending on artificial intelligence in 2026. The stock fell as much as 3% in extended trading.
Amazon Earnings
Amazon stock falls 10% on $200 billion spending forecast, earnings miss. Amazon shares plunged more than 10% in extended trading Thursday after the company posted mixed fourth-quarter earnings and boosted its 2026 spending forecast to $200 billion. Here’s how the company did, compared with estimates from analysts polled by LSEG: Earnings per share: $1.95 vs. $1.97 estimated Revenue: $213.39 billion vs. $211.33 billion estimated. Amazon said it expects capital expenditures to continue to climb higher this year as it aggressively invests in data centers and other infrastructure to meet a surge in artificial intelligence demand.
Jobless Initial Claims
The number of Americans filing new applications for unemployment benefits increased more than expected last week, likely boosted by snowstorms across much of the country, but labor market conditions remain stable. Initial claims for state unemployment benefits jumped 22,000 to a seasonally adjusted 231,000 for the week ended January 31, the Labor Department said on Thursday.
JOLTS
The December JOLTS report underscored the labor market remains in a precarious position. Job openings fell to 6.542 million and are down around 10% over the past year. Consensus 7.245 M. The ongoing slide suggests a turnaround in hiring conditions is not yet upon us. Turnover data also suggest labor market activity remains subdued. The hiring and quit rates remained near their lowest levels in roughly a decade in December, excluding the initial months of the pandemic.
Fed Balance Sheet
Total Assets $18.341 B from $2.988 B. Investors are ramping up bets on higher long‑dated Treasury yields and a steeper yield curve as incoming Federal Reserve Chair Kevin Warsh is expected to press for interest rate cuts while shrinking the U.S. central bank's balance sheet. Warsh's preference for a materially smaller Fed balance sheet, currently around $6.59 trillion, implies a withdrawal of meaningful government demand for Treasuries, a move which tightens financial conditions because the central bank is not providing liquidity to the market.
Mortgage Rates
It’s another week where mortgage rates seem to be doing a whole lot of nothing — a good thing if you can afford an APR around 6%, though not so good if you were hoping to score a sweetheart of a deal this February.In the week ending Feb. 5, the average 30-year fixed mortgage rates stayed completely flat from the week prior at 6.01%, according to rates provided to NerdWallet by Zillow. APRs for 30-year fixed mortgages averaged 5.99% in January, nearly a hundred basis points — or an entire percentage point — below January 2025’s average of 6.96%.
Employment Situation
We were supposed to get January's jobs report tomorrow from the Bureau of Labor Statistics (BLS), but it’s been delayed until Feb. 11 because of the (now ended) partial government shutdown. The Consumer Price Index, which provides a key federal measure of inflation, has also been pushed a few days, from next Wednesday to next Friday.
Consumer Sentiment UM
Brief News
Consumer Credit
Brief News
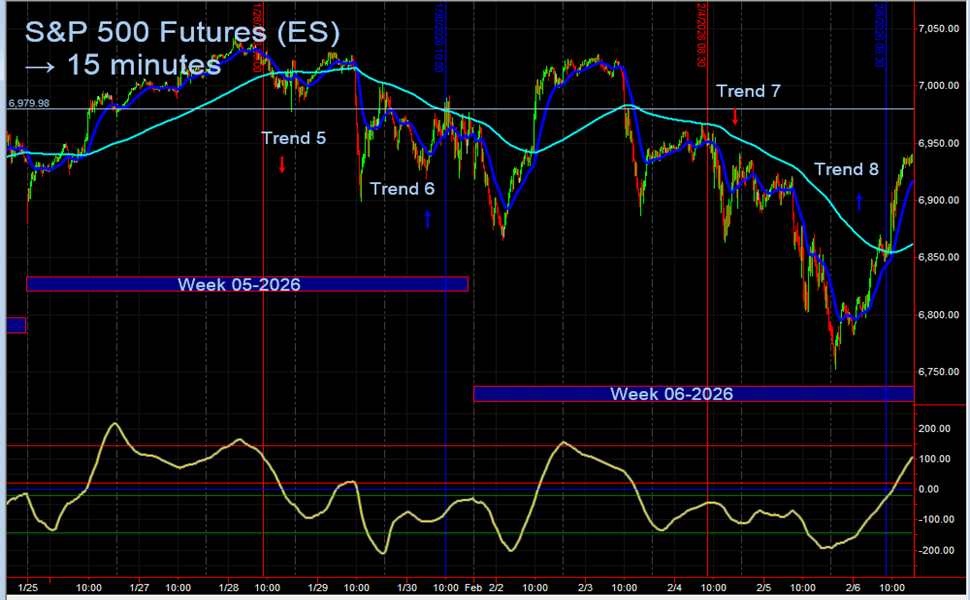
S&P 500 Index
Brief News
VIX Volatility Index
Volatility roars back: VIX tops 20 amid tech and crypto sell-offs. Market volatility returned to the spotlight on Thursday as investor concerns intensified, with the Cboe Volatility Index (VIX)—a key gauge of anticipated market swings—surged above the 20 handle. The index climbed sharply, rising nearly 11.3% and briefly touching 23.1, marking its highest level since late November. The spike underscores growing unease among traders amid a broad rotation away from growth-focused assets.
Geopolitical Risks
Brief News |