|
 |
|
 |
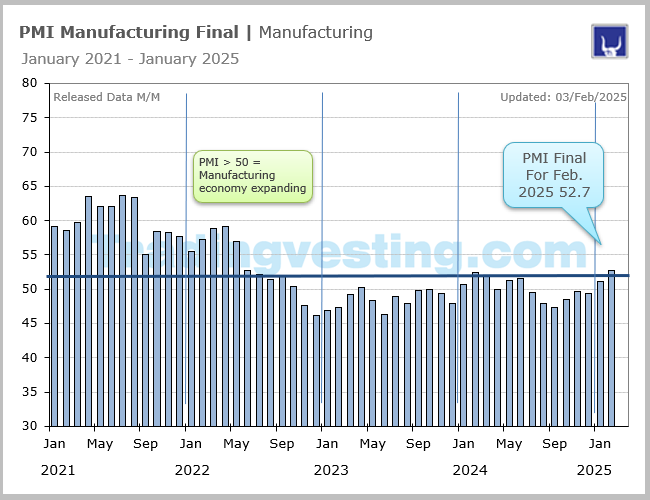
PMI Mfg Final | Manufacturing |
|
 |
|
The US manufacturing PMI - calculated by S&P Global, offers an advance indication on month-to-month activity in the private sector economy by tracking changes in several variables. Also called PMI Composite Index.→ Read more
|
|
|
|
|
|
|
| |
|
| |
 6. PMI Mfg Final (6 of 9)
 7. PMI Composite Flash (7 of 9)
 8. Chicago PMI (8 of 9)
 9. Philadelphia Mfg Index (9 of 9)
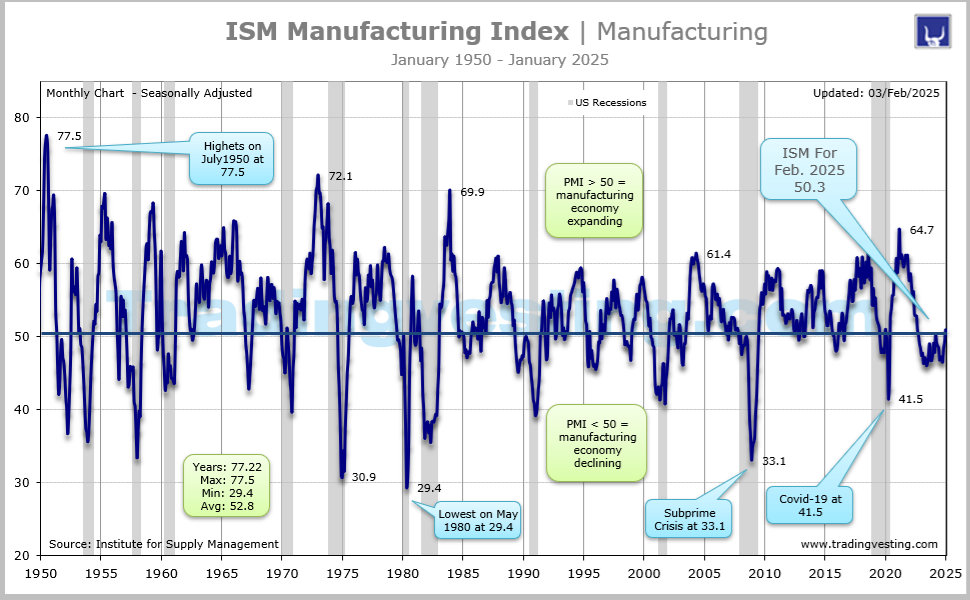
 1. ISM Manufacturing Index (1 of 9)
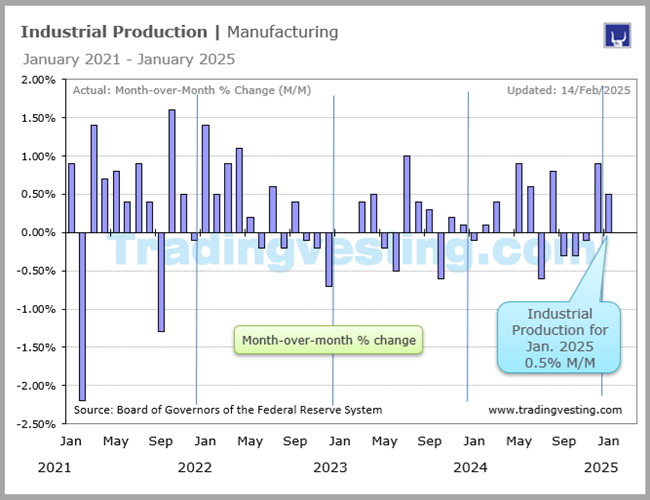 2. Industrial Production (2 of 9)
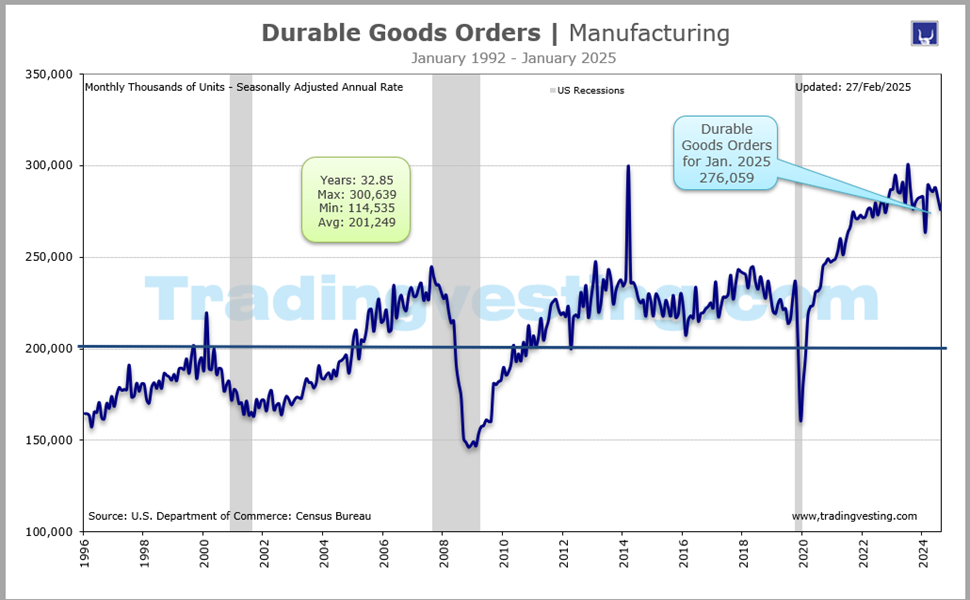
 3. Durable Goods Orders (3 of 9)
 4. Factory Orders (4 of 9)
 5. Empire State Mafg Index (5 of 9)
|
 |
|
|
|
|
| |
|
→ Big Chart |
|
→ Release |
|
| |
|
|
|
|
|
|
|
|
|
|
|
|
|
|
|
|
|
|
|
 |
|
Big Chart | Large Data |
 |
|
PMI Mfg Final | Manufacturing |
|
Today's Week |
 |
|
|
|
|
|
|
|
|
|
|
|
|
|
| |
|
|
|
|
|
|
|
|
|
|
|
|
|
| |
|
|
|
|
|
|
|
|
|
|
|
|
|
|
|
|
|
|
|
|
|
Release Schedule | 2026 |
|
|
PMI Mfg Final | Manufacturing |
|
Today's Week |
|
|
|
|
|
|
|
|
|
|
|
|
|
PMI Manufacturing Final (At 9:45 a.m ET)
| SCHEDULE 2026 |
No 1 |
No 2 |
No 3 |
No 4 |
No 5 |
No 6 |
No 7 |
No 8 |
No 9 |
No 10 |
No 11 |
No 12 |
| Release | Week |
|
|
|
|
|
|
|
|
|
|
|
|
| Release | Date |
|
|
|
|
|
|
|
|
|
|
|
|
| Release | Day |
|
|
|
|
|
|
|
|
|
|
|
|
 |
|
|
|
|
|
|
|
|
|
|
|
|
| Prior |
52.2 |
51.8 |
52.4 |
51.6 |
52.3 |
54.5 |
... |
... |
... |
... |
... |
... |
| PMI Mfg Flash^ |
51.8 |
51.9 |
51.2 |
52.4 |
54.0 |
55.3 |
... |
... |
... |
... |
... |
... |
| CONSENSUS |
51.8 |
51.9 |
51.2 |
52.4 |
... |
55.3 |
... |
... |
... |
... |
... |
... |
| Consensus Low |
51.8 |
49.5 |
51.2 |
52.1 |
... |
55.0 |
... |
... |
... |
... |
... |
... |
| Consensus High |
51.8 |
52.2 |
51.2 |
53.5 |
... |
55.3 |
... |
... |
... |
... |
... |
... |
| PMI FINAL INDEX |
51.8 |
52.4 |
51.6 |
52.3 |
54.5 |
55.1 |
... |
... |
... |
... |
... |
... |
| PMI Type |
Final |
Final |
Final |
Final |
Final |
Final |
Final |
Final |
Final |
Final |
Final |
Final |
| RATING |
|
|
|
|
|
|
|
|
|
|
|
|
| Release For |
Dec-25 |
Jan-26 |
Feb-26 |
Mar-26 |
Apr-26 |
May-26 |
Jun-26 |
Jul-26 |
Aug-26 |
Sep-26 |
Oct-26 |
Nov-26 |
|
|
| |
|
| |
|
|
|
|
|
|
|
|
|
|
|
Release Schedule | 2025 |
|
|
PMI Mfg Final | Manufacturing |
|
Today's Week |
|
|
|
|
|
|
|
|
|
|
|
|
|
PMI Manufacturing Final (At 9:45 a.m ET)
| SCHEDULE 2025 |
No 1 |
No 2 |
No 3 |
No 4 |
No 5 |
No 6 |
No 7 |
No 8 |
No 9 |
No 10 |
No 11 |
No 12 |
| Release | Week |
|
|
|
|
|
|
|
|
|
|
|
|
| Release | Date |
|
|
|
|
|
|
|
|
|
|
|
|
| Release | Day |
|
|
|
|
|
|
|
|
|
|
|
|
|
|
|
|
|
|
|
|
|
|
|
|
|
| Prior |
49.7 |
49.4 |
51.2 |
52.7 |
50.2 |
50.2 |
52.0 |
52.9 |
49.8 |
53.0 |
53.0 |
52.5 |
| PMI Mfg Flash^ |
48.3 |
50.1 |
51.6 |
49.8 |
50.7 |
52.3 |
52.0 |
49.5 |
53.3 |
52.0 |
52.2 |
51.9 |
| CONSENSUS |
48.3 |
50.1 |
51.6 |
49.8 |
50.7 |
52.3 |
52.0 |
49.5 |
53.3 |
52.0 |
52.2 |
51.9 |
| Consensus Low |
48.3 |
49.8 |
51.6 |
49.8 |
50.7 |
52.3 |
52.0 |
49.5 |
53.3 |
52.0 |
52.2 |
51.9 |
| Consensus High |
48.9 |
50.1 |
51.6 |
49.8 |
50.7 |
52.3 |
52.0 |
49.5 |
53.3 |
52.0 |
52.2 |
51.9 |
| PMI FINAL INDEX |
49.4 |
51.2 |
52.7 |
50.2 |
50.2 |
52.0 |
52.9 |
49.8 |
53.0 |
52.0 |
52.5 |
52.2 |
| PMI Type |
Final |
Final |
Final |
Final |
Final |
Final |
Final |
Final |
Final |
Final |
Final |
Final |
| RATING |
|
|
|
|
|
|
|
|
|
|
|
|
| Release For |
Dec-24 |
Jan-25 |
Feb-25 |
Mar-25 |
Apr-25 |
May-25 |
Jun-25 |
Jul-25 |
Aug-25 |
Sep-25 |
Oct-25 |
Nov-25 |
|
|
| |
|
| |
|
|
|
|
|
|
|
|
|
|
|
Release Schedule | 2024 |
|
|
PMI Mfg Final | Manufacturing |
|
Today's Week |
|
|
|
|
|
|
|
|
|
|
|
|
|
PMI Manufacturing Final (At 9:45 a.m ET)
| SCHEDULE 2024 |
No 1 |
No 2 |
No 3 |
No 4 |
No 5 |
No 6 |
No 7 |
No 8 |
No 9 |
No 10 |
No 11 |
No 12 |
| Release | Week |
|
|
|
|
|
|
|
|
|
|
|
|
| Release | Date |
|
|
|
|
|
|
|
|
|
|
|
|
| Release | Day |
|
|
|
|
|
|
|
|
|
|
|
|
|
|
|
|
|
|
|
|
|
|
|
|
|
| Prior |
49.4 |
47.9 |
50.7 |
52.2 |
51.9 |
50.0 |
51.3 |
51.6 |
49.6 |
47.9 |
47.3 |
48.5 |
| Flash |
48.2 |
50.3 |
51.5 |
52.5 |
49.9 |
50.9 |
51.7 |
49.5 |
48.0 |
47.0 |
47.8 |
48.8 |
| CONSENSUS |
48.2 |
50.3 |
51.5 |
52.5 |
49.9 |
50.9 |
51.7 |
49.5 |
48.0 |
47.0 |
... |
48.8 |
| Consensus Low |
48.1 |
50.3 |
51.5 |
52.5 |
49.9 |
50.9 |
51.7 |
49.5 |
48.0 |
47.0 |
... |
48.8 |
| Consensus High |
48.2 |
50.3 |
51.5 |
52.8 |
49.9 |
50.9 |
51.7 |
49.5 |
48.0 |
47.5 |
... |
48.8 |
| PMI FINAL INDEX |
47.9 |
50.7 |
52.2 |
51.9 |
50.0 |
51.3 |
51.6 |
49.6 |
47.9 |
47.3 |
48.5 |
49.7 |
| PMI Type |
Final |
Final |
Final |
Final |
Final |
Final |
Final |
Final |
Final |
Final |
Final |
Final |
| RATING |
|
|
|
|
|
|
|
|
|
|
|
|
| Release For |
Dec-23 |
Jan-24 |
Feb-24 |
Mar-24 |
Apr-24 |
May-24 |
Jun-24 |
Jul-24 |
Aug-24 |
Sep-24 |
Oct-24 |
Nov-24 |
|
|
| |
|
| |
|
|
|
|
|
|
|
|
|
|
|
Release Schedule | 2023 |
|
|
PMI Mfg Final | Manufacturing |
|
Today's Week |
|
|
|
|
|
|
|
|
|
|
|
|
|
PMI Manufacturing Final (At 9:45 a.m ET)
| SCHEDULE 2023 |
No 1 |
No 2 |
No 3 |
No 4 |
No 5 |
No 6 |
No 7 |
No 8 |
No 9 |
No 10 |
No 11 |
No 12 |
| Release | Week |
|
|
|
|
|
|
|
|
|
|
|
|
| Release | Date |
|
|
|
|
|
|
|
|
|
|
|
|
| Release | Day |
|
|
|
|
|
|
|
|
|
|
|
|
|
|
|
|
|
|
|
|
|
|
|
|
|
| Prior |
47.7 |
46.7 |
46.9 |
47.3 |
49.2 |
50.2 |
48.4 |
46.3 |
49.0 |
47.9 |
49.8 |
50.0 |
| Prior Revised |
... |
... |
... |
... |
... |
... |
... |
... |
... |
... |
... |
... |
| CONSENSUS |
46.2 |
... |
47.8 |
49.3 |
50.4 |
... |
46.3 |
49.0 |
47.0 |
48.9 |
... |
49.4 |
| Consensus Low |
46.2 |
... |
47.8 |
49.3 |
49.1 |
... |
46.3 |
49.0 |
47.0 |
48.9 |
... |
... |
| Consensus High |
46.2 |
... |
47.8 |
49.3 |
50.4 |
... |
48.5 |
49.0 |
47.0 |
48.9 |
... |
... |
| PMI FINAL INDEX |
46.7 |
46.9 |
47.3 |
49.2 |
50.2 |
48.4 |
46.3 |
49.0 |
47.9 |
49.8 |
50.0 |
49.4 |
| PMI Type |
Final |
Final |
Final |
Final |
Final |
Final |
Final |
Final |
Final |
Final |
Final |
Final |
| RATING |
|
|
|
|
|
|
|
|
|
|
|
|
| Release For |
Dec-22 |
Jan-23 |
Feb-23 |
Mar-23 |
Apr-23 |
May-23 |
Jun-23 |
Jul-23 |
Aug-23 |
Sep-23 |
Oct-23 |
Nov-23 |
|
|
| |
|
| |
|
|
|
|
|
|
|
|
|
|
|
Release Schedule | 2022 |
|
|
PMI Mfg Final | Manufacturing |
|
Today's Week |
|
|
|
|
|
|
|
|
|
|
|
|
|
PMI Manufacturing Final (At 9:45 a.m ET)
| SCHEDULE 2022 |
No 1 |
No 2 |
No 3 |
No 4 |
No 5 |
No 6 |
No 7 |
No 8 |
No 9 |
No 10 |
No 11 |
No 12 |
| Release | Week |
|
|
|
|
|
|
|
|
|
|
|
|
| Release | Date |
|
|
|
|
|
|
|
|
|
|
|
|
| Release | Day |
|
|
|
|
|
|
|
|
|
|
|
|
|
|
|
|
|
|
|
|
|
|
|
|
|
| Prior |
58.3 |
57.7 |
55.5 |
57.3 |
58.8 |
59.2 |
57.0 |
52.7 |
52.2 |
51.5 |
52.0 |
50.4 |
| Prior Revised |
... |
... |
... |
... |
... |
... |
... |
... |
... |
... |
... |
... |
| CONSENSUS |
57.8 |
55.0 |
57.5 |
58.5 |
59.4 |
57.5 |
... |
52.3 |
51.3 |
51.8 |
49.9 |
47.6 |
| Consensus Low |
57.6 |
54.7 |
57.5 |
58.5 |
58.5 |
57.5 |
... |
52.3 |
51.3 |
51.4 |
49.9 |
47.6 |
| Consensus High |
60.0 |
56.6 |
57.9 |
58.7 |
59.7 |
57.5 |
... |
52.3 |
51.3 |
51.8 |
49.9 |
48.0 |
| PMI FINAL INDEX |
57.7 |
55.5 |
57.3 |
58.8 |
59.2 |
57.0 |
52.7 |
52.2 |
51.5 |
52.0 |
50.4 |
47.7 |
| PMI Type |
Final |
Final |
Final |
Final |
Final |
Final |
Final |
Final |
Final |
Final |
Final |
Final |
| RATING |
|
|
|
|
|
|
|
|
|
|
|
|
| Release For |
Dec-21 |
Jan-22 |
Feb-22 |
Mar-22 |
Apr-22 |
May-22 |
Jun-22 |
Jul-22 |
Aug-22 |
Sep-22 |
Oct-22 |
Nov-22 |
|
|
| |
|
| |
|
|
|
|
|
|
|
|
|
|
|
Release Schedule | 2021 |
|
|
PMI Mfg Final | Manufacturing |
|
Today's Week |
|
|
|
|
|
|
|
|
|
|
|
|
|
PMI Manufacturing Final (At 9:45 a.m ET)
| SCHEDULE 2021 |
No 1 |
No 2 |
No 3 |
No 4 |
No 5 |
No 6 |
No 7 |
No 8 |
No 9 |
No 10 |
No 11 |
No 12 |
| Release | Week |
|
|
|
|
|
|
|
|
|
|
|
|
| Release | Date |
|
|
|
|
|
|
|
|
|
|
|
|
| Release | Day |
|
|
|
|
|
|
|
|
|
|
|
|
|
|
|
|
|
|
|
|
|
|
|
|
|
| Prior |
56.7 |
57.1 |
59.2 |
58.6 |
59.7 |
63.5 |
68.7 |
62.1 |
63.7 |
63.4 |
55.0 |
58.4 |
| Prior Revised |
... |
59.1 |
... |
59.5 |
59.1 |
... |
... |
... |
... |
... |
... |
... |
| CONSENSUS |
56.5 |
58.0 |
58.5 |
59.1 |
60.6 |
61.5 |
62.6 |
64.0 |
63.1 |
54.5 |
59.2 |
59.1 |
| Consensus Low |
56.3 |
56.5 |
58.5 |
59.1 |
60.5 |
61.3 |
62.0 |
63.9 |
62.0 |
54.5 |
59.0 |
59.1 |
| Consensus High |
56.5 |
59.1 |
59.0 |
59.8 |
62.8 |
65.1 |
62.6 |
68.9 |
63.1 |
55.6 |
59.3 |
59.7 |
| PMI FINAL INDEX |
57.1 |
59.2 |
58.6 |
59.7 |
63.5 |
62.1 |
62.1 |
63.7 |
63.4 |
55.0 |
58.4 |
58.3 |
| PMI Type |
Final |
Final |
Final |
Final |
Final |
Final |
Final |
Final |
Final |
Final |
Final |
Final |
| RATING |
|
|
|
|
|
|
|
|
|
|
|
|
| Release For |
Dec-20 |
Jan-21 |
Feb-21 |
Mar-21 |
Apr-21 |
May-21 |
Jun-21 |
Jul-21 |
Aug-21 |
Sep-21 |
Oct-21 |
Nov-21 |
|
|
| |
|
| |
|
Legends: |
 |
Delayed |
 |
Positive View |
 |
Negative View |
 |
Neutral View |
 |
Non Available |
|
|
|
|
|
|
|
|
|
|
|
|
|
|
|
|
|
|
|
|
| |
|
|
|
|
|
|
|
|
|
|
|
|
|
|
|
|
|
|
|
|
|
Brief News | 2026 |
|
|
PMI Mfg Final | Manufacturing |
|
Today's Week |
|
|
|
|
|
|
|
|
|
|
|
|
|
PMI Manufacturing Final
(At 9:45 a.m ET)
| DATE/WEEK |
HIGHLIGHTS |
FOR |
PMI |
|
PMI Mfg Final |
No 12 |
... |
|
Nov-2026 |
|
| |
|
|
|
PMI Mfg Final |
No 11 |
... |
|
Oct-2026 |
|
| |
|
|
|
PMI Mfg Final |
No 10 |
... |
|
Sep-2026 |
|
| |
|
|
|
PMI Mfg Final |
No 9 |
... |
|
Aug-2026 |
|
| |
|
|
|
PMI Mfg Final |
No 8 |
... |
|
Jul-2026 |
|
| |
|
|
|
PMI Mfg Final |
No 7 |
... |
|
Jun-2026 |
|
| |
|
|
|
PMI Mfg Final |
No 6 |
... |
|
May-2026 |
|
| |
|
|
|
PMI Mfg Final |
No 5 |
... |
|
Apr-2026 |
|
| |
|
|
|
PMI Mfg Final |
No 4 |
51.6 |
|
Mar-2026 |
|
| |
|
|
|
PMI Mfg Final |
No 3 |
52.4 |
|
Feb-2026 |
|
| |
|
|
|
PMI Mfg Final |
No 2 |
52.4 |
|
Jan-2026 |
|
| |
|
|
|
The S&P Global US Manufacturing PMI was confirmed at 51.8 in December 2025, falling from 52.2 in November and signaling the weakest expansion in the sector's five-month growth streak. The final December figure of 51.8 was in line with both the initial flash estimate and market expectations. |
No 1 |
51.8 |
|
Dec-2025 |
|
| |
|
|
|
|
|
|
|
|
| |
|
|
|
|
|
| |
|
|
|
|
|
|
|
|
|
|
|
|
|
|
|
Brief News | 2025 |
|
|
PMI Mfg Final | Manufacturing |
|
Today's Week |
|
|
|
|
|
|
|
|
|
|
|
|
|
PMI Manufacturing Final (At 9:45 a.m ET)
| DATE/WEEK |
HIGHLIGHTS |
FOR |
ACTUAL |
|
The headline index from the report, the seasonally adjusted
S&P Global US Manufacturing Purchasing Managers’ Index™ (PMI®), recorded 52.2 in November. That was down from 52.5 in the previous month and consistent with another solid, albeit slower, improvement in operating conditions. The index has now posted above the critical 50.0 no-change mark for four successive months. |
No 12 |
52.2 |
|
Nov-2025 |
|
| |
|
|
|
The performance of the US manufacturing economy improved again in October, with both output and new orders rising at stronger rates. However, growth was domestic led as new exports fell due to tariffs reportedly negatively impacting international trade. The headline index from the report, the seasonally adjusted S&P Global US Manufacturing Purchasing Managers’ Index™ (PMI®), recorded 52.5 in October, compared to 52.0 in September. |
No 11 |
52.5 |
|
Oct-2025 |
|
| |
|
|
|
US September final S&P Global manufacturing PMI 52.0 vs 52.0 preliminary. he final US reading on manufacturing from S&P Global for September 2025.A growing uncertainty, however, relates to supply chains, with September seeing an increase in tariff- related vendor delays, which threaten to curb production and push up prices if these difficulties persist or intensify. |
No 10 |
52.0 |
|
Sep-2025 |
|
| |
|
|
|
Data from S&P Global published Tuesday morning, however, painted a more positive picture of the sector, with the firm's US manufacturing PMI showing the strongest monthly increase since May 2022. S&P Global's US manufacturing PMI came in at 53, above the 49.8 seen in July 2025. This report also showed, however, that tariffs continue to act as a headwind for manufacturing. |
No 9 |
53.0 |
|
Aug-2025 |
|
| |
|
|
|
The U.S. PMI Manufacturing reading of 49.8 in July 2025 indicated a contraction in the manufacturing sector, as a reading below 50 signifies a decline in activity. This was the lowest reading since December 2024 and reflected stalled new orders, a decline in international sales due to tariffs, and reduced inventory accumulation by businesses.
|
No 8 |
49.8 |
|
Jul-2025 |
|
| |
|
|
|
PMI Manufacturing Final. The US manufacturing sector expanded again in June, with operating conditions improving to the greatest degree in over three years. Output increased for the first time since February, and to a solid degree, whilst new orders increased for a sixth successive month due to improved domestic and international demand. The headline index from the report, the seasonally adjusted S&P Global US Manufacturing Purchasing Managers’ Index™ (PMI®), improved to 52.9 in June, from 52.0 in May. The latest reading was the highest since May 2022, and indicative of a solid rate of expansion. It was also the sixth successive month in which the PMI has posted above the critical 50.0 no-change mark.
|
No 7 |
52.9 |
|
Jun-2025 |
|
| |
|
|
|
PMI Manufacturing Final. The headline index from the report, the seasonally adjusted S&P Global US Manufacturing Purchasing Managers’ Index™ (PMI®), posted 52.0 in May. That was up from readings of 50.2 in the preceding two months and represented solid overall growth which was the best since February’s recent high. Tariffs and trade policy continued to dominate the manufacturing landscape in May, according to the latest PMI survey data from S&P Global. |
No 6 |
52.0 |
|
May-2025 |
|
| |
|
|
|
PMI Manufacturing Final. The seasonally adjusted S&P Global US Manufacturing Purchasing Managers’ Index™ (PMI®) recorded 50.2 in April, unchanged since March. Although above the crucial 50.0 no-change mark for the fourth consecutive month, the index again signaled only a marginal expansion. |
No 5 |
50.2 |
|
Apr-2025 |
|
| |
|
|
|
PMI Manufacturing Final. The S&P Global US Manufacturing PMI for March 2025 was 50.2, indicating a slight expansion in manufacturing activity. While this is above the 50 mark that separates expansion from contraction, it's a decrease from the previous month's reading of 52.7. The PMI also fell short of the preliminary estimate of 49.8.
|
No 4 |
50.2 |
|
Mar-2025 |
|
| |
|
|
|
The seasonally adjusted S&P Global US Manufacturing. Purchasing Managers' Index™ (PMI®) recorded 52.7 in. February, up from 51.2 in January. US February manufacturing PMI beats expectations at 52.7. The S&P Global US Manufacturing Purchasing Managers' Index (PMI) rose to 52.7 in February 2025, surpassing the preliminary estimate of 51.6 and improving from 51.2. |
No 3 |
52.7 |
|
Feb-2025 |
|
| |
|
|
|
US January 2024final S&P Global manufacturing PMI 51.2 vs 50.1 prior.Manufacturers report that political uncertainty has cleared and the pro-business approach from the new administration has brightened their prospects.A new year and a new President has brought new optimism in the US manufacturing sector. |
No 2 |
51.2 |
|
Jan-2025 |
|
| |
|
|
|
USA: manufacturing PMI declines slightly in December. U.S. December Manufacturing PMI Exceeds Expectations. According to Odaily, market reports indicate that the final U.S. S&P Global Manufacturing PMI for December was recorded at 49.4. This figure surpasses the anticipated 48.3 and matches the previous value of 48.3. The seasonally adjusted S&P Global US Manufacturing. Purchasing Managers' Index™ (PMI®) posted 49.4 in. December, down from 49.7 in November 2024The US manufacturing PMI - calculated by S&P Global - fell to 49.4 last month from 49.7 in November, and thus dipped slightly below the 50 threshold that marks the boundary between expansion and contraction in the sector's activity. After approaching stabilization in the previous month, December saw a sharper decline in new orders, according to S&P Global, which also points to a sharper reduction in production and an acceleration in the rise in input costs. |
No 1 |
49.4 |
|
Dec-2024 |
|
| |
|
|
|
|
|
|
|
|
| |
|
|
|
|
|
| |
|
|
|
|
|
|
|
|
|
|
|
|
|
|
|
Brief News | 2024 |
|
|
PMI Mfg Final | Manufacturing |
|
Today's Week |
|
|
|
|
|
|
|
|
|
|
|
|
|
PMI Manufacturing Final (At 9:45 a.m ET)
| DATE/WEEK |
HIGHLIGHTS |
FOR |
ACTUAL |
|
PMI Manufacturing Final at 49.7 in Novrmber 2024 from 48.5. US November fial S&P Global manufacturing PMI 49.7 vs 48.8 prelim. US manufacturing survey from S&P Global. The US manufacturing PMI - calculated by S&P Global - rose to 49.7 in November from 48.5 the previous month, and thus fell slightly below the 50 threshold which marks the boundary between expansion and contraction in the sector's activity. S&P Global points out that a sharp slowdown in the decline in new orders played a central role in this near-stabilization of manufacturing activity, with manufacturers pointing to improved domestic demand following the presidential election. Although production fell again last month, manufacturers' production outlook for the coming year has improved significantly, with companies in the sector hoping for favorable measures from the future administration. |
No 12 |
49.7 |
|
Nov-2024 |
|
| |
|
|
|
PMI Manufacturing Final at 48.5 in October 2024 from 47.3. US S&P Global final October manufacturing PMI 48.5 vs 47.8 prelim. The survey does, however, provide some encouragement that the current soft patch could prove short-lived. Hurricanes have been blamed for supply disruptions, which should therefore ease in November, and manufacturers are feeling more positive about the outlook than at any time since May, hoping that demand will pick up once the uncertainty generated by the Presidential Election clears. |
No 11 |
48.5 |
|
Oct-2024 |
|
| |
|
|
|
US Sept S&P Global final manufacturing PMI 47.3 vs 47.0 preliminary. The September PMI survey brings a whole slew of disappointing economic indicators regarding the health of the US economy. Factories reported the largest monthly drop in production for 15 months in response to a slump in new orders, in turn driving further reductions in employment and input buying as producers scaled back operating capacity. Prelim was 47.0 and Prior month was 47.9. |
No 10 |
47.3 |
|
Sep-2024 |
|
| |
|
|
|
US August final S&P Global manufacturing PMI 47.9 vs 48.0 prelim. Prelim was 48.0. July final was 46.8. Production declines for first time in 7 months. New orders fall at fastest pace since June 2023. Employment drops for first time this year. Input cost inflation accelerates to 16-month high. |
No 9 |
47.9 |
|
Aug-2024 |
|
| |
|
|
|
The seasonally adjusted S&P Global US Manufacturing Purchasing Managers’ Index™ (PMI®) fell to 49.6 in July from 51.6 in June, below the 50.0 no-change mark for the first time in seven months and signaling a slight deterioration in the health of the manufacturing sector. |
No 8 |
49.5 |
|
Jul-2024 |
|
| |
|
|
|
The seasonally adjusted S&P Global US Manufacturing Purchasing Managers’ Index™ (PMI®) ticked up to a threemonth high of 51.6 in June from 51.3 in May. The index signaled a modest monthly improvement in business conditions. |
No 7 |
51.6 |
|
Jun-2024 |
|
| |
|
|
|
The seasonally adjusted S&P Global US Manufacturing Purchasing Managers’ Index™ (PMI®) rose to 51.3 in May, after having posted in line with the 50.0 no-change mark in April. The reading signaled a modest improvement in the health of the manufacturing sector, the fourth in the past five months. |
No 6 |
51.3 |
|
May-2024 |
|
| |
|
|
|
The seasonally adjusted S&P Global US Manufacturing Purchasing Managers’ Index™ (PMI®) posted in line with the 50.0 no-change mark in April to point to stable business conditions at the start of the second quarter. The reading was down from 51.9 in March and signaled an end to a threemonth sequence of improving operating conditions. |
No 5 |
50.0 |
|
Apr-2024 |
|
| |
|
|
|
The seasonally adjusted S&P Global US Manufacturing Purchasing Managers’ Index™ (PMI®) was above the 50.0 no-change mark for the third successive month in March, thereby signalling a further monthly strengthening in the health of the sector. That said, at 51.9 the index was down from 52.2 in February, pointing to a slightly less pronounced improvement at the end of the opening quarter of the year. |
No 4 |
51.9 |
|
Mar-2024 |
|
| |
|
|
|
The seasonally adjusted S&P Global US Manufacturing Purchasing Managers’ Index™ (PMI) posted 52.5 in February 2024, up from 50.7 in January 2024. Consensus was 51.5, it came as better than consensus. The prev flash was also 51.5. |
No 3 |
52.5 |
|
Feb-2024 |
|
| |
|
|
|
The seasonally adjusted S&P Global US Manufacturing Purchasing Managers’ Index™ (PMI) posted 50.7 in January, up from 47.9 in December and slightly higher than the earlier released 'flash' estimate of 50.3. The latest upturn ended a two-month sequence of decline, and signalled the strongest improvement in operating conditions since September 2022. |
No 2 |
50.7 |
|
Jan-2024 |
|
| |
|
|
|
The seasonally adjusted S&P Global US Manufacturing Purchasing Managers’ Index™ (PMI) posted 47.9 in December, down from 49.4 in November and lower than the earlier released 'flash' estimate of 48.2. The latest decline in the health of the sector was modest overall and the quickest since August. |
No 1 |
47.9 |
|
Dec-2023 |
|
| |
|
|
|
|
|
|
|
|
| |
|
|
|
|
|
| |
|
|
|
|
|
|
|
|
|
|
|
|
|
|
|
Brief News | 2023 |
|
|
PMI Mfg Final | Manufacturing |
|
Today's Week |
|
|
|
|
|
|
|
|
|
|
|
|
|
PMI Manufacturing Final (At 9:45 a.m ET)
| DATE/WEEK |
HIGHLIGHTS |
FOR |
ACTUAL |
|
The seasonally adjusted S&P Global US Manufacturing Purchasing Managers’ Index™ (PMI) posted 49.4 in November, unchanged from the earlier released 'flash' estimate, but down from 50.0 in October. The fall in the headline figure signalled a renewed decline in the health of the manufacturing sector and one that was the strongest since August. |
No12 |
49.4 |
|
Nov-2023 |
|
| |
|
|
|
The seasonally adjusted S&P Global US Manufacturing Purchasing Managers’ Index™ (PMI) posted 50.0 in October 2023, up from 49.8 in September 2023. |
No 11 |
50.0 |
|
Oct-2023 |
|
| |
|
|
|
The seasonally adjusted S&P Global US Manufacturing Purchasing Managers’ Index™ (PMI™) posted 49.8 in September, up from 47.9 in August and higher than the earlier released 'flash' estimate of 48.9. With the exception of the slight expansion seen in April, operating conditions have deteriorated in ten of the last 11 months. Nonetheless, the latest decline in the sector's health was only fractional. |
No 10 |
49.8 |
|
Sep-2023 |
|
| |
|
|
|
Sharper contraction of US manufacturing sector in August 2023. The PMI fell to 47.9 in August, from 49.0 in July, indicating a stronger downturn in operating conditions at US goods producers. The manufacturing sector has contracted every month since November 2022 except for a brief stabilisation in April, and the latest PMI reading was in line with the average over this period. Four components of the headline figure had negative contributions in August (the exception being employment), and four had negative directional influencescompared with July (the exception being suppliers' delivery times). |
No 9 |
47.9 |
|
Aug-2023 |
|
| |
|
|
|
Decline in manufacturing performance softens in July 2023. The seasonally adjusted S&P Global US Manufacturing Purchasing Managers’ Index™ (PMI™) posted 49.0 in July, up from 46.3 in June, to signal a further but slower downturn in operating conditions at US goods producers. The deterioration was the third in as many months, albeit theweakest in this period of decline. |
No 8 |
49.0 |
|
Jul-2023 |
|
| |
|
|
|
Sharper fall in new orders sparks decline in production. Faster decrease in input costs, with selling prices little-changed. Destocking at manufacturers intensifies. The seasonally adjusted S&P Global US Manufacturing Purchasing Managers’ Index™ (PMI™) posted 46.3 in June, down from 48.4 in May. The index therefore signalled the steepest decline in operating conditions in 2023 so far, as the recent downturn intensified.
|
No 7 |
46.3 |
|
Jun-2023 |
|
| |
|
|
|
The seasonally adjusted S&P Global US Manufacturing Purchasing Managers’ Index™ (PMI™) posted 48.4 in May, down from 50.2 in April, but broadly in line with the earlier released 'flash' estimate of 48.5. The latest figure indicated the fastest deterioration in operating conditions since February. |
No 6 |
48.4 |
|
May-2023 |
|
| |
|
|
|
The seasonally adjusted S&P Global US Manufacturing Purchasing Managers’ Index™ (PMI) posted 50.2 in April 2023, up from 49.2 in March 2023. It posted a slight worse than expected from 50.4. |
No 5 |
50.2 |
|
Apr-2023 |
|
| |
|
|
|
Manufacturing decline eases amid renewed rise in output in March 2023. The seasonally adjusted S&P Global US Manufacturing Purchasing Managers’ Index™ (PMI™) posted 49.2 in March, up from 47.3 in February and broadly in line with the earlier released 'flash' estimate of 49.3. The index reading rose for the third month running to signal the slowest deterioration in operating conditions at US manufacturers in the current five-month sequence of decline. |
No 4 |
49.2 |
|
Mar-2023 |
|
| |
|
|
|
February S&P Global US Final Manufacturing PMI 47.3 Vs. Unrevised 47.8 Expected, January 46.9. US manufacturing remained under intense pressure in February. Although the PMI rose slightly, it continues to signal the steepest downturn outside of pandemic lockdown months since 2009. “Moreover, some of the improvement in output could merely be attributed to faster supplier delivery times, which quickened to the greatest extent since 2009 to facilitate higher production and enable factories to work through previously placed orders. The worry is that new order inflows continue to fall sharply as many companies report disappointing sales, linked in part to a sustained trend towards cost-saving inventory reduction and low levels of confidence at their customers, both at home and abroad. None of this points to a healthy economic situation |
No 3 |
47.3 |
|
Feb-2023 |
|
| |
|
|
|
Further solid decline in manufacturing performance at start of the year. The health of the US manufacturing sector continued to decline at the start of 2023. The seasonally adjusted S&P Global US Manufacturing Purchasing Managers’ Index™ (PMI™) posted 46.9 in January, up slightly from 46.2 in December and broadly in line with the earlier released 'flash' estimate of 46.8. The latest data signalled a solid deterioration in operating conditions across the US manufacturing sector, and one that was the secondfastest since May 2020. |
No 2 |
46.9 |
|
Jan-2023 |
|
| |
|
|
|
The seasonally adjusted S&P Global US Manufacturing Purchasing Managers’ Index™ (PMI) posted 46.7 in Decdember 2022, up 47.7 in November 2022. Consenus was 46.2.5, it came slightly better than consensus. |
No 1 |
46.7 |
|
Dec-2022 |
|
| |
|
|
|
|
|
|
|
|
| |
|
|
|
|
|
| |
|
|
|
|
|
|
|
|
|
|
|
|
|
|
|
Brief News | 2022 |
|
|
PMI Mfg Final | Manufacturing |
|
Today's Week |
|
|
|
|
|
|
|
|
|
|
|
|
|
PMI Manufacturing Final (At 9:45 a.m ET)
| DATE/WEEK |
HIGHLIGHTS |
FOR |
ACTUAL |
|
November sees first deterioration in US manufacturing performance since June 2020. The seasonally adjusted S&P Global US Manufacturing Purchasing Managers’ Index™ (PMI™) posted 47.7 in November, down from 50.4 in October but broadly inline with the earlier released 'flash' estimate of 47.6. The headline index signalled the first decline in the health of the manufacturing sector since June 2020, with operating conditions deteriorating modestly overall. |
No12 |
47.7 |
|
Nov-2022 |
|
| |
|
|
|
Manufacturing output continues to rise, but weak demand conditions dampen growth. The seasonally adjusted S&P Global US Manufacturing Purchasing Managers’ Index™ (PMI™) posted 50.4 in October, down from 52.0 in September, but up from the earlier released 'flash' estimate of 49.9. Nonetheless, the latest index reading indicated the least marked improvement in the health of the US manufacturing sector in the current 28-month sequence of growth. |
No 11 |
50.4 |
|
Oct-2022 |
|
| |
|
|
|
Renewed expansions in output and new orders as cost pressures soften. The seasonally adjusted S&P Global US Manufacturing Purchasing Managers’ Index™ (PMI™) posted 52.0 in September, up from 51.5 in August and broadly in line with the earlier release 'flash' estimate of 51.8. The headline index was above the 50.0 neutral mark, as has been the case for the last 27 months, but continued to signal muted improvements in the health of the manufacturing sector. |
No 10 |
52.0 |
|
Sep-2022 |
|
| |
|
|
|
The seasonally adjusted S&P Global US Manufacturing Purchasing Managers’ Index™ (PMI) posted 51.5 in August 2022, down from 52.2 in July 2022. Consenus was 51.3, it came a little better than consensus.. |
No 9 |
51.5 |
|
Aug-2022 |
|
| |
|
|
|
The seasonally adjusted S&P Global US Manufacturing Purchasing Managers’ Index™ (PMI) posted 52.2 in July 2022, down from 52.7 in June 2022. Consenus was 52.3, it came a little worse than consensus.. |
No 8 |
52.2 |
|
Jul-2022 |
|
| |
|
|
|
PMI falls to near two-year low in June amid contraction in client demand. The seasonally adjusted S&P Global US Manufacturing Purchasing Managers’ Index™ (PMI™) posted 52.7 in June, down notably from 57.0 in May but up slightly on the earlier released 'flash' estimate of 52.4. The latest headline index reading was the lowest for almost two years and pointed to a relatively subdued improvement in operating conditions. |
No 7 |
52.7 |
|
Jun-2022 |
|
| |
|
|
|
May final S&P Global manufacturing PMI 57.0 vs 57.5 est vs 57.5 prior.May final S&P Global manufacturing PMI 57.0 vs 57.5 est vs 57.5 prior. It was expected 57.5. |
No 6 |
57.0 |
|
May-2022 |
|
| |
|
|
|
According to the final version of IHS Markit's April Manufacturing Purchasing Managers Index (PMI) survey, the headline index fell a little to 59.2 versus the flash estimate of 59.7. That suggests that the pace of expansion in US manufacturing remained broadly robust in April. The headlines manufacturing index was 58.8 in March. The final Output Index for April was revised a little higher to 57.6 versus the flash reading of 57.4, while the final Output Prices Index for April was revised a little lower to 76.3 from the flash reading of 78.4, though still sharply higher than March's reading of 69.7. |
No 5 |
59.2 |
|
Apr-2022 |
|
| |
|
|
|
March PMI Manufacturing comes higher than prior month, fastest output growth in 7-months. March PMI Manufacturing Index: 58.8 vs consensus of 58.5 from 57.3 in prior month. Overall growth was supported by faster increases in output and new orders, as domestic and foreign client demand ticked higher. Despite backlogs of work rising at a sharper pace amid greater new sales, firms noted that fewer supply bottlenecks allowed production to expand at a faster rate. Contributing to the overall upturn was a sharper expansion in production at the end of Q1. March data indicated a marked increase in new sales at goods producers, and one that was the sharpest for six months. Output expectations regarding the year ahead strengthened in March. |
No 4 |
58.8 |
|
Mar-2022 |
|
| |
|
|
|
US Markit Manufacturing PMI for February (Final) 57.3% vs 57.5% preliminary. The preliminary estimate was 57.5%. Prior month report (January) was 55.5%. The headline figure was below the peaks seen in 2021, but signalled a stronger upturn in the health of the manufacturing sector, with sharper output and new order expansions contributing to overall growth. Although only modest overall, output rose at a faster pace amid signs of easing supply chain disruption and the sharpest expansion in new orders since last October. |
No 3 |
57.3 |
|
Feb-2022 |
|
| |
|
|
|
January 2022 Markit Manufacturing: Production Growth Constrained. The January US Manufacturing Purchasing Managers' Index conducted by Markit came in at 55.5, down 1.2 from the final December figure. IHS Markit final U.S. manufacturing PMI in January is 55.5 vs preliminary 55. |
No 2 |
55.5 |
|
Jan-2022 |
|
| |
|
|
|
Manufacturing production growth remains constrained by shortages in December. Final Markit US manufacturing PMI revised slightly lower. Jan 3, 2022 — The final reading of the U.S. manufacturing purchasing managers index from IHS Markit was adjusted slightly downward, to a reading of 57.7 . Final Markit Manufacturing PMI fell to 57.7 in December from 58.3 in November. That was slightly below the flash reading of 57.8. According to IHS Markit, final December Manufacturing PMI for the US was 57.7. That marked a slight downwards revision from the flash estimate of 57.8 and was below October's 57.8 reading. |
No 1 |
57.7 |
|
Dec-2021 |
|
| |
|
|
|
|
|
|
|
|
| |
|
|
|
|
|
| |
|
|
|
|
|
|
|
|
|
|
|
|
|
|
|
Brief News | 2021 |
|
|
PMI Mfg Final | Manufacturing |
|
Today's Week |
|
|
|
|
|
|
|
|
|
|
|
|
|
PMI Manufacturing Final (At 9:45 a.m ET)
| DATE/WEEK |
HIGHLIGHTS |
FOR |
ACTUAL |
|
November PMI data from IHS Markit signaled the second-weakest rise in production recorded over the past 14 months as producers reported further near-record supply delays and a slowing of new order inflows to the softest so far this year. Jobs growth also waned amid difficulties filling vacancies. IHS Markit final November U.S. manufacturing PMI drops to 58.4 vs initial 59.1. Dec. 1, 2021 |
No 12 |
58.3 |
|
Nov-2021 |
|
| |
|
|
|
US: Markit Manufacturing PMI declines to 58.4 in October vs. 59.2 expected. US Markit Manufacturing PMI edged lower in October. US Dollar Index stays in a consolidation phase above 94.00. The economic activity in the US manufacturing sector continued to expand in October, albeit at a slightly slower pace than it did in September, with IHS Markit's Manufacturing PMI declining to 58.4 (final) from 60.7. This reading fell short of the flash estimate and the market expectation of 59.2. October saw US manufacturers report yet another near-record lengthening of supply chains, with shortages of components constraining production growth to the lowest since July of last year," noted Chris Williamson, Chief Business Economist at IHS Markit. "Although production growth has now slipped below the pre-pandemic long-run average due to the supply and labor constraints, demand growth – as measured by new order inflows – remains well above trend despite easing in October. |
No 11 |
58.4 |
|
Oct-2021 |
|
| |
|
|
|
Markit manufacturing final PMI 60.7 versus 60.5 preliminary. Manufacturing sector final output index comes in at 55.7 versus flash reading up 55.2. August came in at 56.7. Final input prices index for September comes in at 87.0 versus flash reading of 86.9. August prices came in at 87.5. Prices index decreases from previous month for the first time since January. |
No 10 |
60.7 |
|
Sep-2021 |
|
| |
|
|
|
August final Markit US manufacturing 61.1 PMI vs 61.2 prelimimnary. Final July reading was 63.4. Output index 56.7 vs 59.7 July reading. Prices paid 87.5 vs 86.7 July reading. |
No 9 |
61.1 |
|
Aug-2021 |
|
| |
|
|
|
US: Markit Manufacturing PMI reaches new series-high of 63.4 (final) in July. Markit Manufacturing PMI renewed series high in July. The IHS Markit's Manufacturing PMI reached a new series high of 63.4 in July, up from the flash estimate of 63.1. Commenting on the report, "July saw manufacturers and their suppliers once again struggle to meet booming demand, leading to a further record jump in both raw material and finished goods prices," said Chris Williamson, Chief Business Economist at IHS Markit. |
No 8 |
63.4 |
|
Jul-2021 |
|
| |
|
|
|
US Markit manufacturing PMI for June 62.1 versus 62.6 preliminary. Markit manufacturing PMI (final) 62.1 versus 62.6 preliminary. Although lower than the preliminary, the 62.1 level is still tied for the highest level since the start of the series in May 2007 (last month the index was also at 62.1). May reading came in at 62.1. Firms indicated a solid rise in employment during June. The rate of job creation was the slowest for six months, however, as companies reported difficulties enticing workers back. Labour shortages exacerbated pressure on capacity, as backlogs of work rose at one of the steepest rates on record. |
No 7 |
62.1 |
|
Jun-2021 |
|
| |
|
|
|
New orders for manufactured goods increased at a record pace in May, along with other measures that show the health of the U.S. manufacturing industry jumped sharply as companies responded to strong demand for their products. Overall, the seasonally adjusted IHS Markit U.S. Manufacturing Purchasing Managers' Index reached 62.1 in May, up from 60.5 in April. The increase in business among U.S. manufacturers was among the strongest in the 14-year history of the index. The US Markit manufacturing PMI for May was 62.1, which is expected to be 61.5. |
No 6 |
62.1 |
|
May-2021 |
|
| |
|
|
|
US manufacturing PMI up to 60.5 in April. Manufacturing activity in the United States rose significantly in April when compared to the previous month, a report published by IHS Markit on Monday showed. The seasonally adjusted Manufacturing Purchasing Managers' Index (PMI) was at 60.5 up 1.4 index points from the previous months' 59.1, marking the steepest improvement since data collection began. The rate of expansion for new orders was at an 11-year high, while job creation quickened as the backlog of work accumulated markedly. |
No 5 |
60.5 |
|
Apr-2021 |
|
| |
|
|
|
US: Markit Manufacturing PMI rises to 59.1 (final) in March from 58.6. Markit Manufacturing PMI in US improved modestly in March. The IHS Markit's Manufacturing PMI for the US rose to 59.1 (final) in March from 58.6 in February. This reading came in slightly better than the flash estimate of 59 and showed an ongoing expansion in the manufacturing sector's business activity at a strong pace. The fastest rates of increase for both new orders and prices were reported among producers of consumer goods.. |
No 4 |
59.1 |
|
Mar-2021 |
|
| |
|
|
|
US February final Markit manufacturing PMI 58.6 vs 58.5 expected. US February final Markit manufacturing PMI 58.6 vs 58.5 expected. Prelim was 58.5. Prior was 59.2. The rate of input price inflation accelerated to the sharpest since April 2011. Output prices rise at highest since July 2008. Employment best since Sept 2014 |
No 3 |
58.6 |
|
Feb-2021 |
|
| |
|
|
|
US: Markit Manufacturing PMI rises to 59.2 (final) in January from 57.1. Markit Manufacturing PMI in US continued to rise in January. US Dollar Index clings to strong gains a little below 91.00. The IHS Markit's Manufacturing PMI for the US rose to 59.2 (final) in January from 57.1 in December to show an ongoing expansion in the manufacturing sector's economic activity at a strengthening pace. This reading came in slightly higher than the flash estimate and the market expectation of 59.1. |
No 2 |
59.2 |
|
Jan-2021 |
|
| |
|
|
|
U.S. manufacturing activity picked up at its briskest pace in more than six years in December, extending a recovery in the factory sector that has spurred the strongest pricing environment for goods producers since 2011 as the coronavirus pandemic upends supply chain networks.Still, IHS Markit’s final manufacturing purchasing managers’ survey of a rocky 2020, released on Monday, showed the sector’s rebound was uneven. IHS Markit said its manufacturing PMI climbed to 57.1 in December from 56.7 in November. The index also improved from its preliminary - or “flash” - reading in mid-December of 56.5, with a reading above 50 signaling expansion in activity.The index finished 2020 at its highest level since September 2014, with December’s gain marking the eighth straight month of improvement after plunging to its lowest in more than a decade in April when the first rounds of business shutdowns to contain COVID-19 were in full swing. |
No 1 |
57.1 |
|
Dec-2020 |
|
| |
|
|
|
|
|
|
|
|
| |
|
|
|
|
|
| |
|
Legends: |
|
Delayed |
|
Positive View |
|
Negative View |
|
Neutral View |
|
Non Available |
|
|
|
|
|
|
|
|
|
|
|
|
|
|
|
|
|
|
|
|
| |
|
|
|
|
|
|
|
|
|
|
|
|
|
|
|
|
|
|
|
|
|
Definitions | Explain |
|
|
PMI Mfg Final | Manufacturing |
|
Today's Week |
|
|
|
|
|
|
|
|
|
|
|
|
| |
|
|
|
|
| |
|
| PMI MANUFACTURING FINAL |
US: Markit Manufacturing PMI / S&P Global US Manufacturing PMI
Based on monthly questionnaire surveys of selected companies, the Purchasing Managers' Manufacturing Index (PMI) offers an advance indication on month-to-month activity in the private sector economy by tracking changes in variables such as production, new orders, stock levels, employment and prices across manufacturing industries. The final index for the current month is released roughly a week after the flash.
How to interpret the Chart?
Based on monthly questionnaire surveys of selected companies, the Purchasing Managers' Manufacturing Index (PMI) offers an advance indication on month-to-month activity in the private sector economy by tracking changes in variables such as production, new orders, stock levels, employment and prices across manufacturing industries. The final index for the current month is released roughly a week after the flash.
Investors need to keep their fingers on the pulse of the economy because it dictates how various types of investments will perform.
By tracking economic data such as the ISM manufacturing index in the U.S. and the Markit PMIs in the U.S. and elsewhere, investors will know what the economic backdrop is for the various markets. The stock market likes to see healthy economic growth because that translates to higher corporate profits. The bond market prefers less rapid growth and is extremely sensitive to whether the economy is growing too quickly and causing potential inflationary pressures.
The Markit PMI manufacturing data give a detailed look at the manufacturing sector, how busy it is and where things are headed. Since the manufacturing sector is a major source of cyclical variability in the economy, this report has a big influence on the markets. And its sub-indexes provide a picture of orders, output, employment and prices.
Markit originally began collecting monthly Purchasing Managers' Index (PMI) data in the U.S. in April 2004, initially from a panel of manufacturers in the U.S. electronics goods producing sector. In May 2007, Markit's U.S. PMI research was extended out to cover producers of metal goods. In October 2009, Markit's U.S. Manufacturing PMI survey panel was extended further to cover all areas of U.S. manufacturing activity.
Stock Market Impact
Back data for Markit's U.S. Manufacturing PMI between May 2007 and September 2009 are an aggregation of data collected from producers of electronic goods and metal goods producers, while data from October 2009 are based on data collected from a panel representing the entire U.S. manufacturing economy. Markit's total U.S. Manufacturing PMI survey panel comprises over 600 companies.
Manufacturing PMI in the United States averaged 53.28 points from 2012 until 2021, reaching an all time high of 59.20 points in January of 2021 and a record low of 36.10 points in April of 2020. |
|
|
| |
|
|
|
|
|
| |
|
|
|
|
|
| |
|
|
|
|
|
|
| DATA INFORMATION |
PMI MANUFACTURING FINAL |
| SOURCE |
Institute for Supply Management. |
| WEB |
www.hts.com |
| FREQUENCY |
Monthly |
| AVAILABILITY |
The first business day of the month. |
| COVERAGE |
Data are for the previous month. Data for June are released in July. |
| REVISIONS |
Yes |
| IMPORTANCE |
Manufacturing - Very Important |
|
| |
|
|
|
|
|
|
|
|
|
|
|
|