10-Year Treasury Yield
mmm
PMI Manufacturing Final
US January final S&P Global manufacturing PMI 51.2 vs 50.1 prior.Manufacturers report that political uncertainty has cleared and the pro-business approach from the new administration has brightened their prospects.A new year and a new President has brought new optimism in the US manufacturing sector.
ISM Manudacuring Index
Following 26 consecutive months of contraction, the Institute for Supply Management released a report on Monday showing U.S. manufacturing activity expanded in the month of January. nThe ISM said its manufacturing PMI rose to 50.9 in January from 49.2 in December, with a reading above 50 indicating growth. Economists had expected the index to inch up to 49.8.
mmm
Construction Spending
U.S. construction spending increased more than expected in December, boosted by single-family homebuilding, but high mortgage rates could curb further gains in new residential construction.
The Commerce Department's Census Bureau said on Monday that construction rose 0.5% after an upwardly revised 0.2% increase in November. Economists polled by Reuters had forecast construction spending would advance 0.2% after being previously reported as unchanged in November. Construction spending increased 4.3% on a year-on-year basis in December. It advanced 6.5% in 2024.
US Dollar Index
U.S. dollar edges 1% higher after Trump tariffs. The U.S. dollar advanced nearly 1% on Sunday night, continuing gains since President Donald Trump implemented tariffs over the weekend. The currency is trading near five-year highs.
Factory Orders
US factory orders decline again in December 2024. New orders for U.S.-manufactured goods dropped in December, pulled down by a decline in bookings for civilian aircraft, but demand elsewhere was marginally firm. Factory orders tumbled 0.9% after a revised 0.8% decline in November, the Commerce Department's Census Bureau said on Tuesday. Economists polled by Reuters had forecast factory orders would fall 0.7% after a previously reported 0.4% drop in November. Factory orders were unchanged on a year-on-year basis in December. Manufacturing, which accounts for 10.3% of the economy, has been constrained by the Federal Reserve's aggressive interest rate hikes in 2022 and 2023. It has shown signs of revival as the U.S. central bank started easing monetary policy.
JOLTS
US job openings decline as labor market steadily slows. U.S. job openings fell by the most in 14 months in December, but steady hiring and low layoffs suggested the labor market was not abruptly slowing down and that the Federal Reserve probably can hold off on cutting interest rates until at least June. The Labor Department's Job Openings and Labor Turnover Survey, or JOLTS report, on Tuesday showed there were 1.1 job openings for every unemployed person, down from 1.15 in November. Job openings, a measure of labor demand, had decreased 556,000 to 7.6 million by the last day of December, the Labor Department's Bureau of Labor Statistics said. The decline was the largest since October 2023. The drop in job openings suggested there was no boost from President Donald Trump's Nov. 5 election victory, which saw business sentiment soaring on hopes for tax cuts and a less stringent regulatory environment. Uncertainty about the new administration's policies, including broad tariffs on goods from key trading partners and mass deportations of undocumented migrants, may have made businesses cautious.
Crypto World
As Bitcoin fluctuates between $90,000 and $110,000, traders are contemplating a potential liquidity grab beneath the $90,000 mark, which could trigger the next rally. This scenario would liquidate over-leveraged long positions, providing liquidity for larger investors to establish positions before the anticipated upward trend. BlackRock has enhanced its exposure to Bitcoin by acquiring additional shares in MicroStrategy, raising its total stake to 5% of the company.
MBA Purchase Applications
Mortgage applications increased 2.2 percent from one week earlier.The Market Composite Index, a measure of mortgage loan application volume, increased 2.2 percent on a seasonally adjusted basis from one week earlier. On an unadjusted basis, the Index increased 19 percent compared with the previous week. The Refinance Index increased 12 percent from the previous week and was 17 percent higher than the same week one year ago. The seasonally adjusted Purchase Index decreased 4 percent from one week earlier. The unadjusted Purchase Index increased 15 percent compared with the previous week and was 0.2 percent higher than the same week one year ago.The refinance share of mortgage activity increased to 39.0 percent of total applications from 37.1 percent the previous week. The adjustable-rate mortgage (ARM) share of activity remained unchanged at 5.8 percent of total applications.
ADP Employment Report
U.S. private payrolls growth picked up in January 2025, the ADP National Employment Report showed on Wednesday. Private payrolls increased by 183,000 jobs last month after an upwardly revised 176,000 rise in December. Economists polled by Reuters had forecast private employment advancing by 150,000 following a previously reported 122,000 gain in December. There is no correlation between the ADP and BLS employment report. Private payrolls likely increased by 141,000 jobs in January after rising 223,000 in December. US private payrolls growth picks up in January 2025.
US Trade Balance
US trade deficit widens sharply due to record high imports in Dec 2024. The trade gap increased 24.7 per cent to $98.4 billion, the highest since March 2022, from a revised $78.9 billion in November, the Commerce Department's Bureau of Economic Analysis said. The US trade deficit widened sharply in December as imports surged to a record high against the backdrop of tariff threats, which might have prompted businesses to rush purchases of foreign-made goods like metals and computers. The report from the Commerce Department on Wednesday showed the United States experienced significant deficits with several trade partners, including China, Mexico and Canada, which have been targeted by President Donald Trump's administration for broad or additional tariffs. Trump on Monday suspended a 25 per cent tariff on Mexican and Canadian goods until next month.
PMI Services Final
The S&P Global US Services PMI™ measures the activity level of purchasing mangers in the services sector through a questionnaire of ~400 service sector companies. S&P Global U.S. Services PMI 52.9 vs 52.8 estimated. The Services PMI® registered 52.9 percent. The reading marks the 24th consecutive month of expansion but is the weakest since April. The January 2025 U.S. Services Purchasing Managers' Index (PMI) from S&P Global came in at 52.9, slightly above the 52.8 forecast.
ISM Services Index
US services sector cools in January; price pressures abate. U.S. services sector activity unexpectedly slowed in January amid cooling demand, helping to curb price growth. The Institute for Supply Management (ISM) said on Wednesday its nonmanufacturing purchasing managers index (PMI) slipped to 52.8 last month from 54.0 in December. Economists polled by Reuters had forecast the services PMI edging up to 54.3. A PMI reading above 50 indicates growth in the services sector, which accounts for more than two-thirds of the economy. The ISM associates a PMI reading above 49 over time with expansion in the overall economy. Domestic demand was strong in the fourth quarter, fueled by robust consumer spending.
Commodities - Oil
Oil prices finished with daily gains on Friday after new sanctions were imposed on Iran's crude exports but prices were down for the week as investors worried about U.S. President Donald Trump's renewed trade war on China and threats of tariffs on other countries. Brent crude futures settled at $74.66 a barrel, up 37 cents, or 0.5% and poised to fall more than 2% this week. U.S. West Texas Intermediate crude finished at $71.00 a barrel, up 39 cents, or 0.55%.
Hedging - Gold
Gold’s historic run is gaining momentum, and investors are taking notice. Spot gold hit multiple new record highs and surged past $2,880 per ounce this week, inching closer to the critical $3,000 threshold. The rally has been driven by record central bank demand, geopolitical uncertainty, tariff fears, and a seismic shift in capital flows.
Jobless - Claims
The number of Americans filing new applications for unemployment benefits increased moderately last week, consistent with steadily easing labor market conditions, though opportunities for those out of work are becoming scarce amid tepid hiring. Initial claims for state unemployment benefits rose 11,000 to a seasonally adjusted 219,000 for the week ended February 1, the Labor Department said on Thursday. Economists polled by Reuters had forecast 213,000 claims for the latest week.
Productivity and Costs
Productivity grows at 1.2% rate in fourth quarter. Unit labor costs accelerate at 3.0% pace. U.S. Labor Productivity, Unit Labor Costs Jump Less Than Expected In Q4. A report released by the Labor Department on Thursday showed U.S. labor productivity and unit labor costs both increased by less than expected in the fourth quarter of 2024. The Labor Department said labor productivity shot up by 1.2 percent in the fourth quarter after surging by an upwardly revised 2.3 percent in the third quarter. Economists had expected labor productivity to jump by 1.7 percent. Meanwhile, the report said unit labor costs spiked by 3.0 percent in the third quarter after rising by a downwardly revised 0.5 percent in the third quarter. Economists had expected unit labor costs to soar by 3.8 percent.
Earnings - AMZN
Amazon, feb 06, lost 4% after guidance from the e-commerce giant disappointed investors. The company called for revenue growth of 5% to 9% in the first quarter, its weakest growth on record. The outlook overshadowed top- and bottom-line beats in the fourth quarter. Alphabet continued to fall following somewhat-disappointing results earlier in the week.Amazon issues disappointing revenue forecast, points to weakest growth on record. Here’s what the company reported compared with what Wall Street was expecting: Earnings per share: $1.86 vs. $1.49 expected.Revenue: $187.79 billion vs. $187.30 billion expected.
Earnings Seaon
Earnings growth remains strong. Nearly two-thirds of the companies in the S&P 500 have reported their quarterly earnings this cycle. Their results indicate a strong earnings picture and outlook.The results show around 15% earnings growth now on a yearly basis, putting this reporting season on pace for the strongest quarter in three years. At the start of the year, Wall Street was expecting just under 10% earnings growth. Earnings have also come in 6.4% above consensus estimates.
Fed Balance Sheet
Level $6.854 T. Total Assets -W/W $1.063 B. Reserve Bank Credit - W/W $-12.243 B.
Mortgage Rates
Mortgage rates moved lower last week, consistent with lower Treasury yields following the FOMC meeting and a volatile week for stock market. The 30-year fixed rate declined to its lowest level in six weeks at 6.97 percent. The average contract interest rate for 30-year fixed-rate mortgages with conforming loan balances ($766,550 or less) decreased to 6.97 percent from 7.02 percent, with points increasing to 0.64 from 0.63 (including the origination fee) for 80 percent loan-to-value ratio (LTV) loans. The effective rate decreased from last week.
Non Farm Payroll
U.S. economy added just 143,000 jobs in January but unemployment rate fell to 4%.Nonfarm payrolls in January rose by a seasonally adjusted 143,000 for the month, down from 307,000 in December and below the 169,000 forecast. The unemployment rate nudged lower to 4%. Job growth was concentrated in health care (44,000), retail (34,000) and government (32,000). Wages rose more than expected: Average hourly earnings increased 0.5% for the month and 4.1% from a year ago, compared with respective estimates for 0.3% and 3.7%. The report also featured significant benchmark revisions to the 2024 totals.Nonfarm payrolls climbed by a seasonally adjusted 143,000 for the month, down from an upwardly revised 307,000 in December and below the 169,000 forecast from Dow Jones.The revisions, which the BLS does each year, reduced the jobs count by 589,000 in the 12 months through March 2024. A preliminary adjustment back in August 2024 had indicated 818,000 fewer jobs. Along with the upward revision to the December count, the BLS took up the November total to 261,000, a change of 49,000. The two months together saw upward revisions of 100,000.
Unedmployment Rate
Also released on Friday, January’s jobs report showed the unemployment rate fell to 4% from 4.1% and that average hourly earnings last month were higher than expected.The unemployment rate nudged lower to 4%. The unemployment rate moved lower as labor force participation increased, rising to 62.6%, up 0.1 percentage point from December. A broader measure that includes discouraged workers as well as those holding part-time jobs for economic reasons held steady at 7.5%. While job gains were muted, wages rose more than expected: Average hourly earnings increased 0.5% for the month and 4.1% from a year ago, compared with respective estimates for 0.3% and 3.7%.
Consumer Sentiment
Consumer sentiment fell in February to 67.8, according to a preliminary reading of the University of Michigan’s consumer sentiment index. Economists polled by Dow Jones had expected 71.3.The University of Michigan consumer survey showed that respondents expect inflation a year from now to be 4.3%, a 1 percentage point jump from January and the highest since November 2023. Worries over inflation dovetailed with lower optimism overall, as the headline index fell to 67.8, a one-month drop of 4.6% and an 11.8% move lower from the same month a year ago.The University of Michigan consumer survey for February showed that respondents expect the inflation rate a year from now to be 4.3%, a 1 percentage point jump from January and the highest level since November 2023.
Wholesale Trade Pre
US Wholesale Inventories Remain Steady, Mirroring Forecasts and Previous Figures. Wholesale Inventories in the United States, which measures the change in the total value of goods held in inventory by wholesalers, remained steady. The actual figure reported was a decrease of 0.5%, identical to the forecasted figure. This decrease in inventories is seen as an indicator of the economic health of the country, with lower inventories generally seen as a positive sign for the US dollar. The actual figure of -0.5% matches the forecasted figure, indicating that economists' predictions were spot on.
Consumer Credit
US Consumer Borrowing Surges by $40.8 Billion, Most on Record. Consumer credit growth soars in December Total consumer credit rose $40.8 billion in December, after a $5.4 billion decline in the prior month, the Federal Reserve said Friday. In percentage terms, it is the biggest gain since June 2022. Revolving credit, typically credit-card debt, made up most of the increase, rising at a 20.2% annual rate. That follows a 12.1% drop in the prior month. US consumer debt outstanding unexpectedly surged by the most on record in December, reflecting massive increases in credit-card balances and non-revolving credit. Total credit jumped $40.8 billion after a revised $5.4 billion decrease a month earlier, according to Federal Reserve data released Friday. The figure, which isn’t adjusted for inflation, topped all estimates in a Bloomberg survey of econo
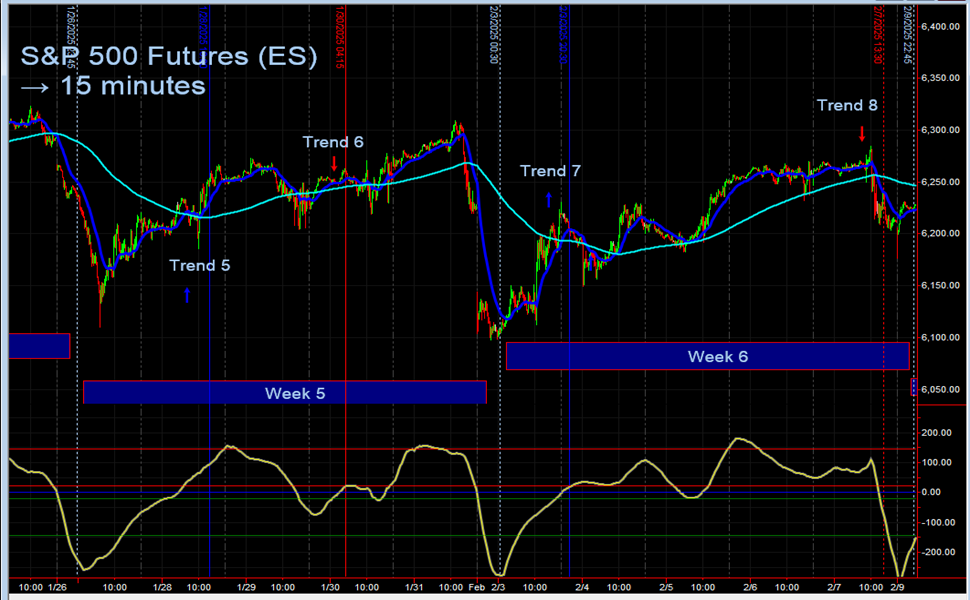
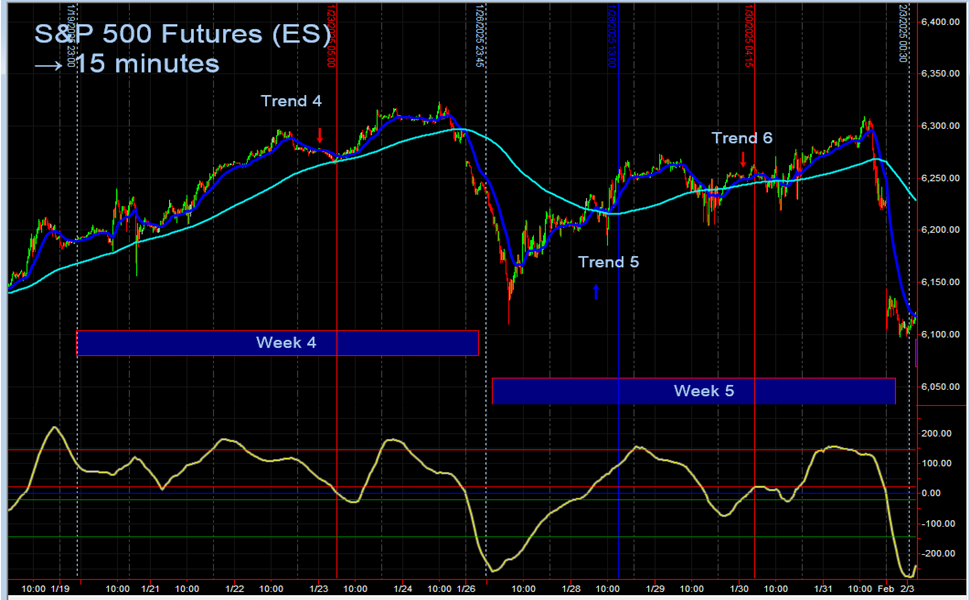
S&P Index
Open 2025 week 02 at 5,902 and close at 5,827. Negative -2.60%
Geopolitical Risk
Dow closes 400 points lower Friday as inflation and tariff fears spur a sell-off. Stuck stock market is worried about economic growth as Trump’s tariffs dominate headlines. Major benchmarks took a leg lower during the session after President Donald Trump said he was planning reciprocal tariffs on trading partners. This could mean raising tariff levels across the board to equal rates charged to the U.S.
It has been a volatile week. Stocks fell on Monday after President Donald Trump over the weekend announced 10% tariffs on China. He also proposed, then later paused, 25% levies on Canada and Mexico. The S&P 500 then gained for three straight days on the tariff reprieve before falling again on Friday.. Consumers grew dramatically more worried about near-term inflation as President Donald Trump pushed aggressive tariffs against major U.S. trading partners, a closely watched survey showed Friday.
|