|
 |
|
 |
PMI Services Final | Business Activity |
|
 |
|
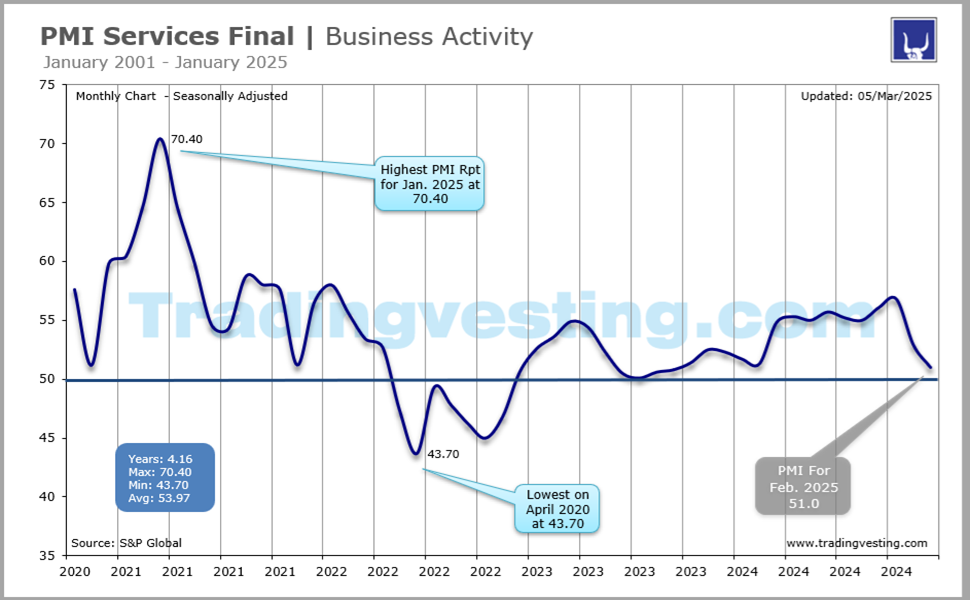
US Services Purchasing Managers' Index (PMI) provides a leading indication of what is happening in the private sector services economy. PMI Composite Final refers to the private sector output and the rate of output growth. Read more...
|
|
|
|
|
|
|
| |
|
| |
 1. PMI Services Final ( 1 of 5 ) 1. PMI Services Final ( 1 of 5 ) 2. Productivity and Costs ( 2 of 5 ) 2. Productivity and Costs ( 2 of 5 ) 3. ISM Services Index (3 of 5) 3. ISM Services Index (3 of 5) 4. Leading Indicators (4 of 5) 4. Leading Indicators (4 of 5) 5. Chicago Fed National Activity Index ( 5 of 5 ) 5. Chicago Fed National Activity Index ( 5 of 5 )
|
 |
|
|
|
|
| |
|
→ Big Chart |
|
→ Release |
|
| |
|
|
|
|
|
|
|
| |
| Markit Economic Reports |
PMI Markit Reports
1. PMI Services Final - PMI Composite - Business Activity (3rd of month)
US Services Purchasing Managers' Index (PMI)
Provide a leading indication of what is happening in the private sector services economy.
A composite PMI™ is the weighted average of manufacturing and service sector PMIs for a given geography or economy, produced by S&P Global. Weights are derived from official data relating to each sector’s contribution to GDP (value added).
1- Composite
2- Services (This is the important figure)
2. PMI Manufacturing Final - Manufacturing (1st of month)
The Markit PMI manufacturing data.
The seasonally adjusted S&P Global US Manufacturing Purchasing Managers’ Index™ (PMI)
1- Prev Flash
2- Index (This is the important figure)
3. PMI Manufacturing Flash - Manufacturing (24th of month)
PMI Composite Flash
10 days ahead of the final report
The flash Composite Purchasing Managers' Index (PMI)
The data are produced by IHS Markit.
Flash PMI™ (Purchasing Managers’ Index™) data are published by S&P Global and are early estimates of the company’s final PMI numbers. The Flash PMI data are published approximately one week before final PMI data each month and are typically based on 85%-90% of total PMI responses received each month.
1- Composite
2- Services
3- Manufacturing (This is the important figure)
|
|
|
| |
|
|
|
| |
|
|
|
|
|
|
|
|
|
|
|
|
|
|
|
|
|
|
|
 |
|
Big Chart | Large Data |
 |
|
PMI Services Final | Business Activity |
|
Today's Week |
 |
|
|
|
|
|
|
|
|
|
|
|
|
|
| |
|
|
|
|
|
|
|
|
|
|
|
|
|
|
|
|
|
|
|
|
|
Slides | Five 5 |
|
|
PMI Services Final | Business Activity |
|
Today's Week |
|
|
|
|
|
|
|
|
|
|
|
|
|
|
| |
|
|
|
|
|
|
|
|
|
|
|
|
|
|
|
|
|
|
|
|
|
Release Schedule | 2026 |
|
|
PMI Services Final | Business Activity |
|
Today's Week |
|
|
|
|
|
|
|
|
|
|
|
|
|
PMI Services Final (At 9:45 a.m ET)
| SCHEDULE 2026 |
No 1 |
No 2 |
No 3 |
No 4 |
No 5 |
No 6 |
No 7 |
No 8 |
No 9 |
No 10 |
No 11 |
No 12 |
| Release | Week |
|
|
|
|
|
|
|
|
|
|
|
|
| Release | Date |
|
|
|
|
|
|
|
|
|
|
|
|
| Release | Day |
|
|
|
|
|
|
|
|
|
|
|
|
 |
|
|
|
|
|
|
|
|
|
|
|
|
| Prior |
54.2 |
52.7 |
53.0 |
51.9 |
50.3 |
51.7 |
... |
... |
... |
... |
... |
... |
| Flash Composite |
53.0 |
52.8 |
52.3 |
51.4 |
52.0 |
51.7 |
... |
... |
... |
... |
... |
... |
| CONSENSUS |
53.0 |
52.8 |
... |
... |
52.0 |
51.7 |
... |
... |
... |
... |
... |
... |
| Consensus Low |
53.0 |
52.8 |
... |
... |
52.0 |
51.7 |
... |
... |
... |
... |
... |
... |
| Consensus High |
53.0 |
52.8 |
... |
... |
52.0 |
51.7 |
... |
... |
... |
... |
... |
... |
| COMPOSITE |
52.7 |
53.0 |
51.9 |
50.3 |
51.7 |
51.5 |
... |
... |
... |
... |
... |
... |
| Rating |
Dec-25 |
Jan-26 |
Feb-26 |
Mar-26 |
Apr-26 |
May-26 |
Jun-26 |
Jul-26 |
Aug-26 |
Sep-26 |
Oct-26 |
Nov-26 |
|
|
|
|
|
|
|
|
|
|
|
|
|
| SERVICES |
No 1 |
No 2 |
No 3 |
No 4 |
No 5 |
No 6 |
No 7 |
No 8 |
No 9 |
No 10 |
No 11 |
No 12 |
| Prev Services |
54.1 |
52.5 |
52.7 |
51.7 |
49.8 |
51.0 |
... |
... |
... |
... |
... |
... |
| Flash Services |
52.9 |
52.5 |
52.3 |
51.1 |
51.3 |
50.9 |
... |
... |
... |
... |
... |
... |
| CONSENSUS |
52.9 |
52.5 |
... |
... |
52.1 |
50.9 |
... |
... |
... |
... |
... |
... |
| Consensus Low |
52.9 |
52.5 |
... |
... |
... |
50.9 |
... |
... |
... |
... |
... |
... |
| Consensus High |
52.9 |
52.5 |
... |
... |
... |
50.9 |
... |
... |
... |
... |
... |
... |
| SERVICES INDEX |
52.5 |
52.7 |
51.7 |
49.8 |
51.0 |
50.7 |
... |
... |
... |
... |
... |
... |
| Rating |
|
|
|
|
|
|
|
|
|
|
|
|
| Month For |
Dec-25 |
Jan-26 |
Feb-26 |
Mar-26 |
Apr-26 |
May-26 |
Jun-26 |
Jul-26 |
Aug-26 |
Sep-26 |
Oct-26 |
Nov-26 |
|
|
|
|
|
|
|
|
|
|
|
|
|
|
|
| |
|
| |
|
|
|
|
|
|
|
|
|
|
|
Release Schedule | 2025 |
|
|
PMI Services Final | Business Activity |
|
Today's Week |
|
|
|
|
|
|
|
|
|
|
|
|
|
PMI Services Final (At 9:45 a.m ET)
| SCHEDULE 2025 |
No 1 |
No 2 |
No 3 |
No 4 |
No 5 |
No 6 |
No 7 |
No 8 |
No 9 |
No 10 |
No 11 |
No 12 |
| Release | Week |
|
|
|
|
|
|
|
|
|
|
|
|
| Release | Date |
|
|
|
|
|
|
|
|
|
|
|
|
| Release | Day |
|
|
|
|
|
|
|
|
|
|
|
|
|
|
|
|
|
|
|
|
|
|
|
|
|
| Prior |
54.9 |
55.4 |
52.7 |
51.6 |
53.5 |
50.6 |
53.0 |
52.9 |
55.1 |
54.6 |
53.9 |
54.6 |
| Flash Composite |
56.6 |
52.4 |
50.4 |
53.5 |
51.2 |
52.1 |
52.8 |
54.6 |
55.4 |
53.6 |
54.8 |
54.8 |
| CONSENSUS |
... |
... |
50.4 |
... |
51.2 |
52.1 |
... |
54.6 |
55.4 |
... |
54.8 |
54.8 |
| Consensus Low |
... |
... |
50.4 |
... |
51.2 |
52.1 |
... |
54.6 |
55.4 |
... |
54.8 |
54.8 |
| Consensus High |
... |
... |
50.4 |
... |
51.2 |
52.1 |
... |
54.6 |
55.4 |
... |
54.8 |
54.8 |
| COMPOSITE |
55.4 |
52.7 |
51.6 |
53.5 |
50.6 |
53.0 |
52.9 |
55.1 |
54.6 |
53.9 |
54.6 |
54.2 |
| Rating |
Dec-24 |
Jan-25 |
Feb-25 |
Mar-25 |
Apr-25 |
May-25 |
Jun-25 |
Jul-25 |
Aug-25 |
Sep-25 |
Oct-25 |
Nov-25 |
|
|
|
|
|
|
|
|
|
|
|
|
|
| SERVICES |
No 1 |
No 2 |
No 3 |
No 4 |
No 5 |
No 6 |
No 7 |
No 8 |
No 9 |
No 10 |
No 11 |
No 12 |
| Prev Services |
56.1 |
56.8 |
52.9 |
51.0 |
54.4 |
50.8 |
53.7 |
52.9 |
55.7 |
54.5 |
54.2 |
54.8 |
| Flash Services |
58.5 |
52.8 |
49.7 |
54.3 |
51.4 |
52.3 |
53.1 |
55.2 |
55.4 |
53.9 |
55.2 |
55.0 |
| CONSENSUS |
58.5 |
52.8 |
49.7 |
54.3 |
51.4 |
52.3 |
53.1 |
55.2 |
55.4 |
53.9 |
55.2 |
55.0 |
| Consensus Low |
57.1 |
52.8 |
49.7 |
54.3 |
51.4 |
52.3 |
51.8 |
55.2 |
55.4 |
52.7 |
55.2 |
55.0 |
| Consensus High |
58.5 |
52.8 |
49.7 |
54.3 |
51.4 |
52.3 |
53.1 |
55.2 |
55.4 |
53.9 |
55.2 |
55.0 |
| SERVICES INDEX |
56.8 |
52.9 |
51.0 |
54.4 |
50.8 |
53.7 |
52.9 |
55.7 |
54.5 |
54.2 |
54.8 |
54.1 |
| Rating |
|
|
|
|
|
|
|
|
|
|
|
|
| Month For |
Dec-24 |
Jan-25 |
Feb-25 |
Mar-25 |
Apr-25 |
May-25 |
Jun-25 |
Jul-25 |
Aug-25 |
Sep-25 |
Oct-25 |
Nov-25 |
|
|
| Note: we take into consideration the Service and not the composite |
|
| |
|
|
|
|
|
|
|
|
|
|
|
Release Schedule | 2024 |
|
|
PMI Services Final | Business Activity |
|
Today's Week |
|
|
|
|
|
|
|
|
|
|
|
|
|
PMI Services Final (At 9:45 a.m ET)
| SCHEDULE 2024 |
No 1 |
No 2 |
No 3 |
No 4 |
No 5 |
No 6 |
No 7 |
No 8 |
No 9 |
No 10 |
No 11 |
No 12 |
| Release | Week |
|
|
|
|
|
|
|
|
|
|
|
|
| Release | Date |
|
|
|
|
|
|
|
|
|
|
|
|
| Release | Day |
|
|
|
|
|
|
|
|
|
|
|
|
|
|
|
|
|
|
|
|
|
|
|
|
|
| Prior |
50.7 |
50.9 |
52.0 |
52.5 |
52.1 |
51.3 |
54.5 |
54.8 |
54.3 |
54.6 |
54.0 |
54.1 |
| Prior Revised |
51.0 |
52.3 |
51.4 |
52.2 |
50.9 |
54.4 |
54.6 |
55.0 |
54.1 |
54.4 |
54.3 |
55.3 |
| CONSENSUS |
51.0 |
52.3 |
51.4 |
52.2 |
50.9 |
54.4 |
54.6 |
55.0 |
54.1 |
... |
... |
55.3 |
| Consensus Low |
51.0 |
... |
51.4 |
52.2 |
50.9 |
54.4 |
... |
55.0 |
54.1 |
... |
... |
55.3 |
| Consensus High |
51.0 |
... |
51.4 |
52.2 |
50.9 |
54.4 |
... |
55.0 |
54.1 |
... |
... |
55.3 |
| PMI SRVCS M/M |
50.9 |
52.0 |
52.5 |
52.1 |
51.3 |
54.5 |
54.8 |
54.3 |
54.6 |
54.0 |
54.1 |
54.9 |
| Month For |
Dec-23 |
Jan-24 |
Feb-24 |
Mar-24 |
Apr-24 |
May-24 |
Jun-24 |
Jul-24 |
Aug-24 |
Sep-24 |
Oct-24 |
Nov-24 |
| Rating |
|
|
|
|
|
|
|
|
|
|
|
|
|
|
|
|
|
|
|
|
|
|
|
|
|
| SERVICES |
No 1 |
No 2 |
No 3 |
No 4 |
No 5 |
No 6 |
No 7 |
No 8 |
No 9 |
No 10 |
No 11 |
No 12 |
| Prev Services |
50.8 |
51.4 |
52.5 |
52.3 |
51.7 |
51.3 |
54.8 |
55.3 |
55.0 |
55.7 |
55.2 |
55.0 |
| Flash |
51.3 |
52.9 |
51.3 |
51.7 |
51.7 |
54.8 |
55.1 |
56.0 |
55.2 |
55.4 |
55.3 |
57.0 |
| CONSENSUS |
51.3 |
52.9 |
51.3 |
51.7 |
50.9 |
54.8 |
55.1 |
56.0 |
55.2 |
... |
... |
57.0 |
| Consensus Low |
51.3 |
52.9 |
51.3 |
51.7 |
50.9 |
54.8 |
55.1 |
55.9 |
55.2 |
... |
... |
57.0 |
| Consensus High |
51.3 |
52.9 |
51.3 |
52.5 |
50.9 |
54.8 |
55.1 |
56.0 |
55.2 |
... |
... |
57.0 |
| SERVICES |
51.4 |
52.5 |
52.3 |
51.7 |
51.3 |
54.8 |
55.3 |
55.0 |
55.7 |
55.2 |
55.0 |
56.1 |
| Month For |
Dec-23 |
Jan-24 |
Feb-24 |
Mar-24 |
Apr-24 |
May-24 |
Jun-24 |
Jul-24 |
Aug-24 |
Sep-24 |
Oct-24 |
Nov-24 |
|
|
|
|
|
|
|
|
|
|
|
|
|
|
|
| |
|
| |
|
|
|
|
|
|
|
|
|
|
|
Release Schedule | 2023 |
|
|
PMI Services Final | Business Activity |
|
Today's Week |
|
|
|
|
|
|
|
|
|
|
|
|
|
PMI Services Final (At 9:45 a.m ET)
| SCHEDULE 2023 |
No 1 |
No 2 |
No 3 |
No 4 |
No 5 |
No 6 |
No 7 |
No 8 |
No 9 |
No 10 |
No 11 |
No 12 |
| Release | Week |
|
|
|
|
|
|
|
|
|
|
|
|
| Release | Date |
|
|
|
|
|
|
|
|
|
|
|
|
| Release | Day |
|
|
|
|
|
|
|
|
|
|
|
|
|
|
|
|
|
|
|
|
|
|
|
|
|
| Prev Composite: |
46.4 |
45.0 |
46.8 |
53.3 |
52.3 |
53.5 |
54.3 |
53.2 |
52.0 |
50.2 |
50.2 |
50.7 |
| CONSENSUS |
44.6 |
46.6 |
52.0 |
53.3 |
... |
54.5 |
53.0 |
52.0 |
50.4 |
50.1 |
51.0 |
50.7 |
| Consensus Low: |
... |
... |
... |
... |
... |
54.5 |
... |
... |
... |
50.1 |
... |
... |
| Consensus High: |
... |
... |
... |
... |
... |
54.5 |
... |
... |
... |
50.1 |
... |
... |
| COMPOSITE |
45.0 |
46.8 |
53.3 |
52.3 |
53.5 |
54.3 |
53.2 |
52.0 |
50.2 |
50.2 |
50.7 |
50.7 |
| Month For: |
Dec-22 |
Jan-23 |
Feb-23 |
Mar-23 |
Apr-23 |
May-23 |
Jun-23 |
Jul-23 |
Aug-23 |
Sep-23 |
Oct-23 |
Nov-23 |
| RATING |
|
|
|
|
|
|
|
|
|
|
|
|
|
|
|
|
|
|
|
|
|
|
|
|
|
| SERVICES |
No 1 |
No 2 |
No 3 |
No 4 |
No 5 |
No 6 |
No 7 |
No 8 |
No 9 |
No 10 |
No 11 |
No 12 |
| Consensus Srvc |
44.4 |
... |
50.5 |
50.5 |
53.7 |
55.1 |
54.1 |
52.4 |
51.0 |
50.2 |
... |
50.8 |
| Consensus Low: |
44.4 |
... |
50.5 |
50.5 |
50.0 |
55.1 |
53.8 |
52.4 |
51.0 |
50.2 |
... |
50.8 |
| Consensus High: |
44.4 |
... |
50.5 |
50.5 |
53.7 |
55.3 |
54.1 |
52.4 |
52.5 |
50.2 |
... |
50.8 |
| SERVICES |
45.0 |
46.8 |
50.6 |
52.6 |
53.6 |
54.9 |
54.4 |
52.3 |
50.5 |
50.1 |
50.6 |
50.8 |
| Month For: |
Dec-22 |
Jan-23 |
Feb-23 |
Mar-23 |
Apr-23 |
May-23 |
Jun-23 |
Jul-23 |
Aug-23 |
Sep-23 |
Oct-23 |
Nov-23 |
|
|
|
|
|
|
|
|
|
|
|
|
|
|
|
| |
|
| |
|
|
|
|
|
|
|
|
|
|
|
Release Schedule | 2022 |
|
|
Chicago Fed Nat Index | Business Activity |
|
Today's Week |
|
|
|
|
|
|
|
|
|
|
|
|
|
PMI Services Final (At 9:45 a.m ET)
| SCHEDULE 2022 |
No 1 |
No 2 |
No 3 |
No 4 |
No 5 |
No 6 |
No 7 |
No 8 |
No 9 |
No 10 |
No 11 |
No 12 |
| Release | Week |
|
|
|
|
|
|
|
|
|
|
|
|
| Release | Date |
|
|
|
|
|
|
|
|
|
|
|
|
| Release | Day |
|
|
|
|
|
|
|
|
|
|
|
|
|
|
|
|
|
|
|
|
|
|
|
|
|
| Prev Composite: |
57.2 |
57.0 |
51.1 |
55.9 |
57.7 |
56.0 |
53.3 |
52.3 |
47.7 |
44.6 |
49.5 |
48.2 |
| Consensus: |
56.9 |
50.8 |
56.0 |
58.5 |
55.1 |
53.8 |
52.4 |
47.5 |
45.0 |
49.3 |
47.3 |
46.3 |
| COMPOSITE |
57.0 |
51.1 |
55.9 |
57.7 |
56.0 |
53.3 |
52.3 |
47.7 |
44.6 |
49.5 |
48.2 |
46.4 |
| Month For: |
Dec-21 |
Jan-22 |
Feb-22 |
Mar-22 |
Apr-22 |
May-22 |
Jun-22 |
Jul-22 |
Aug-22 |
Sep-22 |
Oct-22 |
Nov-22 |
| RATING |
|
|
|
|
|
|
|
|
|
|
|
|
|
|
|
|
|
|
|
|
|
|
|
|
|
| SERVICES |
No 1 |
No 2 |
No 3 |
No 4 |
No 5 |
No 6 |
No 7 |
No 8 |
No 9 |
No 10 |
No 11 |
No 12 |
| Consensus Srvc |
57.5 |
50.9 |
56.7 |
58.9 |
54.7 |
... |
51.6 |
47.0 |
44.1 |
49.2 |
46.6 |
46.3 |
| SERVICES |
57.6 |
51.2 |
56.5 |
58.0 |
55.6 |
53.4 |
52.7 |
47.3 |
43.7 |
49.3 |
47.8 |
46.2 |
| Month For: |
Dec-21 |
Jan-22 |
Feb-22 |
Mar-22 |
Apr-22 |
May-22 |
Jun-22 |
Jul-22 |
Aug-22 |
Sep-22 |
Oct-22 |
Nov-22 |
|
|
|
|
|
|
|
|
|
|
|
|
|
|
|
| |
|
| |
|
|
|
|
|
|
|
|
|
|
|
Release Schedule | 2021 |
|
|
PMI Services Final | Business Activity |
|
Today's Week |
|
|
|
|
|
|
|
|
|
|
|
|
|
PMI Services Final (At 9:45 a.m ET)
| SCHEDULE 2022 |
No 1 |
No 2 |
No 3 |
No 4 |
No 5 |
No 6 |
No 7 |
No 8 |
No 9 |
No 10 |
No 11 |
No 12 |
| Release | Week |
|
|
|
|
|
|
|
|
|
|
|
|
| Release | Date |
|
|
|
|
|
|
|
|
|
|
|
|
| Release | Day |
|
|
|
|
|
|
|
|
|
|
|
|
|
|
|
|
|
|
|
|
|
|
|
|
|
| Prev Composite: |
58.6 |
55.3 |
58.7 |
59.5 |
59.7 |
63.5 |
68.7 |
63.7 |
59.9 |
55.4 |
55.0 |
57.6 |
| Consensus: |
55.7 |
58.0 |
58.8 |
58.1 |
62.2 |
68.1 |
63.5 |
59.7 |
54.4 |
54.5 |
57.3 |
56.5 |
| COMPOSITE |
55.3 |
58.7 |
59.5 |
59.7 |
63.5 |
68.7 |
63.7 |
59.9 |
55.4 |
55.0 |
57.6 |
57.2 |
| Month For: |
Dec-20 |
Jan-21 |
Feb-21 |
Mar-21 |
Apr-21 |
May-21 |
Jun-21 |
Jul-21 |
Aug-21 |
Sep-21 |
Oct-21 |
Nov-21 |
| RATING |
|
|
|
|
|
|
|
|
|
|
|
|
|
|
|
|
|
|
|
|
|
|
|
|
|
| SERVICES |
No 1 |
No 2 |
No 3 |
No 4 |
No 5 |
No 6 |
No 7 |
No 8 |
No 9 |
No 10 |
No 11 |
No 12 |
| Consensus |
... |
50.9 |
58.9 |
60.0 |
63.1 |
70.1 |
... |
59.8 |
... |
54.4 |
54.9 |
57.0 |
| SERVICE |
57.6 |
51.2 |
59.8 |
60.4 |
64.7 |
70.4 |
64.6 |
59.9 |
54.6 |
54.3 |
58.7 |
58.0 |
| Month For: |
Dec-20 |
Jan-21 |
Feb-21 |
Mar-21 |
Apr-21 |
May-21 |
Jun-21 |
Jul-21 |
Aug-21 |
Sep-21 |
Oct-21 |
Nov-21 |
|
|
|
|
|
|
|
|
|
|
|
|
|
|
|
| |
|
| |
|
Legends: |
 |
Delayed |
 |
Positive View |
 |
Negative View |
 |
Neutral View |
 |
Non Available |
|
|
|
|
|
|
|
|
|
|
|
|
|
|
|
|
|
|
|
|
| |
|
|
|
|
|
|
|
|
|
|
|
|
|
|
|
|
|
|
|
|
|
Brief News | 2026 |
|
|
PMI Services Final | Business Activity |
|
Today's Week |
|
|
|
|
|
|
|
|
|
|
|
|
|
PMI Services Final (At 9:45 a.m ET)
| DATE/WEEK |
HIGHLIGHTS |
FOR |
SRVCS |
|
USComposite PMI |
No 12 |
... |
|
Nov-2026 |
|
| |
|
|
|
USComposite PMI |
No 11 |
... |
|
Oct-2026 |
|
| |
|
|
|
USComposite PMI |
No 10 |
... |
|
Sep-2026 |
|
| |
|
|
|
USComposite PMI
|
No 9 |
... |
|
Aug-2026 |
|
| |
|
|
|
USComposite PMI |
No 8 |
... |
|
Jul-2026 |
|
| |
|
|
|
USComposite PMI |
No 7 |
... |
|
Jun-2026 |
|
| |
|
|
|
USComposite PMI |
No 6 |
... |
|
May-2026 |
|
| |
|
|
|
USComposite PMI |
No 5 |
... |
|
Apr-2026 |
|
| |
|
|
|
USComposite PMI |
No 4 |
... |
|
Mar-2026 |
|
| |
|
|
|
USComposite PMI |
No 3 |
... |
|
Feb-2026 |
|
| |
|
|
|
USComposite PMI |
No 2 |
... |
|
Jan-2026 |
|
| |
|
|
|
US private activity growth in December was revised down to its lowest rate in eight months, according to S&P Global, with both the manufacturing and services sectors slowing over the month. The final estimate of the S&P Global US composite purchasing managers' index came in at 52.7 last month, down from the initial reading of 53.0 and the 54.2 mark registered in November. This was the lowest rate of growth – indicated by any reading above 50 – since April.The services PMI was revised to 52.5 from 52.9, well below the 54.1 recorded in November, also marking an eight-month low. |
No 1 |
52.5 |
|
Dec-2026 |
|
| |
|
|
|
|
|
|
|
|
| |
|
|
|
|
|
| |
|
|
|
|
|
|
|
|
|
|
|
|
|
|
|
Brief News | 2025 |
|
|
PMI Services Final | Business Activity |
|
Today's Week |
|
|
|
|
|
|
|
|
|
|
|
|
|
PMI Services Final (At 9:45 a.m ET)
| DATE/WEEK |
HIGHLIGHTS |
FOR |
SRVCS |
|
The S&P Global US Services PMI was finalized at 54.1 in November 2025, down from 54.8 in October, indicating a continued but slightly moderated expansion in the service sector. While below preliminary estimates of 55.0, the reading reflected solid growth driven by new business orders and improved business confidence, despite rising cost pressures. |
No 12 |
54.1 |
|
Nov-2025 |
|
| |
|
|
|
The S&P Global US Services PMI Business Activity Index for October 2025 was recorded at 54.8, rising from 54.2 in September. This figure indicated a solid rate of growth for the 33rd consecutive month, driven by stronger, though slightly revised, business activity. The sector saw sustained, robust demand despite ongoing cost pressures and lingering policy uncertainties. |
No 11 |
54.8 |
|
Oct-2025 |
|
| |
|
|
|
The S&P Global US Composite PMI for September 2025 was released with a final reading of 54.2, indicating a continuation of economic expansion. This figure represents a slight decrease from the previous month's reading of 54.5 and is higher than the preliminary estimate. The overall composite index combines manufacturing and services sector data to provide a broader view of the U.S. private sector economy. |
No 10 |
54.2 |
|
Sep-2025 |
|
| |
|
|
|
The August U.S. Services Purchasing Managers' Index (PMI) from S&P Global came in at 54.5, below the 55.4 forecast. The reading marks the 31st consecutive month of expansion and the second strongest growth of 2025 so far. S&P Global Services PMI: Growth Remains Positive in August
|
No 9 |
54.5 |
|
Aug-2025 |
|
| |
|
|
|
The S&P Global US Services PMI® Business Activity Index rose to a seven-month high of 55.7 in July, up from 52.9 in June. The latest reading signaled a marked monthly expansion of output in the service sector, extending the current sequence of growth to two-and-a-half years. |
No 8 |
55.7 |
|
Jul-2025 |
|
| |
|
|
|
The S&P Global US Services PMI® Business Activity Index registered 52.9 in June. That was down from 53.7 in May to represent a slightly slower, but still solid, increase in activity. Growth has now been recorded for 29 successive months though remains noticeably slower when compared to the marked increases seen in the second half of 2024. |
No 7 |
52.9 |
|
Jun-2025 |
|
| |
|
|
|
The S&P Global US Services PMI® Business Activity Index recorded 53.7 during May, which was stronger than the earlier 'flash' reading of 52.3. The index was also up on April's 50.8 and, being comfortably above the critical 50.0 no-change mark, was indicative of a noticeable acceleration of activity growth on April’s 17-month low. Moreover, activity has now risen on a consecutive monthly basis since February 2023. |
No 6 |
53.7 |
|
May-2025 |
|
| |
|
|
|
The S&P Global final Services PMI for April 2025 in the US is 50.8. This figure is below the preliminary reading of 51.4 and signals a weaker expansion in the services sector compared to previous expectations. It also represents a 17-month low for the index. The final reading of 50.8 is lower than the preliminary reading of 51.4, indicating a downward revision. |
No 5 |
50.8 |
|
Apr-2025 |
|
| |
|
|
|
The S&P Global US Services PMI for March 2025 was 54.4. This indicates a solid expansion in the US service sector. The figure is a final reading, meaning it is the definitive result based on all survey responses, and it is consistent with a strong rebound in business activity. The 54.4 figure is the final, confirmed result for the S&P Global US Services PMI in March 2025. |
No 4 |
54.4 |
|
Mar-2025 |
|
| |
|
|
|
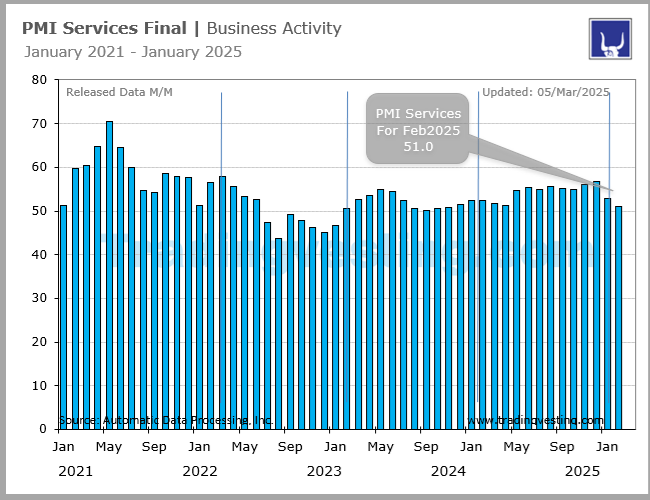
The final S&P Global Services PMI for the US in February 2025 was 51.0. This indicates a continued expansion of the services sector, although the growth rate slowed compared to the previous month. The final reading exceeded the initial flash estimate of 49.7. The final PMI reading of 51.0 is significantly higher than the flash estimate of 49.7, suggesting the initial assessment was more pessimistic. |
No 3 |
51.0 |
|
Feb-2025 |
|
| |
|
|
|
The seasonally adjusted S&P Global US Services PMI® Business Activity Index posted 52.9 in January, down markedly from 56.8 in December but still signaling a solid monthly expansion in business activity in the service sector. Output has now increased on a monthly basis throughout the past two years, with the latest rise generally reflecting sustained new order growth |
No 2 |
52.9 |
|
Jan-2025 |
|
| |
|
|
|
US December S&P Global final services PMI 56.8 vs 58.5 preliminary. This is still the best reading since March 2022, though not as good as it initially looked. The strong service sector PMI reading for December sets the US economy up for a good start to 2025 but, with growth as strong as this, it’s understandable that policymakers are taking a more cautious approach to lowering interest rates. However, a key focus in the coming months will be the potential vulnerability of the economy to any major change in the interest rate outlook, especially as financial services activity has been an important engine of growth in late 2024, partly on the anticipation of a further lowering of borrowing costs. |
No 1 |
56.8 |
|
Dec-2024 |
|
| |
|
|
|
|
|
|
|
|
| |
|
|
|
|
|
| |
|
|
|
|
|
|
|
|
|
|
|
|
|
|
|
Brief News | 2024 |
|
|
PMI Services Final | Business Activity |
|
Today's Week |
|
|
|
|
|
|
|
|
|
|
|
|
|
PMI Services Final (At 9:45 a.m ET)
| DATE/WEEK |
HIGHLIGHTS |
FOR |
COMPO |
|
Combined manufacturing and service sectors, the S&P Global USComposite PMI Output Index.The seasonally adjusted S&P Global US Services PMI® Business Activity Index rose to 56.1 in November, up from 55.0 and above the 50.0 neutral mark for the twenty-second consecutive month. The latest expansion was the fastest since March 2022, fueled by the largest rise in new business in just over two-and-a-half years. |
No 12 |
54.9 |
|
Nov-2024 |
|
| |
|
|
|
The S&P Global US Composite PMI Output Index ticked up to 54.1 in October from 54.0 in September, registering a further solid increased. US service providers continued to expand their business activity at a marked pace as the final quarter of the year got underway. New orders grew at a solid pace that was broadly in line with that seen in September, despite signs of weaker international demand. Business activity expectations revived from a 23-month low in September. Firms nevertheless continued to scale back staffing levels marginally amid uncertainty over future demand. On the price front, companies raised their charges at the joint-slowest pace in almost four-and-a-half years, in spite of a further sharp increase in input costs. The seasonally adjusted S&P Global US Services PMI® Business Activity Index signaled further strong growth of service sector output in October, ticking down only slightly to 55.0 from 55.2 in September. Activity has now increased in each of the past 21 months. |
No 11 |
54.1 |
|
Oct-2024 |
|
| |
|
|
|
Service sector reports strong growth and steeper price pressures in September. Business Activity Index posted 55.2 in September, down from 55.7 in August but still signaling a marked monthly increase in service sector output at the end of the third quarter, and one that was among the strongest in the past two-and-a-half years. The S&P Global US Composite PMI Output Index posted 54.0 in September, down from 54.6 in August but still signaling a solid monthly improvement in business activity at the end of the third quarter. Divergent trends between the two monitored sectors persisted, however, with growth centred on the service sector as the manufacturing downturn deepened. |
No 10 |
54.0 |
|
Sep-2024 |
|
| |
|
|
|
The S&P Global US Composite PMI was revised to 54.6 in August 2024, from the preliminary estimate of 54.1 and a slight increase from July's 54.3. The latest reading signaled the 19th consecutive month of expansion in the US private sector and at a solid pace. Growth was led by the service sector (PMI at 55.7 vs 55 in July), which experienced its fastest pace of activity since March 2022. Meanwhile, manufacturing activity (PMI at 47.9 vs 49.6) contracted for the second month in August and at a marked pace. New orders growth in services outweighed a decline in manufacturing. In the meantime, staffing levels were down for the first time in three months, as both sectors reported declines. As for prices, input costs continued to rise sharply in August, though the rate of selling price inflation slowed to a seven-month low, driven by a more modest increase in the services sector. |
No 9 |
54.6 |
|
Aug-2024 |
|
| |
|
|
|
The S&P Global US Composite PMI was revised lower to 54.3 in July 2024, from the preliminary estimate of 55 and a slight decrease from June's 54.8. The revised reading still signaled a solid monthly expansion in private sector business activity, led by the service sector, while manufacturing output rose only marginally. New business saw an increase, with services outweighing the dip in manufacturing orders |
No 8 |
54.3 |
|
Jul-2024 |
|
| |
|
|
|
Looking at business trends across the combined manufacturing and service sectors, the S&P Global USComposite PMI Output Index* posted 54.8 in June, up from 54.5 in May and signaling the fastest increase in business activity since April 2022. Services activity rose more quickly than manufacturing production.
New orders expand at fastest pace for a year. The seasonally adjusted S&P Global US Services PMI® Business Activity Index increased for the second consecutive month in June, posting 55.3 following a reading of 54.8 in May. Activity in the sector has now risen in each of the past 17 months, with the latest expansion the most pronounced since April 2022. |
No 7 |
54.8 |
|
Jun-2024 |
|
| |
|
|
|
The S&P Global US Composite PMI rose to 54.5 in May 2024, up sharply from 51.3 in April and above a preliminary estimate of 54.4. This marks the strongest increase in business activity since April 2022, as growth accelerated in both manufacturing (PMI at 51.3 vs 50.3 in April) and services (PMI at 54.8 vs 51.3). Companies boosted output due to a renewed rise in new orders, following a slight decline in April, and new export business saw a marginal increase. Employment levels remained steady overall, with increased manufacturing jobs offset by lower staffing in services. Input costs and selling price inflation both accelerated. Business confidence improved slightly, with companies optimistic about future output growth. |
No 6 |
54.5 |
|
May-2024 |
|
| |
|
|
|
The S&P Global US Composite PMI eased to 51.3 in April 2024 from 52.1 in the previous month, pointing to a softer expansion in the country’s private sector activity, but revised higher from the flash estimate of 50.9. The slower growth in activity was carried by the services sector (51.3 vs 51.7 in March), offsetting a stall in the manufacturing sector (50 vs 51.9). New business at the aggregate level declined for the first time in six months amid renewed contractions in both factories and service providers, although manufacturers noted a fresh uptick in new business from abroad. Still, lower backlogs allowed both sectors to notch slight expansions in output. In the meantime, employment decreased to end a 45-month sequence of job creation. On the price front, both input costs and output charges slowed. Looking forward, business confidence was also softer, but expectations for the next 12 months remained in the positive territory. |
No 5 |
51.3 |
|
Apr-2024 |
|
| |
|
|
|
The S&P Global US Composite PMI remained relatively steady at 52.1 in March 2024, just a notch below the preliminary estimate of 52.2 and slightly lower than the prior month's eight-month low of 52.5. Still, this figure still indicated a robust monthly uptick in overall business activity, with factory activity rising at its swiftest pace in nearly two years and growth in the service sector moderating slightly. Although there was only a modest increase in total new orders, international demand remained stable. Moreover, employment continued its upward trajectory, and backlogs of work saw a reduction. Turning to pricing dynamics, both input costs and output prices saw accelerated inflation, reaching six- and ten-month highs respectively. Lastly, business confidence saw an uptick in March. |
No 4 |
52.1 |
|
Mar-2024 |
|
| |
|
|
|
The S&P Global US Composite PMI was revised higher to 52.5 in February 2024, from the preliminary estimate of 51.4 and up from 52 in January. It was the highest reading since June 2023, as manufacturing production saw a boost while service sector activity also rose. New order growth slightly slowed, though the overall expansion rate was the second highest since mid-2023. The upturn was supported by a rise in new export orders for goods. February showed a general decrease in cost pressures, with input prices increasing at the slowest rate since October 2020. Despite this, firms aimed to pass on higher costs to customers, resulting in an uptick in selling price inflation from January. Total employment growth remained modest at the start of the first quarter, with manufacturers increasing hiring while service providers showed restrained job creation due to cost-cutting measures and labor shortages. |
No 3 |
52.5 |
|
Feb-2024 |
|
| |
|
|
|
US Private Sector Output Expands the Most in 6 Months.The S&P Global US Composite PMI for January 2024 stood at 52.0, little-changed from the preliminary estimate of 52.3 and an increase from December's 50.9. This latest reading indicates a modest uptick in business activity, marking the most significant increase since July 2023, driven by a faster rise in service sector output. On the other hand, manufacturing production continued to contract. Inflows of new orders increased the most for seven months, despite being weighed down by a second successive monthly drop in new export orders. On the price front, input price inflation eased to the lowest since May 2020. Finally, business confidence reached a 20-month high. |
No 2 |
52.0 |
|
Jan-2024 |
|
| |
|
|
|
The S&P Global US Composite PMI came in at 50.9 in December 2023, little-changed from the initial projection of 51.0 and November's 50.7. This latest figure signaled a marginal upturn in business activity, marking the swiftest expansion since July, primarily propelled by continued growth in the service sector, although manufacturing production experienced a renewed decline. Similarly, service providers saw a stronger surge in new sales, contrasting with goods producers who faced a faster decline in new business. Despite this, employment levels saw a modest increase. In terms of pricing dynamics, total input costs spiked at a sharper rate during December, while inflation in selling prices slowed down. |
No 1 |
50.9 |
|
Dec-2023 |
|
| |
|
|
|
|
|
|
|
|
| |
|
|
|
|
|
| |
|
|
|
|
|
|
|
|
|
|
|
|
|
|
|
Brief News | 2023 |
|
|
PMI Services Final | Business Activity |
|
Today's Week |
|
|
|
|
|
|
|
|
|
|
|
|
|
PMI Services Final (At 9:45)
| DATE/WEEK |
HIGHLIGHTS |
FOR |
COMPO |
|
The S&P Global US Composite PMI was confirmed at 50.7 in November 2023, unchanged from the previous month's three-month high, indicating a marginal upturn in business activity. Output grew in both the manufacturing and services sectors, although only at a slight pace. New business returned to growth, marking the end of a three-month decline, driven by an increase in new export business. Meanwhile, employment levels were little-changed, with the corresponding sub-index hitting its lowest reading since June 2020. Regarding prices, input costs rose at the slowest pace in over three years, while output charges increased at a sharper rate as service providers raised selling prices more steeply. |
No 12 |
50.7 |
|
Nov-2023 |
|
| |
|
|
|
The S&P Global US Composite PMI was revised slightly lower to 50.7 in October 2023, down from the preliminary estimate of 51.0 and compared with 50.2 in the previous two months. The latest reading indicated a marginal rise in business activity at private sector firms, as manufacturers and service providers experienced a quicker rise in output, despite fragile demand conditions. New orders and exports continued to decline, while employment levels grew, driven by the service sector. On the price front, the rates of input and output cost inflation slowed to a three-year low. |
No 11 |
50.7 |
|
Oct-2023 |
|
| |
|
|
|
The S&P Global US Composite PMI stood at 50.2 in September 2023, slightly up from the preliminary estimate of 50.1, indicating broadly unchanged business activity across the private sector for the second consecutive month. The service sector's output stagnated, while manufacturing production returned to growth, although the expansion was modest. New orders saw a sharp decline, and backlogs of work fell at a faster rate, while employment continued to rise at the quickest pace since June. On the price front, input costs and output charges increased at faster rates than in August, driven by rising material and transportation costs due to higher oil prices. Finally, firms were more optimistic in their expectations for output over the coming year in September, largely influenced by an uptick in confidence among manufacturing firms. |
No 10 |
50.2 |
|
Sep-2023 |
|
| |
|
|
|
The S&P Global US Composite PMI was revised slightly lower to 50.2 in August 2023, down from the preliminary estimate of 50.4 and the previous month's reading of 52.0. This latest figure indicates the slowest rate of business activity increase in US private sector firms since February, due to a weaker expansion in the service sector and a renewed decline in manufacturing output. While there was a marginal decrease in total new business, it marked the first decline since February. Furthermore, new export orders returned to contraction, driven by declining demand for goods, despite increased spending on services. The rate of job creation reached its lowest point since October 2022, reflecting ongoing evidence of spare capacity and a sharper decline in backlogs of work. Regarding prices, cost pressures intensified, but the rate of output charge inflation eased. |
No 9 |
50.2 |
|
Aug-2023 |
|
| |
|
|
|
The S&P Global US Composite PMI declined to 52 in July of 2023 from 53.2 in the previous month, in line with preliminary estimates, to point to the sixth consecutive month of expansion in private-sector business activity, albeit at the softest since February. Growth was mostly supported by resilient performances in the services sector (52.3 vs 54.4 in June), offsetting a third month of contraction for manufacturers (49 vs 46.3). Aggregate new orders saw the smallest uptick in four months during the period, as rising interest rates continued to press against consumer spending. Consequently, output also edged higher at a lower pace. Still, firms continued to increase staffing numbers, largely due to faster hiring in factories. In the meantime, input prices at the aggregate level remained at historically high levels, largely due to sharp hikes in wages of service-sector employees, translating to higher output charges across the board. |
No 8 |
52.0 |
|
Jul-2023 |
|
| |
|
|
|
The S&P Global US Composite PMI was revised upward to 53.2 in June 2023 from the preliminary estimate of 53.0. However, it remained below May's reading of 54.3, indicating a solid but slower upturn in business activity. Service providers experienced a softer increase in output, while there was a renewed contraction in manufacturing production. New order growth slowed due to a continued decline in export orders, while employment saw a moderate increase. On the pricing front, cost pressures intensified, with a second consecutive fall in cost burdens among manufacturers being offset by the sharpest rise in service sector costs recorded since January. Output charges continued to rise at a strong rate, well above the pre-pandemic average. |
No 7 |
53.2 |
|
Jun-2023 |
|
| |
|
|
|
The S&P Global US Composite PMI came in at 54.3 in May 2023, little-changed from a preliminary estimate of 54.5 and above April's final reading of 53.4. The latest PMI signaled the fastest expansion in business activity for just over a year, driven by the service sector. This helped offset a weaker rise in manufacturing production. Total new business continued to increase, despite a sharp drop in overseas goods trade, employment rose at a solid pace and backlogs of work fell. Finally, inflationary pressures eased. |
No 6 |
|
|
May-2023 |
|
| |
|
|
|
The S&P Global US Composite PMI rose to 53.5 in April 2023, up from 52.3 in the previous month, to signal the quickest upturn in business activity since May 2022. The faster rise in activity was broad-based, with the services activity growth hitting a 12-month high and manufacturing output expanding modestly but at the fastest rate since May 2022. New orders at US firms increased at the sharpest rate for 11 months, despite a continued decline in new export orders, amid new client wins, improved customer confidence and successful marketing strategies. In addition, employment growth was the quickest since last July, while backlogs of work increased for the second month running as companies mentioned further struggles finding suitable candidates and retaining staff amid rising wage costs. On the price front, rates of input cost and output charge inflation picked up to a three and seven-month high, respectively. Finally, business confidence rose to the second-highest since May 2022. |
No 5 |
53.5 |
|
Apr-2023 |
|
| |
|
|
|
The S&P Global US Composite PMI came in at 52.3 in March 2023, revised lower from the preliminary estimate of 53.3 but above February final reading of 50.1. The latest PMI figure signaled a modest rise in business activity that was the fastest since last June, mainly led by a steeper increase in service sector output. Meanwhile, manufacturers recorded only a fractional advance in output. Overall new business grew for the first time in six months driven by solid domestic demand. Employment levels rose at a faster rate, while backlogs of work increased for the first time since last September. On the price front, a further marked rise in input costs was reflected in a faster increase in output charges. |
No 4 |
52.3 |
|
Mar-2023 |
|
| |
|
|
|
The S&P Global US Composite PMI jumped to 53.3 in March of 2023, expanding from 50.1 in the previous month and firmly above market estimates, according to preliminary data. It was the fastest pace of expansion in private-sector activity since May 2022, as growth for the services sector (53.8 vs 50.6 in February) offset a slower decline for manufacturers (49.3 vs 47.3). Output grew in both sectors, underpinned by the greatest improvement in delivery times on record. In the meantime, new orders increased for the first time since September 2022 as firms scored new clients and introduced new products. Higher demand for new business led backlogs of work to rise for the first time in six months, driving companies to turn up hiring activity. Meanwhile, input inflation softened to its second-slowest pace since October 2020, although price growth remained high by historical standards. Still, uncertainty in financial markets pressure business confidence to a three-month low. |
No 3 |
53.3 |
|
Feb-2023 |
|
| |
|
|
|
The S&P Global US Composite PMI was revised slightly higher to 46.8 in January 2023, up from a preliminary estimate of 46.6 and above December's four-month low of 45.0. The latest reading pointed to a softer contraction in the US private sector, as both manufacturing and service sectors shrank at slowest rates. Total new orders fell modestly in January, amid weak domestic and foreign client demand, while backlogs of work continued to decline. In addition, employment rose only marginally. On the price front, the rate of cost inflation ticked higher, while increases in selling prices moderated again. |
No 2 |
46.8 |
|
Jan-2023 |
|
| |
|
|
|
US Private Sector Output Falls Sharply at End of 2022. The S&P Global US Composite PMI was revised slightly higher to 45.0 in December 2022, up from a preliminary estimate of 44.6 and compared with November's 46.4. Still, the latest reading indicated a strong decline in private sector business activity, led by sharp declines in both manufacturing and services output. Overall new business dropped the most since May 2020 amid a broad-based downturn in client demand, while the rate of job creation was only marginal overall and the second-weakest since September 2021. On the price front, inflationary pressures eased notably at the end of the year, as cost burdens rose at the slowest pace since October 2020 and selling prices increased the least in over two years |
No 1 |
45.0 |
|
Dec-2022 |
|
| |
|
|
|
|
|
|
|
|
| |
|
|
|
|
|
| |
|
|
|
|
|
|
|
|
|
|
|
|
|
|
|
Brief News | 2021-2022 |
|
|
PMI Services Final | Business Activity |
|
Today's Week |
|
|
|
|
|
|
|
|
|
|
|
|
|
PMI Services Final (At 9:45)
| DATE/WEEK |
HIGHLIGHTS |
FOR |
COMPO |
|
The S&P Global US Composite PMI came in at 46.4 in November 2022, little-changed from a preliminary estimate of 46.3 and down from 48.2 in the previous month. The latest reading pointed to a fifth consecutive decline in private sector business activity, driven by a faster decrease in service sector activity and a renewed downturn in manufacturing production. Incoming new business dropped at a faster rate, with new business from abroad also falling further and at a strong pace. Meanwhile, employment continued to rise, despite a sharper decrease in backlogs of work. On the price front, cost burdens inflation eased to the lowest since the end of 2020. Meanwhile, discounts and concessions aimed at driving new sales led to the softest uptick in output charges for over two years. |
No 12 |
46.4 |
|
Nov-2022 |
|
| |
|
|
|
Composite PMI was revised higher to 48.2 in October 2022 from a preliminary estimate of 47.3, compared with September's 49.5. The latest data signaled a fourth consecutive month of contraction in the private sector, driven by a sharper decline in service activity. Meanwhile, manufacturing output rose marginally. Overall new business dropped back into contraction, with dollar strength and inflation weighing on new export orders which fell further; while employment increased slightly and backlogs of work posted a solid fall. On the price front, inflationary pressures softened amid reports of reductions in some material costs which were passed through to customers via concessions. Finally, output expectations for the year ahead weakened.
|
No 11 |
48.2 |
|
Oct-2022 |
|
| |
|
|
|
The S&P Global US Composite PMI was revised slightly higher to 49.5 in September of 2022 from a preliminary of 49.3, pointing to a much smaller contraction in private sector activity than in the previous month (44.6). A further decline in output at service providers (49.3) outweighed a slight expansion at manufacturers (52). Contributing to the softer decrease in output was a renewed rise in new business at private sector firms. The expansion was broad based, and driven by domestic demand as new export orders fell further. Price pressures across the manufacturing and service sectors eased amid reports of some input costs falling which were passed on to clients in an effort to drive sales. Rates of inflation remained historically elevated, but among the slowest for almost two years. Greater business confidence was led by service providers, whilst manufacturers were slightly more downbeat than in August amid inflation concerns. |
No 10 |
49.5 |
|
Sep-2022 |
|
| |
|
|
|
The S&P Global US Composite PMI was revised lower to 44.6 in August of 2022 from a preliminary estimate of 45, down from the 47.7 in July to signal the second consecutive contraction in private sector business and the sharpest since May 2020. The decline in service sector activity (43.7 vs 37.3 in July) more than offset the slight growth for US manufacturers (51.5 vs 52.2). Service providers registered a sharp decline in production and the downturn in new orders accelerated to a two-year low, while output and new business also contracted for US factories. Although still rising markedly, the rate of cost inflation softened to the slowest pace since January 2021, as lower demand drove companies to offer concessions to clients. In the meantime, employment growth dropped to January lows for both sectors. Pressure on capacity eased further for private companies as weaker demand cleared backlogs of work for service providers, while that for manufacturers rose marginally. |
No 9 |
44.6 |
|
Aug-2022 |
|
| |
|
|
|
The S&P Global US Composite PMI was revised higher to 47.7 in July of 2022 from a preliminary of 47.5, down from 52.3 in June to signal the first contraction in private sector business activity since June 2020. Despite a decrease in manufacturing new order inflows, total sales rose during July, as service providers signalled a return to growth in client demand. New export orders weighed on overall new business again, as foreign client demand deteriorated. Although still rising markedly, the rate of cost inflation softened to the slowest for six months. Hikes in input prices were linked to higher fuel, transportation, wage and material costs which continued to be passed through to customers. Nonetheless, output charges increased at the slowest pace since March 2021. Private sector firms expanded their workforce numbers at the slowest pace since January. Pressure on capacity eased at service providers, while manufacturers only recorded a slight uptick in work-in-han |
No 8 |
47.7 |
|
jul-2022 |
|
| |
|
|
|
The S&P Global US Composite PMI was revised higher to 52.3 in June of 2022 from a preliminary of 51.2, down from 53.6 in May, the lowest since January. The slowdown in growth was broad based, with both manufacturing and services seeing weaker increases at the end of the second quarter. Business confidence also waned, dropping to the lowest since September 2020. A weaker expansion in output reflected a renewed contraction in new orders, the first in almost two years. New business was down across both monitored sectors, with new export orders also falling. Rates of input cost and output price inflation remained sharp in June, but eased amid softer demand conditions. The main positive from the latest surveys was a further marked increase in employment, with job creation led by the service sector. |
No 7 |
52.3 |
|
Jun-2022 |
|
| |
|
|
|
The S&P Global US Composite PMI was revised lower to 53.6 in May of 2022 from a preliminary of 53.8, down from 56.0 in April, to signal a solid but slower upturn in private sector business activity. The softer rise in output reflected slower increases in the manufacturing and service sectors, amid hikes in selling prices and supply-chain disruption. The rise in new orders was the joint-softest since September 2020 and foreign client demand increased at the weakest rate since January. Inflationary pressures remained marked in May, as the rate of increase in cost burdens accelerated again. Although the pace of input price inflation quickened to a series high, there was evidence of a hesitancy to completely pass higher costs on, as output charges rose at a softer pace. Backlogs of work continued to expand sharply, however, as firms stepped up their hiring activity in response. |
No 6 |
53.6 |
|
May-2022 |
|
| |
|
|
|
PMI Composite Final comes in higher from consensus and lower M/M. April PMI Composite Final: 56.0 vs. 55.1 consensus vs. 57.7 prior. The rate of output growth eased to the slowest for three months, but was sharp overall. Input and labor shortages pushed up cost burdens to the greatest extent on record. New export orders rose at the quickest rate since data collection for the respective seasonally adjusted series began in September 2014. Service PMI: 55.6 vs. 54.7 consensus vs. 58.0 prior. Higher wage, transportation and material costs drove up input prices. The rate of input price inflation accelerated for the third successive month to the fastest in 11-and-a-half years of data collection. Backlogs of continued to rise, thereby extending the current sequence of expansion that began in July 2020. |
No 5 |
56.0 |
|
Apr-2022 |
|
| |
|
|
|
US Private Sector Growth Accelerates to 8-Month High. The final services PMI for March 2022 is expected to hold at the 58.5 flash which showed no significant Ukraine effects. The S&P Global US Composite PMI was revised lower to 57.7 in March of 2022 from a preliminary of 58.5, but was still up from 55.9 in February 2022, to signal a sharp expansion in business activity across the private sector. The rate of growth was the fastest since last July, as manufacturers and service providers recorded steeper upturns in output. Supporting the sharper uptick in activity was the quickest rise in new business since June 2021. Domestic and foreign client demand strengthened as easing COVID-19 restrictions continued to boost new sales. Meanwhile, inflationary pressures intensified as supplier costs soared. Input prices rose at one of the fastest rates on record, whilst costs passed through to customers drove up output charges at the joint-sharpest pace since data collection began in October 2009. Although private sector employment grew at a steep pace, pressure on capacity mounted amid severe raw material shortages, with backlogs of work expanding at a series record rate. |
No 4 |
57.7 |
|
Mar-2022 |
|
| |
|
|
|
US Composite PMI Remains Strong: Markit. The IHS Markit US Composite PMI was revised slightly lower to 55.9 in February of 2022 from a preliminary of 56, still way better than January's Omicron-induced low of 51.1. Growth regained momentum at manufacturers (57.3) and service providers (56.5). Stronger demand conditions at private sector firms led to the fastest upturn in new business since July 2021. Greater new sales were supported by increased foreign client demand, as new export orders rose solidly. Inflationary pressures remained elevated, despite manufacturers recording a slight slowdown in hikes in supplier costs. The rate of charge inflation quickened to a four-month high amid the sharpest rise in service sector output prices on record. Further expansions in backlogs of work at private sector firms led to a greater impetus to hire new staff. Despite ongoing reports of labor shortages, firms were able to increase workforce numbers at the steepest pace since May 2021. |
No 3 |
55.9 |
|
Feb-2022 |
|
| |
|
|
|
PMI Composite Index (Final): 51.1 vs. 50.8 consensus and 57.0 prior. US Composite PMI Falls Less than Anticipated. The IHS Markit US Composite PMI was revised slightly higher to 51.1 in January of 2022 from a preliminary of 50.8, but continued to point to the smallest increase in private sector activity since July of 2020, as both manufacturers (55.5 vs 57.7) and service providers (51.2 vs 57.6) registered a considerable slowdown. The expansion in new business also softened to the slowest since December 2020 as the Omicron wave weighed on demand conditions. A decline in manufacturing export orders dampened private sector growth in new business from abroad. Cost pressures eased, as the pace of input price inflation softened to the slowest since March 2021. The rate of output charge inflation, however, was broadly unchanged from December, and marked overall. Despite reports of challenges retaining and finding staff, private sector firms continued to add to their workforce numbers during January. Subsequently, the rate of growth in backlogs of work eased to the slowest since June 2021. |
No 2 |
51.1 |
|
Jan-2022 |
|
| |
|
|
|
December 2021 PMI Composite final comes in lower from prior month. December 2021 U.S. PMI Composite Index (Final): 57.0 vs. 56.9 consensus and 57.2 prior.The data indicated a steep increase in private sector business activity, albeit largely driven by the service sector as manufacturing production rose at a relatively muted pace. New business rose sharply amid a pick-up in service sector client demand. Overall new order growth was the quickest for five months; new export orders, meanwhile, increased for the second month running amid greater client demand at manufacturers and service providers. Service Index: 57.6 vs. 57.5 consensus, 58 prior; this signals a sharp upturn in service sector business activity, despite the pace of growth easing to a 3-month low. |
No 1 |
57.0 |
|
Dec-2021 |
|
| |
|
|
|
|
November PMI Composite final print inches marginally higher, comes in above consensus. Fri, Dec. 03, 2021. November U.S. PMI Composite Index (Final): 57.2 vs. 56.5 consensus and 57.6 prior. The upturn in new business was solid midway through Q4 amid a strong expansion in services new orders; foreign client demand signaled a renewed rise. Despite employment rising at the fastest pace since June, firms continued to struggle to work through backlogs of work, which rose at the second-fastest pace on record. |
No 12 |
57.2 |
|
Nov-2021 |
|
| |
|
|
|
October U.S. PMI Composite Index (Final): 57.6 vs. 57.3 consensus and 55.0 prior. The IHS Markit US Composite PMI Output Index* posted 57.6 in October, up from 55.0 in September to signal the fastest rise in private sector output since July. Although manufacturing production continued to be constrained by supply issues, the overall expansion was supported by a sharper service sector upturn. Contributing to the overall expansion was a faster increase in new business. The rise was supported by sharp upticks in new orders at services providers and manufacturers. |
No 11 |
57.6 |
|
Oct-2021 |
|
| |
|
|
|
September PMI Composite marginally lower from prior level on slower business expansion. Tue, Oct. 05, 2021 for September U.S. PMI Composite Index (Final): 55.0 vs. 54.5 consensus and 55.4 prior. This indicates a slower expansion in private sector business activity; rate of growth was the softest in a year amid slower upturns in both monitored. September PMI Composite Index: 54.3 vs. 54.4 consensus and 54.6 prior. Service: 54.6 vs. 54.6 consensus and 55.0 prior. Business activity rises further amid stronger expansion in new sales. Employment growth remains historically elevated. Selling prices increase at sharpest pace for two years. |
No 10 |
55.0 |
|
Sep-2021 |
|
| |
|
|
|
The IHS Markit US Composite PMI was confirmed at 55.4 in August 2021, down from 59.9 in the previous month, to signal the slowest expansion in private sector output in 2021 to date. The slower overall upturn stemmed from weaker expansions in the manufacturing and service sectors. Overall new business and employment increased at softer rates, while backlogs of work rose markedly. Meanwhile, Inflationary pressures across the private sector remained elevated midway through the third quarter, as input costs rose substantially and the rate of charge inflation ticked higher. |
No 9 |
55.4 |
|
Aug-2021 |
|
| |
|
|
|
July U.S. PMI composite tweak past estimate. Wed, Aug. 04, 2021. July U.S. PMI Composite (Final): 59.9 vs. 59.7 consensus and 63.7 prior. The latest upturn in business activity was marked overall, despite easing to a five-month low. Greater output was linked to strong demand conditions and a sustained increase in new orders. Some companies stated that capacity constraints hampered activity growth, however. New business continued to rise in July, and at one of the fastest rates since data collection began in October 2009. Services PMI: 59.9 vs. 59.8 consensus and 64.6 prior. |
No 8 |
59.9 |
|
Jul-2021 |
|
| |
|
|
|
The IHS Markit US Composite PMI was revised slightly lower to 63.7 in June 2021, from a preliminary estimate of 63.9 and compared with May's all-time high of 68.7. Still, the rate of growth in activity was substantial and the second-fastest on record as new business and export orders continued to increase at a solid pace. Meanwhile, the pace of job creation eased amid challenges to hire new employees. On the price front, the rate of cost inflation was the second quickest on record. Firms passed on greater costs to clients via the second-sharpest increase in average selling prices for goods and services since data collection began in 2009. |
No 7 |
63.7 |
|
Jun-2021 |
|
| |
|
|
|
May U.S. PMI Composite revised higher, beating consensus. Thu, Jun. 03, 2021 for May U.S. PMI Composite (Final): 68.7 vs. 68.1 consensus and 68.1 prior. Signals steepest upturn in business activity since data collection began in October 2009. The overall upturn was supported by a sharper expansion in new business. Rates of growth were the fastest on record in both the manufacturing and service sectors, IHS Markit said. Services PMI: 70.4 vs. 70.1 consensus and 70.1 prior. Inflationary pressures increased in May. As a result, firms tried to pass on the higher costs to clients, with the pace of charge inflation rising to a new series high. Rate of job creation softened from April as firms were challenged in finding suitable job candidates. |
No 6 |
68.7 |
|
May-2021 |
|
| |
|
|
|
U.S. PMI composite reports strongest surge in a decade amid vaccine roll-out. Wed, May 05, 2021.
April U.S. PMI Composite Index (final): 63.5 vs. 62.2 consensus and 59.7 prior. Service Index: 64.7 vs. 63.1 consensus, 60.4 prior. The Composite PMI Index posted 63.5 in April signals the sharpest upturn in private sector output since data collection began in October 2009. “Thanks to the cocktail of a successful vaccine roll-out, the reopening of the economy, ultra-accommodative monetary policy and injection of fresh fiscal stimulus, businesses are reporting the strongest surge in demand seen for at least a decade," said Chris Williamson, Chief Business Economist. |
No 5 |
63.5 |
|
Apr-2021 |
|
| |
|
|
|
March PMI Composite Index shows fastest growth in service index in seven years. Mon, Apr. 05, 2021
March U.S. PMI Composite Index (final): 59.7 vs. 58.1 consensus and 59.5 prior. Reflects fastest upturn in private sector business activity since August 2014. "Although the expansion in manufacturing sector production eased, service providers registered a marked rise in output," the IHS Market report said. Service Index: 60.4 vs. 60.0 consensus, 59.8 prior. In the services, index, the rate of output growth signaled was fastest since July 2014. |
No 4 |
59.7 |
|
Mar-2021 |
|
| |
|
|
|
The IHS Markit US Composite PMI was revised higher to 59.5 in February 2021, up from a preliminary estimate of 58.8, signaling the sharpest pace of expansion in the private sector activity since August 2014. Service sector output expanded by the most in over six-and-a-half years, while manufacturing production growth moderated, but remained among the highest seen over the past decade. Private sector new order growth was the fastest since April 2018, while employment rose only fractionally. On the price front, input cost inflation accelerated to the fastest since data collection began in October 2009. As a result, firms raised their selling prices at the second-steepest pace on record due to the partial pass-through of greater costs to clients. Finally, business confidence moderated from that seen in January. |
No 3 |
59.5 |
|
Feb-2021 |
|
| |
|
|
|
The IHS Markit US Composite PMI was revised higher to 58.7 in January of 2021 from a preliminary of 58 and 55.3 in December. the reading pointed to the strongest expansion in private sector activity since March of 2015, amid sharper rises in manufacturing (record of 59.2 vs 57.1) and service sector activity (58.3 vs 54.8). Business confidence improved in January, amid stronger output expectations at service providers. Manufacturers were slightly less upbeat, but still anticipate higher output in one year's time. |
No 2 |
58.7 |
|
Jan-2021 |
|
| |
|
|
|
The IHS Markit US Composite PMI was revised lower to 55.3 in December 2020, from a preliminary estimate of 55.7 and below November’s 68-month high of 58.6. The latest reading signaled the slowest upturn in business activity for three months, due to a slowdown in new business growth amid rising COVID-19 cases. In addition, the rate of job creation eased notably since November. On the price front, cost burdens rose at the sharpest pace since data collection began in October 2009. Looking ahead, business expectations moderated to a three-month low in December. |
No 1 |
55.3 |
|
Dec-2020 |
|
| |
|
|
|
|
|
|
|
|
| |
|
|
|
|
|
| |
|
Legends: |
|
Delayed |
|
Positive View |
|
Negative View |
|
Neutral View |
|
Non Available |
|
|
|
|
|
|
|
|
|
|
|
|
|
|
|
|
|
|
|
|
| |
|
|
|
|
|
|
|
|
|
|
|
|
|
|
|
|
|
|
|
|
|
Definitions | Explain |
|
|
PMI Services Final | Business Activity |
|
Today's Week |
|
|
|
|
|
|
|
|
|
|
|
|
| |
|
|
|
|
| |
|
| PMI Services Final |
1. PMI Services Final - PMI Composite - Business Activity (3rd of month)
US Services Purchasing Managers' Index (PMI)
Provide a leading indication of what is happening in the private sector services economy.
A composite PMI™ is the weighted average of manufacturing and service sector PMIs for a given geography or economy, produced by S&P Global. Weights are derived from official data relating to each sector’s contribution to GDP (value added).
1- Composite (This is the important figure)
2- Services
2. PMI Manufacturing Final - Manufacturing (1st of month)
The Markit PMI manufacturing data.
The seasonally adjusted S&P Global US Manufacturing Purchasing Managers’ Index™ (PMI)
1- Prev Flash
2- Index
3. PMI Composite Flash - Business Activity (24th of month)
10 days ahead of the final report
The flash Composite Purchasing Managers' Index (PMI)
The data are produced by IHS Markit.
Flash PMI™ (Purchasing Managers’ Index™) data are published by S&P Global and are early estimates of the company’s final PMI numbers. The Flash PMI data are published approximately one week before final PMI data each month and are typically based on 85%-90% of total PMI responses received each month.
1- Composite
2- Services
3- Manufacturing
|
|
|
| |
|
|
|
|
|
|
|
|
|
|
|
|
|
|
|
|
|
|
|
|
|
Data | Source |
|
|
PMI Services Final | Business Activity |
|
Today's Week |
|
|
|
|
|
|
|
|
|
|
|
|
| |
|
|
|
|
|
|
| DATA INFORMATION |
PMI SERVICES FINAL |
| SOURCE |
The Conference Board |
| WEB |
http://www.conference-board.org |
| FREQUENCY |
Monthly |
| AVAILABILITY |
Third week of the month. |
| COVERAGE |
Data are for the previous month. Data for June are released in July. |
| REVISIONS |
Yes |
| IMPORTANCE |
Business Activity - Low Importance |
|
| |
|
|
|
|
|
|
|
|
|
|
|
|